
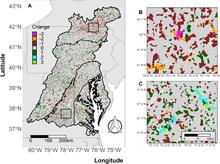
Map showing change in aggregated ecoregion-specific selected mean metric deciles from 2001 to 2016
By Chesapeake Bay Activities
January 2022 (approx.)

Detailed Description
Map showing change in aggregated ecoregion-specific selected mean metric deciles from 2001 to 2016 (negative indicates more altered) for nontidal stream reaches in the Chesapeake Bay watershed. Insets show two focus areas to better highlight changes.
Sources/Usage
Public Domain.
From journal article, Using fish community and population indicators to assess the biological condition of streams and rivers of the Chesapeake Bay watershed, USA. https://doi.org/10.1016/j.ecolind.2021.108488
Related

Assessing the habitat conditions to support freshwater fisheries in the Chesapeake Watershed
Issue: The Chesapeake Bay Program partners are striving to improve habitat conditions for recreational fisheries and other native fishes in the Bay and its watershed. While national fish habitat assessments have been conducted, resource managers need more local information to focus restoration and protection efforts in Chesapeake Bay watershed. Conducting the fish-habitat assessments are...
Related
Assessing the habitat conditions to support freshwater fisheries in the Chesapeake Watershed
Issue: The Chesapeake Bay Program partners are striving to improve habitat conditions for recreational fisheries and other native fishes in the Bay and its watershed. While national fish habitat assessments have been conducted, resource managers need more local information to focus restoration and protection efforts in Chesapeake Bay watershed. Conducting the fish-habitat assessments are...