
Livestock water withdrawals in 2015
Images
Explore water-related photography, imagery, and illustrations.
Filter Total Items: 2553

Livestock water withdrawals in 2015

Trends in total water withdrawals by water-use category, 1950–2015
Trends in total water withdrawals by water-use category, 1950–2015Trends in total water withdrawals by water-use category, 1950–2015
Trends in total water withdrawals by water-use category, 1950–2015
Trends in total water withdrawals by water-use category, 1950–2015Trends in total water withdrawals by water-use category, 1950–2015

Artesian Well (cropped), John Pennekamp Coral Reef State Park, Key Lar
Artesian Well (cropped), John Pennekamp Coral Reef State Park, Key LarArtesian Well (cropped), John Pennekamp Coral Reef State Park, Key Largo, FL
Artesian Well (cropped), John Pennekamp Coral Reef State Park, Key Lar
Artesian Well (cropped), John Pennekamp Coral Reef State Park, Key LarArtesian Well (cropped), John Pennekamp Coral Reef State Park, Key Largo, FL
USGS WAUSP Water Census: Map of National Brackish Groundwater Assessme
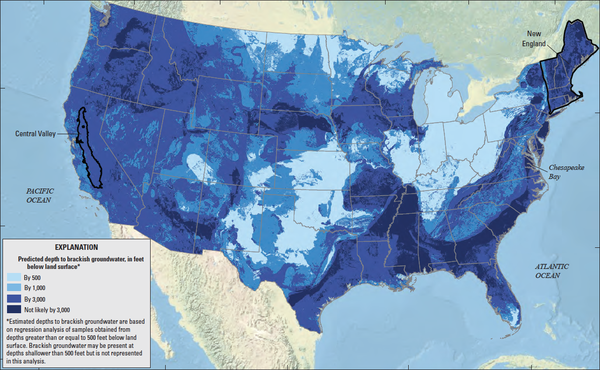
USGS WAUSP Water Census: Map of National Brackish Groundwater AssessmeUSGS WAUSP Water Census: Map of National Brackish Groundwater Assessment from USGS professional paper 1833 "Brackish Groundwater In The United States."
USGS WAUSP Water Census: Map of National Brackish Groundwater Assessme
USGS WAUSP Water Census: Map of National Brackish Groundwater AssessmeUSGS WAUSP Water Census: Map of National Brackish Groundwater Assessment from USGS professional paper 1833 "Brackish Groundwater In The United States."

USGS gage 01419500 Willowemoc Creek near Livingston Manor, NY
USGS gage 01419500 Willowemoc Creek near Livingston Manor, NYUSGS gage 01419500 Willowemoc Creek near Livingston Manor, NY
USGS gage 01419500 Willowemoc Creek near Livingston Manor, NY
USGS gage 01419500 Willowemoc Creek near Livingston Manor, NYUSGS gage 01419500 Willowemoc Creek near Livingston Manor, NY

Overview of Water Quality in Principal Aquifers
Overview of Water Quality in Principal Aquifers

USGS gage 15275100 Chester Creek at Arctic Boulevard at Anchorage, AK

Data Pipelines
Enhancing scientific research with reproducible, collaborative, and scalable data analysis workflows and methodologies.Example R code leveraging a reproducible data pipeline with the package “remake” to handle dependencies and organize workflow.
Enhancing scientific research with reproducible, collaborative, and scalable data analysis workflows and methodologies.Example R code leveraging a reproducible data pipeline with the package “remake” to handle dependencies and organize workflow.

Multi-figure, interactive data visualization of US Water Use
Multi-figure, interactive data visualization of US Water UseA U.S. national map with notes about areas of high water use in 2015.
Multi-figure, interactive data visualization of US Water Use
Multi-figure, interactive data visualization of US Water UseA U.S. national map with notes about areas of high water use in 2015.

Data Science: Lake Mead Water Level Decline Visualization
Data Science: Lake Mead Water Level Decline VisualizationData Science: Lake Mead Water Level Decline Visualization. Click here to read more about USGS Water Resources Mission Area Data Science.
Data Science: Lake Mead Water Level Decline Visualization
Data Science: Lake Mead Water Level Decline VisualizationData Science: Lake Mead Water Level Decline Visualization. Click here to read more about USGS Water Resources Mission Area Data Science.

Headwaters of the Colorado River
The headwaters of the Colorado and Gunnison Rivers was selected in 2019 as an Integrated Water Science Basin.
The headwaters of the Colorado and Gunnison Rivers was selected in 2019 as an Integrated Water Science Basin.

Collecting Groundwater Samples in Mammoth, CA
Snow falls on USGS Hydrologist, Joe Nawikas, as he collects groundwater samples in Mammoth, California.
Snow falls on USGS Hydrologist, Joe Nawikas, as he collects groundwater samples in Mammoth, California.

Collecting geophysics data at Pinnacles National Park
Collecting geophysics data at Pinnacles National ParkResearch Hydrologist Paul Hsieh collects seismic data during a groundwater study at Pinnacles National Park in California. The red seismometer on the ground measures ambient seismic noise, which includes microtremors induced by wind, ocean waves, and human activity.

USGS scientists collect sediment cores from Lake Powell
USGS scientists collect sediment cores from Lake PowellUSGS scientists collect sediment cores to examine the amount and distribution of metals within Lake Powell.
USGS scientists collect sediment cores from Lake Powell
USGS scientists collect sediment cores from Lake PowellUSGS scientists collect sediment cores to examine the amount and distribution of metals within Lake Powell.

Kelvey Merill ADCP measurement at Perdanales River near Fredricksburg
Kelvey Merill ADCP measurement at Perdanales River near FredricksburgKelvey Merill ADCP measurement at Perdanales River near Fredricksburg - Lynne Fahlquist USGS.
Kelvey Merill ADCP measurement at Perdanales River near Fredricksburg
Kelvey Merill ADCP measurement at Perdanales River near FredricksburgKelvey Merill ADCP measurement at Perdanales River near Fredricksburg - Lynne Fahlquist USGS.

Drill rig to collect sediment samples on Lake Powell.
Drill rig to collect sediment samples on Lake Powell.Drill rig to collect sediment samples on Lake Powell.
Drill rig to collect sediment samples on Lake Powell.
Drill rig to collect sediment samples on Lake Powell.Drill rig to collect sediment samples on Lake Powell.

USGS scientists collect sediment cores on Lake Powell
USGS scientists collect sediment cores on Lake PowellUSGS scientists work with heavy machinery to collect sediment through the full thickness of the San Juan and Colorado River deltas.
USGS scientists collect sediment cores on Lake Powell
USGS scientists collect sediment cores on Lake PowellUSGS scientists work with heavy machinery to collect sediment through the full thickness of the San Juan and Colorado River deltas.

USGS scientists process sediment cores on Lake Powell
USGS scientists process sediment cores on Lake PowellCore processing hut provides a sheltered environment for scientists to process the cores for shipment to the National Lacustrine Core Facility
USGS scientists process sediment cores on Lake Powell
USGS scientists process sediment cores on Lake PowellCore processing hut provides a sheltered environment for scientists to process the cores for shipment to the National Lacustrine Core Facility

USGS scientists collect sediment cores on Lake Powell
USGS scientists collect sediment cores on Lake PowellUSGS scientists collect sediment cores to examine the amount and distribution of metals within Lake Powell.
USGS scientists collect sediment cores on Lake Powell
USGS scientists collect sediment cores on Lake PowellUSGS scientists collect sediment cores to examine the amount and distribution of metals within Lake Powell.

Drone being prepared for survey
In this photo, a small unoccupied aicraft (sUAS) or drone is being prepared to collect thermal infrared data to assess groundwater discharge into Las Vegas Wash, in Clark County, Nevada. The umbrella provides shade to keep the equipment from getting too hot.
In this photo, a small unoccupied aicraft (sUAS) or drone is being prepared to collect thermal infrared data to assess groundwater discharge into Las Vegas Wash, in Clark County, Nevada. The umbrella provides shade to keep the equipment from getting too hot.

GW_Chart Graph of Budget Components from a MT3D-USGS Simulation
GW_Chart Graph of Budget Components from a MT3D-USGS SimulationGraph of budget components from a MT3D-USGS simulation versus time generated by GW_Chart based on results from a hypothetical model.
GW_Chart Graph of Budget Components from a MT3D-USGS Simulation
GW_Chart Graph of Budget Components from a MT3D-USGS SimulationGraph of budget components from a MT3D-USGS simulation versus time generated by GW_Chart based on results from a hypothetical model.