



Public supply refers to water withdrawn by public and private water suppliers that provide water to at least 25 people or have a minimum of 15 connections to users. Public supply water is delivered for domestic (residential), commercial, and industrial purposes.

Public water-supply systems are government or privately run facilities that withdraw water from rivers, lakes, reservoirs, and wells and then deliver it to homes, businesses, and schools. These systems are important to all populations. About 83% of people living in the United States got their water through public water-supply systems in 2020 (Larsen et al. 2025). People living in rural areas or outside of public water-supply areas rely on private well systems. Industry and people located in more densely populated areas depend upon public-supply systems, emphasizing the need for quality data collection for public water-supply systems in the United States.
2020 Water Use
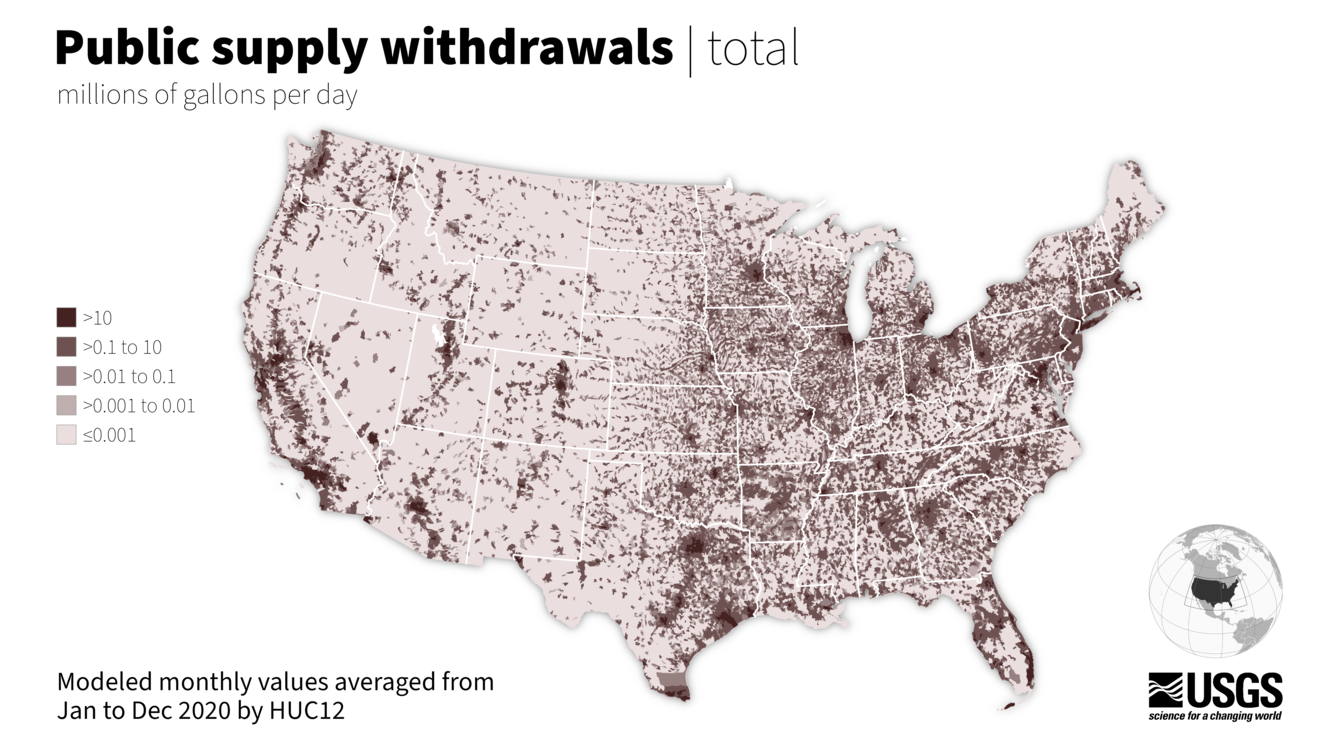
In 2020, about 35,823 million gallons per day (mgd) of water was withdrawn for public supply across the lower 48 United States.
- Withdrawals from surface water totaled 18,586 mgd (about 52%) and from groundwater 17,236 mgd (about 48%).
- Consumptive use accounted for about 12% of the water withdrawn (4,241 mgd), meaning the water withdrawn did not return to local waterbodies or groundwater.
- The Northeast hydrologic region withdrew the most at about 19.9% (7,142 mgd), followed by California-Nevada at about 15% (5,390 mgd). The Northern High Plains region used the least, with about 0.4% (139 mgd).
- Nationally, public supply withdrawals are highest in July at 43,697 mgd, followed by August at 42,975 mgd. January has the lowest at 29,971 mgd.
2020 public supply water use estimates are from Luukkonen et al., 2023 accessed through the National Water Availability Assessment Data Companion, using the hydrologic region boundaries published here.
Public Supply Water Use 1985-2020
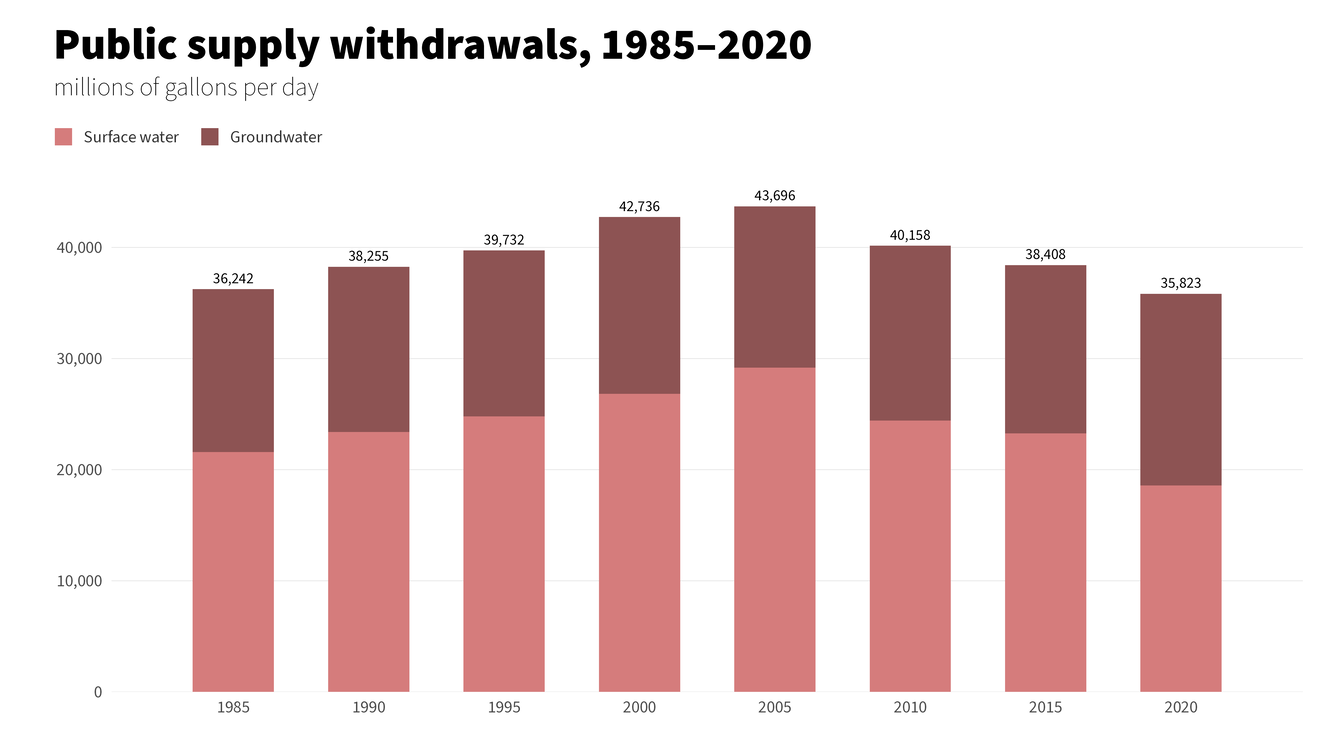
From 1985 to 2015, public supply withdrawals peaked in 2005 at about 43,696 mgd and were about 38,408 mgd in 2015 (+6% from 1985).
- In 2020, withdrawals were about 35,823 Mgal/d. 2020 values are modeled estimates, so the change from 2015 partly reflects different methods.
- Groundwater supplied about 40% of withdrawals in 1985, 39% in 2015, and 48% in 2020.
Estimating Public Supply Water Use
For estimates before 2020, methods for estimating public-supply withdrawals, source of water, population served, and domestic deliveries varied by state. Common sources of information about withdrawals by source included data collected from water suppliers by state water regulatory agencies. Estimates of the population served by public supply were derived using various sources, including reports from state agencies, the EPA SDWIS database, U.S. Census data, and information on service connections from public suppliers. Methods for estimating domestic deliveries included public water supply sales information, calculations using coefficients for per capita use, and development of average percentages of deliveries to various customer categories Dieter et al., 2018. Public-supply deliveries for domestic use are not available for 1950, 1955, and 2000. Values for 1960-1980 include distribution system losses.
In 2020, USGS used a series of machine-learning models to estimate public supply water use (Alzraiee et al., 2024; Larsen et al., 2025b). These machine-learning models combine reported historical information with an array of different hydroclimatic, demographic, socioeconomic, geographic, and land-use factors to compute public supply withdrawals across the lower 48 United States. These models compute the amount of water withdrawn for public supply each month over the period from 2000 to 2020 for public water service areas, delivery of public water to commercial, industrial, and institutional users by water service area or subwatersheds (12-digit Hydrologic Unit Codes or HUC12s) in the lower 48 United States.
These updated models include water service area boundaries (Buchwald et al, 2022) that provide insight into the sourcing, distribution, land use, and demographic aspects of public drinking water supplies. Within each of these public water-service areas, the USGS estimates the fraction of water supplied from groundwater and surface water sources and public supplied water use by commercial and industrial users (Luukonen et al., 2023).
Continued development is underway to produce estimates of public supply water use and consumptive use monthly through 2025.
Water Use in the United States
Accessing Water Use Data
Thermoelectric Power Water Use
Irrigation Water Use
Domestic self-supply water use
industrial water use
Mining water use
Livestock water use
Aquaculture water use

Water Use in the United States

Livestock Water Use
Public supply refers to water withdrawn by public and private water suppliers that provide water to at least 25 people or have a minimum of 15 connections to users. Public supply water is delivered for domestic (residential), commercial, and industrial purposes.
Public water-supply systems are government or privately run facilities that withdraw water from rivers, lakes, reservoirs, and wells and then deliver it to homes, businesses, and schools. These systems are important to all populations. About 83% of people living in the United States got their water through public water-supply systems in 2020 (Larsen et al. 2025). People living in rural areas or outside of public water-supply areas rely on private well systems. Industry and people located in more densely populated areas depend upon public-supply systems, emphasizing the need for quality data collection for public water-supply systems in the United States.
2020 Water Use
In 2020, about 35,823 million gallons per day (mgd) of water was withdrawn for public supply across the lower 48 United States.
- Withdrawals from surface water totaled 18,586 mgd (about 52%) and from groundwater 17,236 mgd (about 48%).
- Consumptive use accounted for about 12% of the water withdrawn (4,241 mgd), meaning the water withdrawn did not return to local waterbodies or groundwater.
- The Northeast hydrologic region withdrew the most at about 19.9% (7,142 mgd), followed by California-Nevada at about 15% (5,390 mgd). The Northern High Plains region used the least, with about 0.4% (139 mgd).
- Nationally, public supply withdrawals are highest in July at 43,697 mgd, followed by August at 42,975 mgd. January has the lowest at 29,971 mgd.
2020 public supply water use estimates are from Luukkonen et al., 2023 accessed through the National Water Availability Assessment Data Companion, using the hydrologic region boundaries published here.
Public Supply Water Use 1985-2020
From 1985 to 2015, public supply withdrawals peaked in 2005 at about 43,696 mgd and were about 38,408 mgd in 2015 (+6% from 1985).
- In 2020, withdrawals were about 35,823 Mgal/d. 2020 values are modeled estimates, so the change from 2015 partly reflects different methods.
- Groundwater supplied about 40% of withdrawals in 1985, 39% in 2015, and 48% in 2020.
Estimating Public Supply Water Use
For estimates before 2020, methods for estimating public-supply withdrawals, source of water, population served, and domestic deliveries varied by state. Common sources of information about withdrawals by source included data collected from water suppliers by state water regulatory agencies. Estimates of the population served by public supply were derived using various sources, including reports from state agencies, the EPA SDWIS database, U.S. Census data, and information on service connections from public suppliers. Methods for estimating domestic deliveries included public water supply sales information, calculations using coefficients for per capita use, and development of average percentages of deliveries to various customer categories Dieter et al., 2018. Public-supply deliveries for domestic use are not available for 1950, 1955, and 2000. Values for 1960-1980 include distribution system losses.
In 2020, USGS used a series of machine-learning models to estimate public supply water use (Alzraiee et al., 2024; Larsen et al., 2025b). These machine-learning models combine reported historical information with an array of different hydroclimatic, demographic, socioeconomic, geographic, and land-use factors to compute public supply withdrawals across the lower 48 United States. These models compute the amount of water withdrawn for public supply each month over the period from 2000 to 2020 for public water service areas, delivery of public water to commercial, industrial, and institutional users by water service area or subwatersheds (12-digit Hydrologic Unit Codes or HUC12s) in the lower 48 United States.
These updated models include water service area boundaries (Buchwald et al, 2022) that provide insight into the sourcing, distribution, land use, and demographic aspects of public drinking water supplies. Within each of these public water-service areas, the USGS estimates the fraction of water supplied from groundwater and surface water sources and public supplied water use by commercial and industrial users (Luukonen et al., 2023).
Continued development is underway to produce estimates of public supply water use and consumptive use monthly through 2025.
Water Use in the United States
Accessing Water Use Data
Thermoelectric Power Water Use
Irrigation Water Use
Domestic self-supply water use
industrial water use
Mining water use
Livestock water use
Aquaculture water use
Water Use in the United States