
Irrigation water use includes water that is applied by an irrigation system to sustain plant growth in agricultural and horticultural practices. Irrigation also includes water that is used for pre-irrigation, frost protection, chemical application, weed control, field preparation, crop cooling, harvesting, dust suppression, and leaching salts from the root zone. Estimates of irrigation withdrawals are generally accounted for at the point of diversion (wells, springs, streams, ponds) and include water that is lost in conveyance prior to application on fields, as well as water that may subsequently return to a surface-water body as runoff after application, water consumed as evapotranspiration (ET) from plants and evaporated from the ground, or water that recharges aquifers as it seeps past the root zone.
••• WATER USE HOME • TOTAL WATER USE • SURFACE WATER USE • GROUNDWATER USE • TRENDS •••
Public Supply • Domestic • Irrigation • Thermoelectric Power • Industrial • Mining • Livestock • Aquaculture
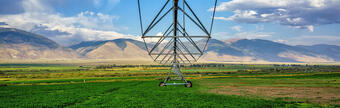
Irrigation of golf courses, parks, nurseries, turf farms, cemeteries, and other self-supplied landscape-watering uses also are included in USGS irrigation estimates. Irrigation water use includes self-supplied withdrawals and deliveries from irrigation companies or districts, cooperatives, or governmental entities. All irrigation withdrawals are considered freshwater. Some water used for irrigation is reclaimed wastewater from nearby treatment facilities or industries. Nationwide estimates of consumptive use of water withdrawn for irrigation were estimated for 2015 for the first time since 1995. Irrigated acres are reported by three types of irrigation methods: sprinkler, microirrigation, and surface (flood) systems.
2015 Water Use
(source: Dieter, C.A., Maupin, M.A., Caldwell, R.R., Harris, M.A., Ivahnenko, T.I., Lovelace, J.K., Barber, N.L., and Linsey, K.S., 2018, Estimated use of water in the United States in 2015: U.S. Geological Survey Circular 1441, 65 p., https://doi.org/10.3133/cir1441.)
For 2015, total irrigation withdrawals were 118,000 Mgal/d, which accounted for 42 percent of total freshwater withdrawals. Withdrawals from surface-water sources were 60,900 Mgal/d, which accounted for 52 percent of the total irrigation withdrawals. Groundwater withdrawals for 2015 were 57,200 Mgal/d.
About 63,500 thousand acres were irrigated in 2015, 34,700 thousand acres (55 percent) with sprinkler systems, 23,300 thousand acres with surface (flood), and 5,490 thousand acres with microirrigation systems. The national average application rate for 2015 was 2.09 acre-feet per acre.

| State | Percentage of total withdrawals | Cumulative percentage of total withdrawals |
|---|---|---|
| California | 16% | 16% |
| Idaho | 13% | 29% |
| Arkansas | 10% | 39% |
| Montana | 8% | 47% |
| Colorado | 8% | 54% |
The majority of total U.S. irrigation withdrawals (81 percent) and irrigated acres (74 percent) were in the 17 conterminous Western States (west of solid line in map above). Surface water was the primary source of water in the arid West, except in California, Nebraska, Texas, Kansas, South Dakota, and Oklahoma, where more groundwater was used.

Both irrigation withdrawals and total irrigated acres increased about 2 percent between 2010 and 2015. Irrigation withdrawals for 2015 are 21 percent less than 1980, when withdrawals peaked at 150,000 Mgal/d. The use of more water-efficient irrigation systems continued to increase with 10 percent more irrigated acres using sprinkler systems in 2015 than in 2010. About 19 percent more irrigated acres were reported using microirrigation systems between 2010 and 2015.
Data sources
Sources of data for irrigation withdrawals and irrigated acres included State and Federal crop reporting programs, irrigation districts, canal companies, incorporated management areas, satellite data depicting cropland landscapes, and evapotranspiration estimates. Withdrawals were estimated using information on irrigated crop acreages by crop type and specific crop water-consumption coefficients, or irrigation-system application rates, as well as soil-moisture balance models. Estimation methods varied from one State to the next and sometimes between geographic areas within a State. Estimation methods ideally included adjustments for climate, system efficiencies, conveyance losses, and other irrigation practices, such as pre-growing season irrigation, salt leaching, or frost protection. Other methods for estimating irrigation withdrawals included extrapolation of sample data on crop water-application rates or power-consumption coefficients.
Category history
- 1950 and later: Irrigation
- 2000 and later: Some States have estimates for subcategories of Crop Irrigation and Golf Course Irrigation
Graphic of category changes over time

Want to know more about irrigation water use? Follow me to the Irrigation Water Use website!
Below are links for other categories of water use.

Water Use in the United States

Public Supply Water Use

Domestic Water Use

Thermoelectric Power Water Use

Industrial Water Use

Mining Water Use

Livestock Water Use

Aquaculture Water Use
Irrigation water use includes water that is applied by an irrigation system to sustain plant growth in agricultural and horticultural practices. Irrigation also includes water that is used for pre-irrigation, frost protection, chemical application, weed control, field preparation, crop cooling, harvesting, dust suppression, and leaching salts from the root zone. Estimates of irrigation withdrawals are generally accounted for at the point of diversion (wells, springs, streams, ponds) and include water that is lost in conveyance prior to application on fields, as well as water that may subsequently return to a surface-water body as runoff after application, water consumed as evapotranspiration (ET) from plants and evaporated from the ground, or water that recharges aquifers as it seeps past the root zone.
••• WATER USE HOME • TOTAL WATER USE • SURFACE WATER USE • GROUNDWATER USE • TRENDS •••
Public Supply • Domestic • Irrigation • Thermoelectric Power • Industrial • Mining • Livestock • Aquaculture
Irrigation of golf courses, parks, nurseries, turf farms, cemeteries, and other self-supplied landscape-watering uses also are included in USGS irrigation estimates. Irrigation water use includes self-supplied withdrawals and deliveries from irrigation companies or districts, cooperatives, or governmental entities. All irrigation withdrawals are considered freshwater. Some water used for irrigation is reclaimed wastewater from nearby treatment facilities or industries. Nationwide estimates of consumptive use of water withdrawn for irrigation were estimated for 2015 for the first time since 1995. Irrigated acres are reported by three types of irrigation methods: sprinkler, microirrigation, and surface (flood) systems.
2015 Water Use
(source: Dieter, C.A., Maupin, M.A., Caldwell, R.R., Harris, M.A., Ivahnenko, T.I., Lovelace, J.K., Barber, N.L., and Linsey, K.S., 2018, Estimated use of water in the United States in 2015: U.S. Geological Survey Circular 1441, 65 p., https://doi.org/10.3133/cir1441.)
For 2015, total irrigation withdrawals were 118,000 Mgal/d, which accounted for 42 percent of total freshwater withdrawals. Withdrawals from surface-water sources were 60,900 Mgal/d, which accounted for 52 percent of the total irrigation withdrawals. Groundwater withdrawals for 2015 were 57,200 Mgal/d.
About 63,500 thousand acres were irrigated in 2015, 34,700 thousand acres (55 percent) with sprinkler systems, 23,300 thousand acres with surface (flood), and 5,490 thousand acres with microirrigation systems. The national average application rate for 2015 was 2.09 acre-feet per acre.
| State | Percentage of total withdrawals | Cumulative percentage of total withdrawals |
|---|---|---|
| California | 16% | 16% |
| Idaho | 13% | 29% |
| Arkansas | 10% | 39% |
| Montana | 8% | 47% |
| Colorado | 8% | 54% |
The majority of total U.S. irrigation withdrawals (81 percent) and irrigated acres (74 percent) were in the 17 conterminous Western States (west of solid line in map above). Surface water was the primary source of water in the arid West, except in California, Nebraska, Texas, Kansas, South Dakota, and Oklahoma, where more groundwater was used.
Both irrigation withdrawals and total irrigated acres increased about 2 percent between 2010 and 2015. Irrigation withdrawals for 2015 are 21 percent less than 1980, when withdrawals peaked at 150,000 Mgal/d. The use of more water-efficient irrigation systems continued to increase with 10 percent more irrigated acres using sprinkler systems in 2015 than in 2010. About 19 percent more irrigated acres were reported using microirrigation systems between 2010 and 2015.
Data sources
Sources of data for irrigation withdrawals and irrigated acres included State and Federal crop reporting programs, irrigation districts, canal companies, incorporated management areas, satellite data depicting cropland landscapes, and evapotranspiration estimates. Withdrawals were estimated using information on irrigated crop acreages by crop type and specific crop water-consumption coefficients, or irrigation-system application rates, as well as soil-moisture balance models. Estimation methods varied from one State to the next and sometimes between geographic areas within a State. Estimation methods ideally included adjustments for climate, system efficiencies, conveyance losses, and other irrigation practices, such as pre-growing season irrigation, salt leaching, or frost protection. Other methods for estimating irrigation withdrawals included extrapolation of sample data on crop water-application rates or power-consumption coefficients.
Category history
- 1950 and later: Irrigation
- 2000 and later: Some States have estimates for subcategories of Crop Irrigation and Golf Course Irrigation
Graphic of category changes over time
Want to know more about irrigation water use? Follow me to the Irrigation Water Use website!
Below are links for other categories of water use.
Water Use in the United States
Public Supply Water Use
Domestic Water Use
Thermoelectric Power Water Use
Industrial Water Use
Mining Water Use
Livestock Water Use