
Total withdrawals for all categories of use in 2015 were estimated to be 322 billion gallons per day (Bgal/d), a level of withdrawal not reported since before 1970. Total withdrawals in 2015 were 9 percent less than in 2010, continuing a sharp but steady downward trend since 2005. Freshwater withdrawals were also 9 percent less than in 2015.
••• WATER USE HOME • TOTAL WATER USE • SURFACE WATER USE • GROUNDWATER USE • TRENDS •••
Public Supply • Domestic • Irrigation • Thermoelectric Power • Industrial • Mining • Livestock • Aquaculture
Water Use Trends, 1950-2015
(source: Dieter, C.A., Maupin, M.A., Caldwell, R.R., Harris, M.A., Ivahnenko, T.I., Lovelace, J.K., Barber, N.L., and Linsey, K.S., 2018, Estimated use of water in the United States in 2015: U.S. Geological Survey Circular 1441, 65 p., https://doi.org/10.3133/cir1441.)
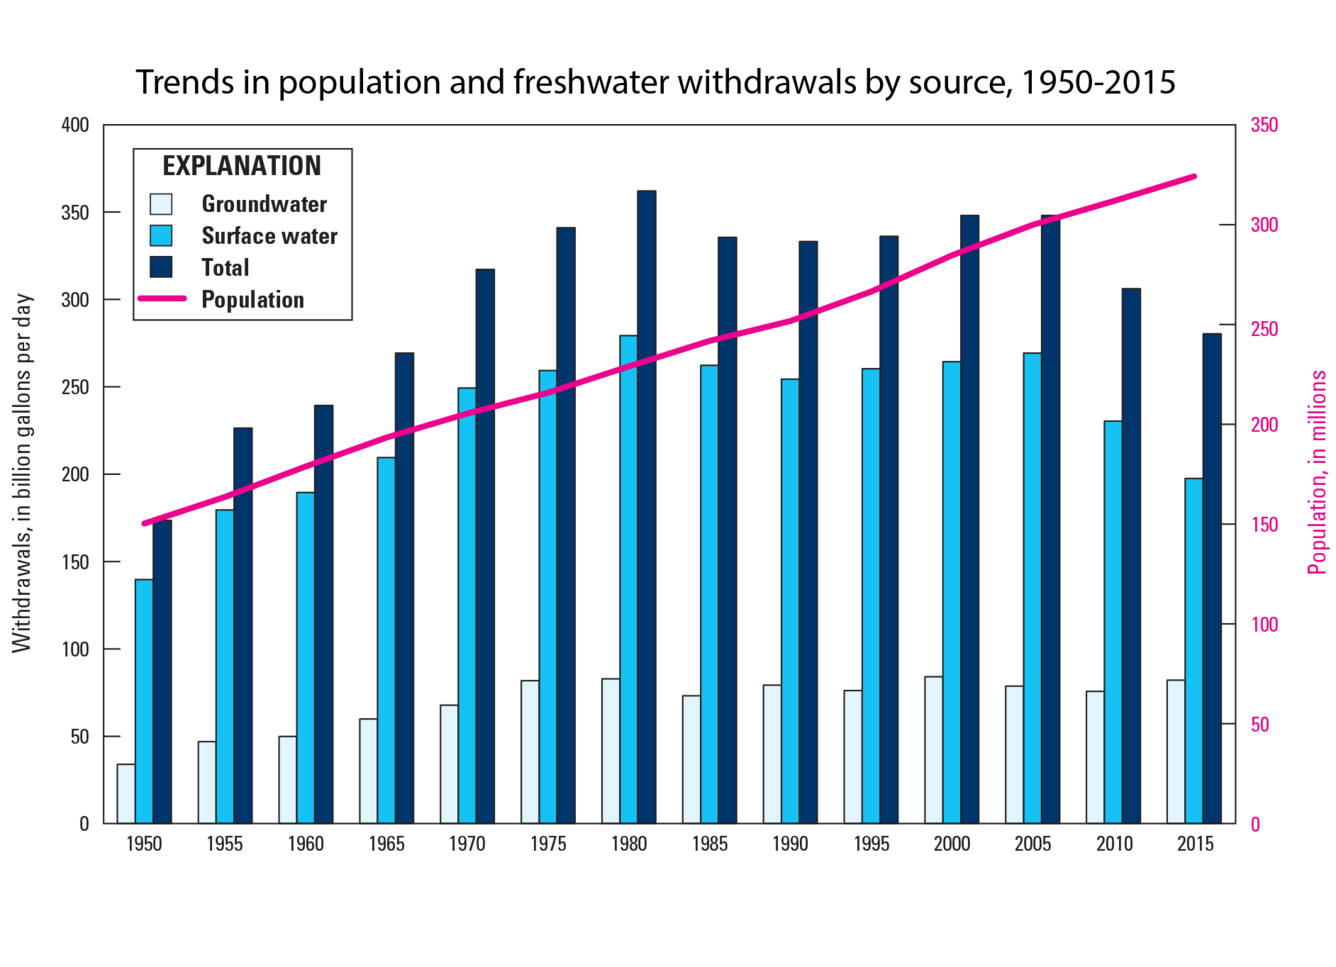
The drop in total withdrawals in 2015 was primarily caused by signicant decreases in withdrawals for thermoelectric power (28.8 Bgal/d), which accounted for 89 percent of the decrease in total withdrawals. The decrease in public-supply withdrawals accounted for another 9 percent of the decline in total withdrawals. Categories of use with larger withdrawals in 2015 than in 2010 were irrigation and mining. The increase in irrigation withdrawals was only about 2 percent greater than 2010 levels, partly resulting from updated 2010 data, and mining withdrawals were corrected downward for 2010.

Below are other water-use topics.

Water Use in the United States

Total Water Use

Surface-Water Use

Groundwater Use

Water-Use Terminology
Total withdrawals for all categories of use in 2015 were estimated to be 322 billion gallons per day (Bgal/d), a level of withdrawal not reported since before 1970. Total withdrawals in 2015 were 9 percent less than in 2010, continuing a sharp but steady downward trend since 2005. Freshwater withdrawals were also 9 percent less than in 2015.
••• WATER USE HOME • TOTAL WATER USE • SURFACE WATER USE • GROUNDWATER USE • TRENDS •••
Public Supply • Domestic • Irrigation • Thermoelectric Power • Industrial • Mining • Livestock • Aquaculture
Water Use Trends, 1950-2015
(source: Dieter, C.A., Maupin, M.A., Caldwell, R.R., Harris, M.A., Ivahnenko, T.I., Lovelace, J.K., Barber, N.L., and Linsey, K.S., 2018, Estimated use of water in the United States in 2015: U.S. Geological Survey Circular 1441, 65 p., https://doi.org/10.3133/cir1441.)
The drop in total withdrawals in 2015 was primarily caused by signicant decreases in withdrawals for thermoelectric power (28.8 Bgal/d), which accounted for 89 percent of the decrease in total withdrawals. The decrease in public-supply withdrawals accounted for another 9 percent of the decline in total withdrawals. Categories of use with larger withdrawals in 2015 than in 2010 were irrigation and mining. The increase in irrigation withdrawals was only about 2 percent greater than 2010 levels, partly resulting from updated 2010 data, and mining withdrawals were corrected downward for 2010.
Below are other water-use topics.
Water Use in the United States
Total Water Use
Surface-Water Use
Groundwater Use