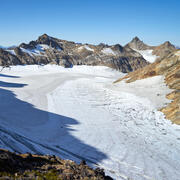
Glacier change in the western U.S. and Alaska: New insights from reanalysis of old data
This article is part of the Spring 2020 issue of the Earth Science Matters Newsletter.
Glaciers are dynamic reservoirs of frozen water that affect society on local to global scales, with impacts ranging from global sea level to regional freshwater supply, hazards, and effects on downstream ecosystems. Field records of glacier mass change reflect seasonal and interannual variability that is otherwise difficult to capture, yet only 39 glaciers on Earth have continuous, long-term (30+ years) field records of this change, known as mass balance. This limit in directly observed glacier data makes it challenging to validate physical models that are used to project sea level and manage water resources.
Mass balance field data consist of measurements of snow accumulation and snow and ice melt. Winter snow accumulation is measured in snow pits and snow cores, while summer melt is measured via repeat visits to ablation stakes. These direct, field measurements are made seasonally at a series of fixed locations on each glacier.
The USGS measures glacier mass balance and records climate data at five North American glaciers in order to enhance understanding of the physical processes that link glaciers to climate, ecosystems, and hydrologic processes. These five glaciers are collectively known as the USGS Benchmark Glaciers; measurements began at Lemon Creek Glacier (AK) in 1953, South Cascade Glacier (WA) in 1958, Gulkana and Wolverine glaciers (AK) in 1966, and Sperry Glacier (MT) in 2005. These glaciers span continental and maritime climate regimes that contain glaciers across the western United States and Alaska, as shown in Figure 1. The benchmark glaciers in Washington and Alaska have the longest continuous, mass balance records in the United States, and their records are among the longest in the world. They make up four out of six U.S. ‘reference’ glaciers in the World Glacier Monitoring Service’s internationally coordinated glacier monitoring network, with data used regularly in authoritative international climate assessment reports.
Historically, comparison of these 50+ year records was problematic, as the methods for data collection and analysis were different at each of the five benchmark glaciers. Recent USGS efforts integrated the Benchmark Glacier Project into a cohesive effort with standardized data collection, analytical methods and fully reanalyzed, intercomparable estimates of annual and seasonal glacier mass change. This reanalysis process consisted of three steps. First, we used local weather station data to standardize our observed changes at each sample site into a common chronology at each glacier. Second, we integrated the observed mass changes over the glacier surface. Third, we used volume changes calculated from a series of digital elevation models, known as geodetic mass balance, to assess and remove biases in our integrated direct measurements. Finally, we repeated the second and third steps with a suite of plausible variations on the basic methods to understand uncertainties in the results. Our approach encompasses errors related to extrapolation of point measurements that formal error propagation cannot resolve. This empowers scientists and stakeholders with practical error bounds, so that USGS Benchmark Glacier records can be applied to real world water management, decision making, and scientific problems.
The results of our reanalysis show persistent cumulative mass losses in conjunction with decreasing glacier areas (Figure 2). This is consistent with other studies documenting the overall decreasing volume of land ice on Earth. Comparing results among USGS Benchmark Glaciers shows that distance from the coast has a stronger effect on glacier mass loss than latitude. Our results also challenge the paradigm that mass balance is primarily controlled by elevation, rather showing widespread influence from wind drifting of snow, shading and surface fracturing at all glaciers.
Regardless of glacier latitude, elevation, or proximity to the coast, the results of our reanalysis show that glacier mass loss across the five benchmark glaciers is driven by increasing summer temperatures. Currently, we are leveraging the reanalysis results and framework to understand the benchmark glaciers in a broader context. Comparison of Lemon Creek Glacier (AK) with neighboring Taku Glacier (AK) allowed us to examine the opposing responses of the two glaciers to the same climate, highlighting the importance of valley geometry and elevation distribution in the glacier-climate relationship. Additionally, we were able to identify the initiation of Taku Glacier’s retreat after over 130 years of glacier growth.
The paper “Reanalysis of the US Geological Survey Benchmark Glaciers: long-term insight into climate forcing of glacier mass balance” is published in Journal of Glaciology: doi.org/10.1017/jog.2019.66.
New work leveraging this reanalysis “Explaining mass-balance and retreat dichotomies at Taku and Lemon Creek Glaciers, Alaska” is published in Journal of Glaciology: doi.org/10.1017/jog.2020.22.
All USGS Benchmark Glacier Project data are publicly available in USGS data releases: doi.org/10.5066/P9AGXQSR.
<< Back to Spring 2020 Newsletter
Get Our News
These items are in the RSS feed format (Really Simple Syndication) based on categories such as topics, locations, and more. You can install and RSS reader browser extension, software, or use a third-party service to receive immediate news updates depending on the feed that you have added. If you click the feed links below, they may look strange because they are simply XML code. An RSS reader can easily read this code and push out a notification to you when something new is posted to our site.


