Western California volcanoes geonarrative map screenshot
Western California volcanoes geonarrative map screenshotWestern California volcanoes geonarrative map screenshot from Western California Volcano Research Maps


Official websites use .gov
A .gov website belongs to an official government organization in the United States.

Secure .gov websites use HTTPS
A lock () or https:// means you’ve safely connected to the .gov website. Share sensitive information only on official, secure websites.

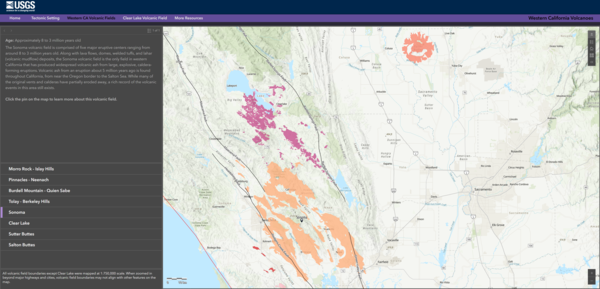
Western California volcanoes geonarrative map screenshot from Western California Volcano Research Maps
Western California volcanoes geonarrative map screenshot from Western California Volcano Research Maps
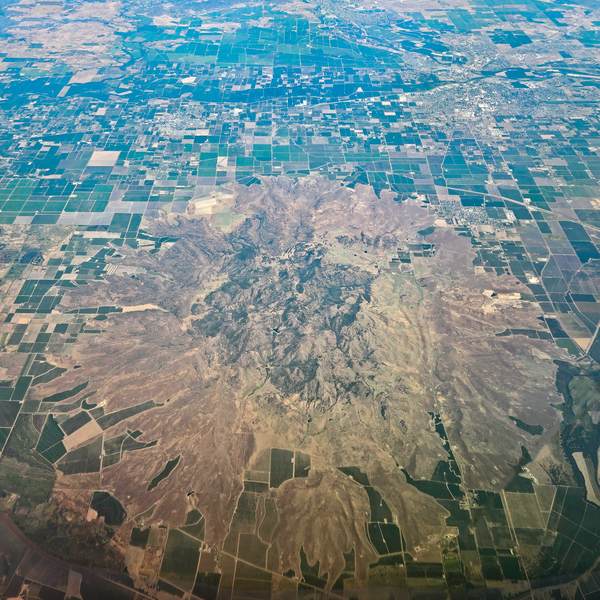
This aerial photo, taken from about 40,000 feet and looking east, highlights the rugged central lava domes and smooth circular debris apron of the Sutter Buttes. USGS photo by J. Ball.
This aerial photo, taken from about 40,000 feet and looking east, highlights the rugged central lava domes and smooth circular debris apron of the Sutter Buttes. USGS photo by J. Ball.
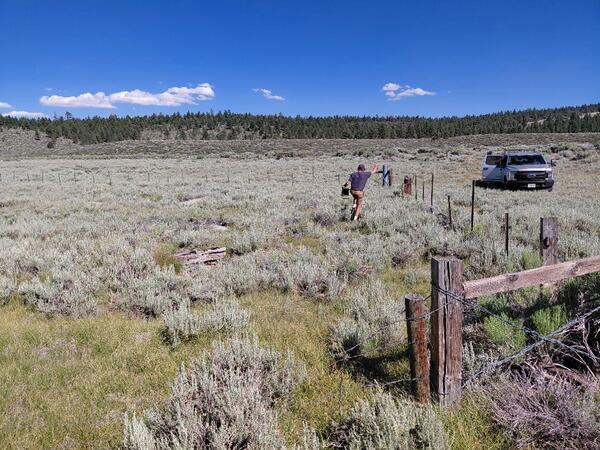
A USGS scientist pulls a conductivity sensor out of a water well. These wells are usually drilled for other purposes (like livestock or agriculture) but are useful for scientists doing geodetic surveys. USGS photo by J. Crozier.
A USGS scientist pulls a conductivity sensor out of a water well. These wells are usually drilled for other purposes (like livestock or agriculture) but are useful for scientists doing geodetic surveys. USGS photo by J. Crozier.
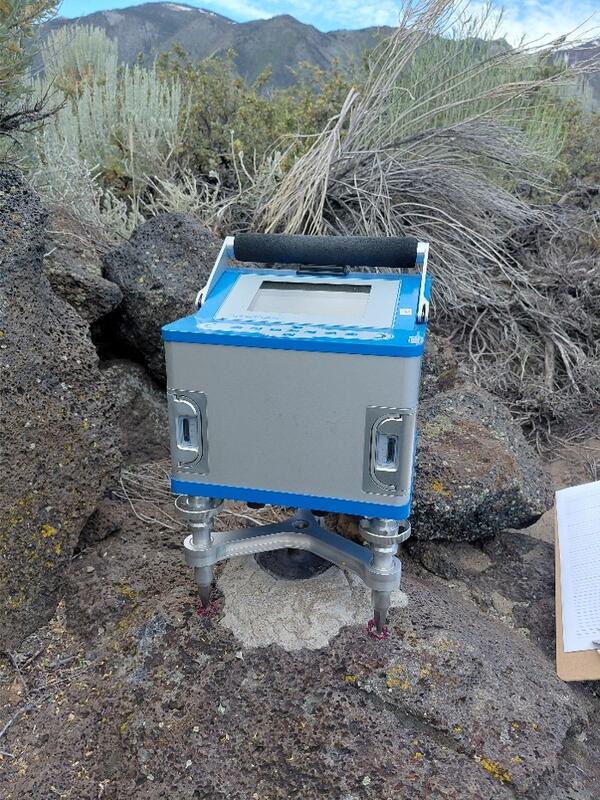
Gravimeters, or "gravity meters", measure the strength of the Earth's gravitational field at any given point. This value may be affected by ground elevation, the density of the rock or material on which the gravimeter sits, and the presence of magma or fluids beneath the Earth's surface. USGS photo by J. Crozier.
Gravimeters, or "gravity meters", measure the strength of the Earth's gravitational field at any given point. This value may be affected by ground elevation, the density of the rock or material on which the gravimeter sits, and the presence of magma or fluids beneath the Earth's surface. USGS photo by J. Crozier.
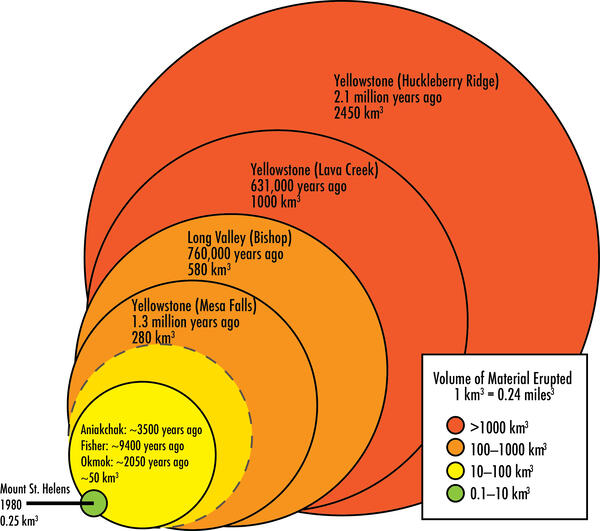
Comparison of caldera-forming eruption sizes (by volume of erupted magma) in the U.S., modified from an AVO/USGS figure. Also included for reference is the 1980 eruption of Mount St. Helens. The three caldera-forming eruptions in Alaska are more than 200 times the size of the 1980 eruption of Mount St.
Comparison of caldera-forming eruption sizes (by volume of erupted magma) in the U.S., modified from an AVO/USGS figure. Also included for reference is the 1980 eruption of Mount St. Helens. The three caldera-forming eruptions in Alaska are more than 200 times the size of the 1980 eruption of Mount St.
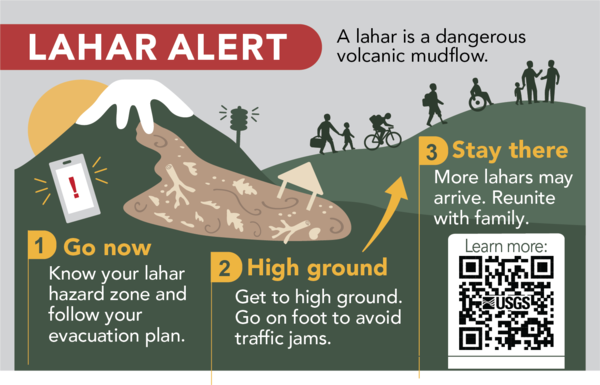
A lahar is a volcanic mudflow. Learn if you are if you are in a lahar hazard zone and how to evacuate to high ground. If you are in a lahar hazard zone and get a lahar alert - go now! Every second matters.
A lahar is a volcanic mudflow. Learn if you are if you are in a lahar hazard zone and how to evacuate to high ground. If you are in a lahar hazard zone and get a lahar alert - go now! Every second matters.