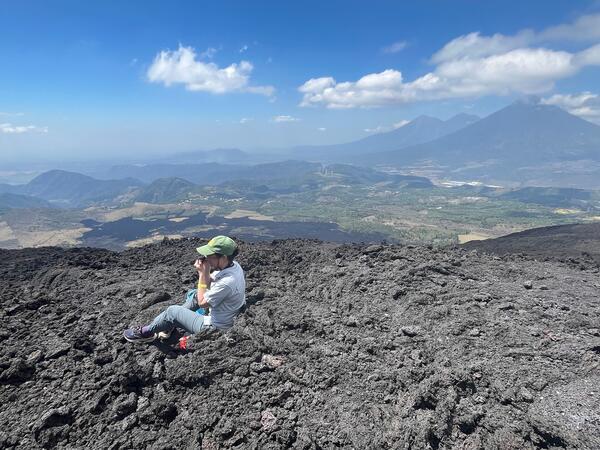
Scientists setting up temporary seismic station on Mount Adams.
Scientists setting up temporary seismic station on Mount Adams.Scientist with the USGS Cascades Volcano Observatory installs a temporary seismic station at Mount Adams.
An official website of the United States government
Here's how you know
Official websites use .gov
A .gov website belongs to an official government organization in the United States.
Secure .gov websites use HTTPS
A lock () or https:// means you’ve safely connected to the .gov website. Share sensitive information only on official, secure websites.
Images related to Cascades Volcano Observatory.
Scientist with the USGS Cascades Volcano Observatory installs a temporary seismic station at Mount Adams.
During September 2024, the U.S. Geological Survey Cascades Volcano Observatory (CVO) and Pacific Northwest Seismic Network (PNSN) located six earthquakes at Mount Adams. For comparison, earthquakes at this volcano are typically located at a rate of about 1 every 2-3 years.
Maps of the currents and proposed seismic network station locations at Mount Adams. To improve seismic monitoring capabilities, CVO has permission from the U.S. Forest Service to install temporary seismic stations south and southwest of Mount Adams.
The earthquakes were detected on seismic station ASR2, a PNSN-operated station located about 7.5 miles (12 km) from the summit of Mount Adams, along with other stations much farther away from the volcano.
Earthquakes located at Mount St. Helens from 2008-2024, a non-eruptive period. This activity is consistent with normal, background levels. Top: Earthquake events located per week. The orange color at the far right denotes earthquakes from February to June 2024. Bottom: Earthquake depths below sea level (bsl) in kilometers.
Comparison of February-June 2024 seismicity to previous seismic swarms (1987-2004). Upper left: Map of Mount St. Helens with a grayscale representing a digital elevation model. Earthquakes interpreted as recharge between 1987 and 2004 are plotted as a heatmap of earthquake density.
From February 1 to June 17, 2024, approximately 350 earthquakes were located at Mount St. Helens by the Pacific Northwest Seismic Network. Over 95% of the earthquakes were less than a magnitude 1.0 and too small to be felt at the surface. The number of earthquakes located per week appears to have reached a peak in early June, at 38 events per week. USGS graphic.
USGS scientist Peter Kelly is recognized for his work to design, optimize, and commercialize Multi-GAS technology for monitoring of geothermal and volcanic gas emanations. Notably, he spent almost a decade designing, engineering, and perfecting a system of geochemical sensors for both portable and semi-permanent remote deployment.
Aerial photo of Mount St. Helens (center), with Mount Hood (in the distance, far left), Spirit Lake (on left with floating log mat), and St. Helens Lake with a little ice cover (lower left). USGS image taken by K. Spicer on June 6, 2024.
Mount St. Helens: Land of Transformation video shows the changes to the landscape from before the May 18, 1980 eruption to today (2024).
During the March 21, 2024 lahar evacuation drills, thousands of students walked to the Washington State Fairgrounds in Puyallup, Washington to practice evacuating from a lahar generated by Mount Rainier. A lahar, or volcanic mudflow, could reach this area in about 3 hours.
Research Scientist Emily Johnson looks at plagioclase crystals with a hand lens at Pacaya volcano in Guatemala.
Mount Hood, Oregon, earthquakes from a swarm that occurred December 8-13, 2023 as compared to previous earthquakes. The recent earthquakes are shown with red circles. Earthquakes that have occurred since 2010 are shown as unfilled gray circles. All circles are sized by their magnitude. Top: Map view of seismicity at Mount Hood.
USGS Cascades Volcano Observatory field crew conducts maintenance at station LSON at Mount Hood (in the distance). LSON was one of three new stations installed at Mount Hood in 2020, to create a more robust monitoring network at this volcano. Photo taken September 14, 2021 by B. Pauk.
Mount St. Helens by A. Mosbrucker. Looking SE towards the volcano up the valley.
Monitoring station VALT, in the crater of Mount St. Helens, in 2023. Anxious about damage to the station from the advancing Crater Glacier (the rock and snow-covered cliff) and hazards to people working at the site, a CVO field team dismantled VALT on June 6, 2024 after 18 years in service. It will be rebuilt farther from the glacier.
New benchmark AX-403 was deployed at the base of the western caldera wall of the Axial Seamount volcano. This photo was taken during the ROV Jason dive J2-1432 of the Axial Seamount Cruise, June 19 to July 2, 2022 from the R/V Thompson.
Mount Rainier (Washington) volcano hazard zones and estimated lahar (volcanic mudflow) arrival times for the Puyallup and Nisqually River valleys.
Close-up oblique views of Mount Rainier’s west side showing simulated lahar flow depths from a landslide originating in the area of the Tahoma Glacier Headwall (T-260-HM simulation). Imagery appears blurry where lahar material is absent because D-Claw’s adaptive mesh refinement (AMR) employs very coarse resolution in those areas.
Comparison of vertical GPS motion measured at station HUSB (top) with earthquake depth (bottom). Red line is a 60-day average of the cleaned GPS time series plotted in gray. Earthquakes are plotted with respect to their magnitudes. The swarm in 2004 represents the vast majority of earthquake in the vicinity of the deforming region.
Time series showing daily vertical GPS positions from the continuous GPS station HUSB between 2001 and 2022.