



Earthquake Lake, which formed when the Madison River was blocked by a landslide that occurred as a consequence of the Hebgen Lake earthquake in 1959. The lake inundated existing forest, now marked by standing dead trees in the lake water. The landslide scar is visible on the side of the mountain at the far end of the lake.
Images
Images related to Yellowstone Volcano Observatory.
Filter Total Items: 797

Earthquake Lake and the Madison slide
Earthquake Lake, which formed when the Madison River was blocked by a landslide that occurred as a consequence of the Hebgen Lake earthquake in 1959. The lake inundated existing forest, now marked by standing dead trees in the lake water. The landslide scar is visible on the side of the mountain at the far end of the lake.

Map of Geyser Hill, Upper Geyser Basin, Yellowstone National Park, with selected thermal features
Map of Geyser Hill, Upper Geyser Basin, Yellowstone National Park, with selected thermal featuresMap of Geyser Hill, Upper Geyser Basin, Yellowstone National Park, showing selected thermal features, including new and reactivated features that were active during the May-June 2023 thermal unrest. Map prepared by by Kiernan Folz-Donahue, Yellowstone National Park.
Map of Geyser Hill, Upper Geyser Basin, Yellowstone National Park, with selected thermal features
Map of Geyser Hill, Upper Geyser Basin, Yellowstone National Park, with selected thermal featuresMap of Geyser Hill, Upper Geyser Basin, Yellowstone National Park, showing selected thermal features, including new and reactivated features that were active during the May-June 2023 thermal unrest. Map prepared by by Kiernan Folz-Donahue, Yellowstone National Park.

Map of ground deformation monitoring network in the Yellowstone region
Map of ground deformation monitoring network in the Yellowstone regionMap of continuous Global Positioning System (GPS), semipermanent GPS, borehole strainmeters, and borehole tiltmeters that provide surface deformation monitoring capability in and around Yellowstone National Park. Red line denotes boundary of Yellowstone Caldera.
Map of ground deformation monitoring network in the Yellowstone region
Map of ground deformation monitoring network in the Yellowstone regionMap of continuous Global Positioning System (GPS), semipermanent GPS, borehole strainmeters, and borehole tiltmeters that provide surface deformation monitoring capability in and around Yellowstone National Park. Red line denotes boundary of Yellowstone Caldera.

Hydrothermal explosion crater that has existed since at least 1954 located just southwest of The Gap in Norris Geyser Basin, Yellowstone National Park
Hydrothermal explosion crater that has existed since at least 1954 located just southwest of The Gap in Norris Geyser Basin, Yellowstone National ParkHydrothermal explosion crater that has existed since at least 1954 located just southwest of The Gap in Norris Geyser Basin, Yellowstone National Park. Photo taken in June 2023 by Lauren Harrison.
Hydrothermal explosion crater that has existed since at least 1954 located just southwest of The Gap in Norris Geyser Basin, Yellowstone National Park
Hydrothermal explosion crater that has existed since at least 1954 located just southwest of The Gap in Norris Geyser Basin, Yellowstone National ParkHydrothermal explosion crater that has existed since at least 1954 located just southwest of The Gap in Norris Geyser Basin, Yellowstone National Park
Hydrothermal explosion crater that has existed since at least 1954 located just southwest of The Gap in Norris Geyser Basin, Yellowstone National ParkHydrothermal explosion crater that has existed since at least 1954 located just southwest of The Gap in Norris Geyser Basin, Yellowstone National Park. Photo taken in June 2023 by Lauren Harrison.

Garter snake along Violet Creek near the Mary Mountain Trail in Hayden Valley, Yellowstone National Park
Garter snake along Violet Creek near the Mary Mountain Trail in Hayden Valley, Yellowstone National ParkA garter snake along Violet Creek near the Mary Mountain Trail in Hayden Valley, Yellowstone National Park. This snake used the geothermally warmed creek to thermoregulate during near-freezing overnight conditions. USGS photo by Stanley Mordensky, June 2023.
Garter snake along Violet Creek near the Mary Mountain Trail in Hayden Valley, Yellowstone National Park
Garter snake along Violet Creek near the Mary Mountain Trail in Hayden Valley, Yellowstone National ParkA garter snake along Violet Creek near the Mary Mountain Trail in Hayden Valley, Yellowstone National Park. This snake used the geothermally warmed creek to thermoregulate during near-freezing overnight conditions. USGS photo by Stanley Mordensky, June 2023.
Garter snake along Violet Creek near the Mary Mountain Trail in Hayden Valley, Yellowstone National Park
Garter snake along Violet Creek near the Mary Mountain Trail in Hayden Valley, Yellowstone National ParkA garter snake along Violet Creek near the Mary Mountain Trail in Hayden Valley, Yellowstone National Park. This snake used the geothermally warmed creek to thermoregulate during near-freezing overnight conditions. USGS photo by Stanley Mordensky, June 2023.
Garter snake along Violet Creek near the Mary Mountain Trail in Hayden Valley, Yellowstone National Park
Garter snake along Violet Creek near the Mary Mountain Trail in Hayden Valley, Yellowstone National ParkA garter snake along Violet Creek near the Mary Mountain Trail in Hayden Valley, Yellowstone National Park. This snake used the geothermally warmed creek to thermoregulate during near-freezing overnight conditions. USGS photo by Stanley Mordensky, June 2023.
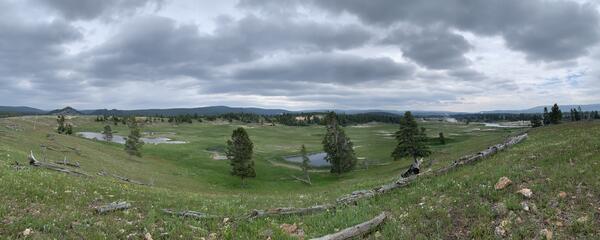
Pocket Basin hydrothermal explosion crater, Yellowstone National Park
Pocket Basin hydrothermal explosion crater, Yellowstone National ParkPanoramic view of the Pocket Basin hydrothermal explosion crater located in Lower Geyser Basin, Yellowstone National Park. The crater is approximately 365 by 800 meters (1200 by 2600 feet) and formed about 13,900 years ago, at the end of the most recent ice age.
Pocket Basin hydrothermal explosion crater, Yellowstone National Park
Pocket Basin hydrothermal explosion crater, Yellowstone National ParkPanoramic view of the Pocket Basin hydrothermal explosion crater located in Lower Geyser Basin, Yellowstone National Park. The crater is approximately 365 by 800 meters (1200 by 2600 feet) and formed about 13,900 years ago, at the end of the most recent ice age.

Thermal feature UNNG-GHG-17a, Upper Geyser Basin, Yellowstone National Park, on May 31, 2023
Thermal feature UNNG-GHG-17a, Upper Geyser Basin, Yellowstone National Park, on May 31, 2023Thermal feature UNNG-GHG-17a, not far from Sponge Geyser on Geyser Hill in Upper Geyser Basin, Yellowstone National Park. The feature formed during a period of thermal unrest that began in May 2023 and threw debris and hot water onto the adjacent boardwalk, which was closed for safety. National Park Service photo by Kiernan Folz-Donahue, May 31, 2023.
Thermal feature UNNG-GHG-17a, Upper Geyser Basin, Yellowstone National Park, on May 31, 2023
Thermal feature UNNG-GHG-17a, Upper Geyser Basin, Yellowstone National Park, on May 31, 2023Thermal feature UNNG-GHG-17a, not far from Sponge Geyser on Geyser Hill in Upper Geyser Basin, Yellowstone National Park. The feature formed during a period of thermal unrest that began in May 2023 and threw debris and hot water onto the adjacent boardwalk, which was closed for safety. National Park Service photo by Kiernan Folz-Donahue, May 31, 2023.
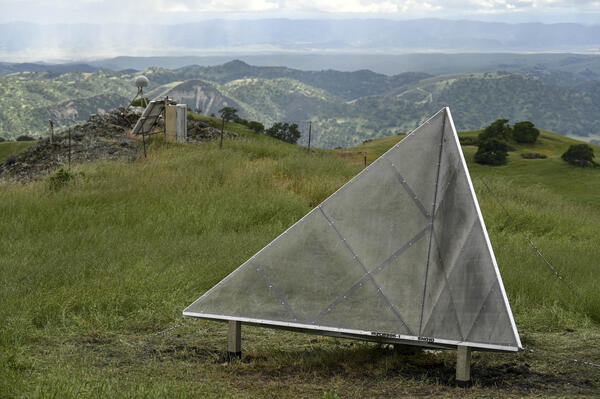
Corner reflector, designed to reflect satellite radar signals
Corner reflector, designed to reflect satellite radar signalsA corner reflector, designed to reflect satellite radar signals and useful for calibrating radar data, with GPS station PEA1 (and the San Andreas fault) in the background. Photo by Scott Johnson, EarthScope Consortium, on May 2, 2023.
Corner reflector, designed to reflect satellite radar signals
Corner reflector, designed to reflect satellite radar signalsA corner reflector, designed to reflect satellite radar signals and useful for calibrating radar data, with GPS station PEA1 (and the San Andreas fault) in the background. Photo by Scott Johnson, EarthScope Consortium, on May 2, 2023.

Borehole station B945, near Panther Meadow between Mammoth Hot Springs and Norris Geyser Basin in Yellowstone National Park
Borehole station B945, near Panther Meadow between Mammoth Hot Springs and Norris Geyser Basin in Yellowstone National ParkBorehole station B945, near Panther Meadow between Mammoth Hot Springs and Norris Geyser Basin in Yellowstone National Park. Left (“before”) panel shows old VSAT satellite communication network, with a large, round antenna (photo by Scott Johnson, EarthScope Consortium, on May 13, 2022). Right (“after”) panel shows the station with a new Starlink antenna
Borehole station B945, near Panther Meadow between Mammoth Hot Springs and Norris Geyser Basin in Yellowstone National Park
Borehole station B945, near Panther Meadow between Mammoth Hot Springs and Norris Geyser Basin in Yellowstone National ParkBorehole station B945, near Panther Meadow between Mammoth Hot Springs and Norris Geyser Basin in Yellowstone National Park. Left (“before”) panel shows old VSAT satellite communication network, with a large, round antenna (photo by Scott Johnson, EarthScope Consortium, on May 13, 2022). Right (“after”) panel shows the station with a new Starlink antenna

Soil carbon dioxide concentration and temperature at a new thermal area near Tern Lake in Yellowstone National Park
Soil carbon dioxide concentration and temperature at a new thermal area near Tern Lake in Yellowstone National ParkSoil carbon dioxide concentration and temperature measured at a new thermal area near Tern Lake in Yellowstone National Park on the east side of Yellowstone Caldera. A, Map of soil carbon dioxide flux simulated based on measurements made at the black dots in September 2022. B, Map of soil temperature at a depth of 20 centimeters (8 inches).
Soil carbon dioxide concentration and temperature at a new thermal area near Tern Lake in Yellowstone National Park
Soil carbon dioxide concentration and temperature at a new thermal area near Tern Lake in Yellowstone National ParkSoil carbon dioxide concentration and temperature measured at a new thermal area near Tern Lake in Yellowstone National Park on the east side of Yellowstone Caldera. A, Map of soil carbon dioxide flux simulated based on measurements made at the black dots in September 2022. B, Map of soil temperature at a depth of 20 centimeters (8 inches).

Distribution of hydrothermal features in Yellowstone as a function of their pH
Distribution of hydrothermal features in Yellowstone as a function of their pHDistribution of hydrothermal features in Yellowstone as a function of their pH (modified and updated from Nordstrom et al., 2009). There are two distinct groupings: one is more acidic, and the other neutral to basic.
Distribution of hydrothermal features in Yellowstone as a function of their pH
Distribution of hydrothermal features in Yellowstone as a function of their pHDistribution of hydrothermal features in Yellowstone as a function of their pH (modified and updated from Nordstrom et al., 2009). There are two distinct groupings: one is more acidic, and the other neutral to basic.

Front cover of the Yellowstone Volcano Observatory 2022 annual report
Front cover of the Yellowstone Volcano Observatory 2022 annual reportFront cover of the Yellowstone Volcano Observatory 2022 annual report, which includes a summary of earthquake, deformation, and geyser activity, as well as research investigations and other information.
Front cover of the Yellowstone Volcano Observatory 2022 annual report
Front cover of the Yellowstone Volcano Observatory 2022 annual reportFront cover of the Yellowstone Volcano Observatory 2022 annual report, which includes a summary of earthquake, deformation, and geyser activity, as well as research investigations and other information.

Map of Timber Hill basalt in the context of the Yellowstone hotspot track
Map of Timber Hill basalt in the context of the Yellowstone hotspot trackMap of the northwestern U.S., showing the approximate locations of the Yellowstone hotspot volcanic fields (orange) and Columbia River Basalts (gray). Boundary of Yellowstone National Park is shown in yellow. Inset shows physiographic map of southwest Montana and central Idaho.
Map of Timber Hill basalt in the context of the Yellowstone hotspot track
Map of Timber Hill basalt in the context of the Yellowstone hotspot trackMap of the northwestern U.S., showing the approximate locations of the Yellowstone hotspot volcanic fields (orange) and Columbia River Basalts (gray). Boundary of Yellowstone National Park is shown in yellow. Inset shows physiographic map of southwest Montana and central Idaho.

Geologic map of the Timber Hill basalt Sweetwater Hills, Montana
Geologic map of the Timber Hill basalt Sweetwater Hills, MontanaSimplified geologic map of the Timber Hill basalt and underlying geology in the Sweetwater Hills. The Sweetwater Road is shown by red. Note the basalt flow generally rests on poorly cemented sediments of the Sixmile Creek Formation shown in orange. Map by Jesse Mosolof (Montana Bureau of Mines and Geology).
Geologic map of the Timber Hill basalt Sweetwater Hills, Montana
Geologic map of the Timber Hill basalt Sweetwater Hills, MontanaSimplified geologic map of the Timber Hill basalt and underlying geology in the Sweetwater Hills. The Sweetwater Road is shown by red. Note the basalt flow generally rests on poorly cemented sediments of the Sixmile Creek Formation shown in orange. Map by Jesse Mosolof (Montana Bureau of Mines and Geology).

Simplified map of the Wyoming Province
Simplified map of the Wyoming Province—a craton composed of Archean-age continental crust. Archean- and Proterozoic-age rocks outcrop in many places within the Wyoming Province and are shown as dark grey blobs. The yellow blob highlights the location of the Hellroaring and Crevice plutons, a small portion of which are exposed in northern Yellowstone National Park.
Simplified map of the Wyoming Province—a craton composed of Archean-age continental crust. Archean- and Proterozoic-age rocks outcrop in many places within the Wyoming Province and are shown as dark grey blobs. The yellow blob highlights the location of the Hellroaring and Crevice plutons, a small portion of which are exposed in northern Yellowstone National Park.
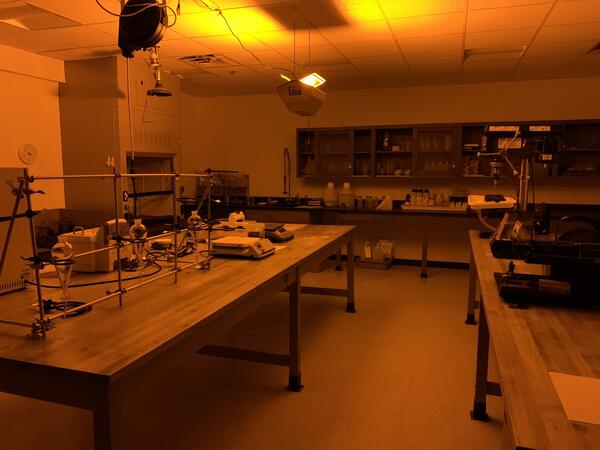
University of Texas at Arlington Luminescence Laboratory
University of Texas at Arlington Luminescence LaboratoryUniversity of Texas at Arlington Luminescence Laboratory, where samples are prepared for luminescence dating by analyzing them under dim amber lighting conditions to maintain light-safe conditions. Photograph by Karissa Cordero, University of Texas at Arlington, April 2023.
University of Texas at Arlington Luminescence Laboratory
University of Texas at Arlington Luminescence LaboratoryUniversity of Texas at Arlington Luminescence Laboratory, where samples are prepared for luminescence dating by analyzing them under dim amber lighting conditions to maintain light-safe conditions. Photograph by Karissa Cordero, University of Texas at Arlington, April 2023.

Geologists work to collect sediment cores from ice-covered Henrys Lake, Idaho
Geologists work to collect sediment cores from ice-covered Henrys Lake, IdahoUSGS scientists work to recover sediment cores from Henrys Lake, Idaho. (Left): geologists traverse frozen Henrys Lake with coring supplies. USGS photo by Sylvia Nicovich, March 30, 2023. (Right) Geologists lower the corer into the lake through a hole augured through the ice. USGS photo by Chris DuRoss, March 31, 2023.
Geologists work to collect sediment cores from ice-covered Henrys Lake, Idaho
Geologists work to collect sediment cores from ice-covered Henrys Lake, IdahoUSGS scientists work to recover sediment cores from Henrys Lake, Idaho. (Left): geologists traverse frozen Henrys Lake with coring supplies. USGS photo by Sylvia Nicovich, March 30, 2023. (Right) Geologists lower the corer into the lake through a hole augured through the ice. USGS photo by Chris DuRoss, March 31, 2023.

Frying Pan Lake, New Zealand
Frying Pan Lake (also called Waimangu Cauldron), in New Zealand, sits within Echo Crater, which formed during the 1886 eruption of Tarawera. A hydrothermal explosion from the crater in 1917 resulted in the formation of the hot spring "lake" by 1918.
Frying Pan Lake (also called Waimangu Cauldron), in New Zealand, sits within Echo Crater, which formed during the 1886 eruption of Tarawera. A hydrothermal explosion from the crater in 1917 resulted in the formation of the hot spring "lake" by 1918.
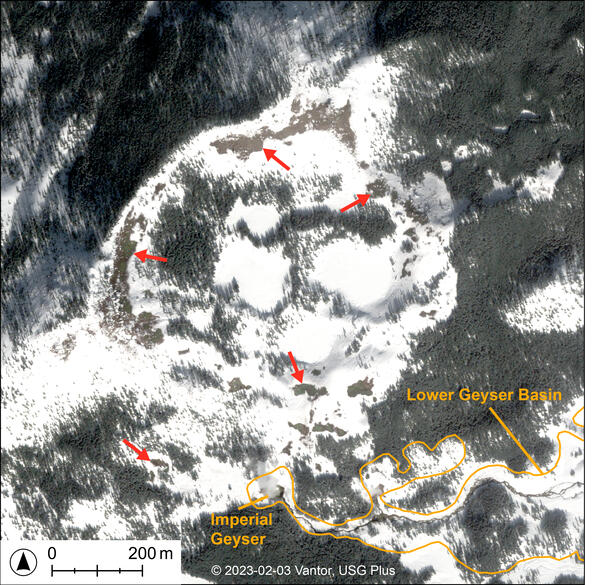
Subtle thermal ground revealed by wintertime satellite imagery of Twin Buttes, Yellowstone National Park
Subtle thermal ground revealed by wintertime satellite imagery of Twin Buttes, Yellowstone National ParkWorldView-2 natural-color satellite image from February 3, 2023, showing snow-free zones around Twin Buttes, just beyond the southwest portion of Lower Geyser Basin. At the time and date this image was acquired, there was extensive
Subtle thermal ground revealed by wintertime satellite imagery of Twin Buttes, Yellowstone National Park
Subtle thermal ground revealed by wintertime satellite imagery of Twin Buttes, Yellowstone National ParkWorldView-2 natural-color satellite image from February 3, 2023, showing snow-free zones around Twin Buttes, just beyond the southwest portion of Lower Geyser Basin. At the time and date this image was acquired, there was extensive

Map of the distribution of pH for thermal pools within Norris Geyser Basin, Yellowstone National Park
Map of the distribution of pH for thermal pools within Norris Geyser Basin, Yellowstone National ParkMap of the distribution of pH for thermal pools within Norris Geyser Basin, Yellowstone National Park. Cool colors are acidic, and warm colors are neutral to slightly basic. These data were collected and organized using Geographic Information System (GIS) tools. Map by Jefferson Hungerford and Kiernan Folz-Donahue, Yellowstone National Park.
Map of the distribution of pH for thermal pools within Norris Geyser Basin, Yellowstone National Park
Map of the distribution of pH for thermal pools within Norris Geyser Basin, Yellowstone National ParkMap of the distribution of pH for thermal pools within Norris Geyser Basin, Yellowstone National Park. Cool colors are acidic, and warm colors are neutral to slightly basic. These data were collected and organized using Geographic Information System (GIS) tools. Map by Jefferson Hungerford and Kiernan Folz-Donahue, Yellowstone National Park.