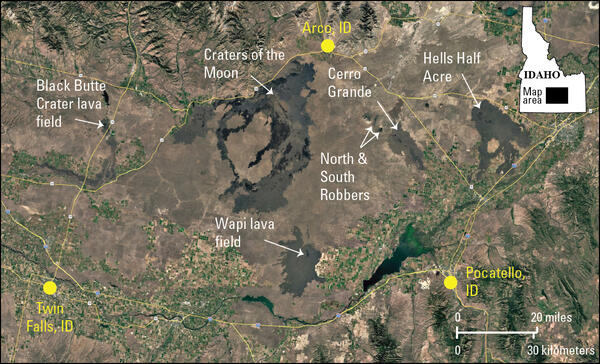
U.S. flag

An official website of the United States government

Images

Images related to Yellowstone Volcano Observatory.

Filter Total Items: 727
Maps with blue-red cross sections showing resistive structures near the surface and conductive structures beneath
Surface imagery and subsurface electrical resistivity tomography results from Rosette Spring in Yellowstone’s Lower Geyser Basin

Surface imagery and subsurface electrical resistivity tomography results from Rosette Spring in Yellowstone’s Lower Geyser Basin. A) Site Overview: Google Earth imagery of Sentinel Meadows identifying Rosette Spring, Flat Cone, Steep Cone, and Mound Cone. Red lines denote the five parallel NW-SE electrical resistivity tomography (ERT) survey profiles.

Map of the globe centered on the southern Indian Ocean between Antarctica, Australia, and Africa
Google Earth map showing the location of Yellowstone Caldera’s antipode

Google Earth map showing the location of Yellowstone Caldera’s antipode, the Kerguelen Plateau in the southern Indian Ocean, and Heard and McDonald Islands, which host active volcanoes.

Ice-covered mountain  under blue sky with choppy dark blue ocean water in the foreground
Big Ben Volcano on Heard Island

Big Ben Volcano on Heard Island. Credit: Australian Antarctic Division (A.J. Graff).

two temperature spikes to 50 °C a few hours before a 70 °C spike followed by a lull to 10 °C, before return to 35 °C baseline
Echinus temperature record during February 6-7, 2026

Temperature record from Echinus Geyser outflow channel for February 6, 2026, at 8 p.m. MST to February 7, 2026, at 8 a.m. MST.  The plot shows initial baseline temperatures, then two spikes to 50 °C representing water surges, then an eruption marked by a spike to 70 °C followed by a lull to 10 °C, and finally a return to baseline.

Temperature record from Echinus Geyser outflow channel for February 6, 2026, at 8 p.m. MST to February 7, 2026, at 8 a.m. MST.  The plot shows initial baseline temperatures, then two spikes to 50 °C representing water surges, then an eruption marked by a spike to 70 °C followed by a lull to 10 °C, and finally a return to baseline.

area of bare ground among tree-covered region; thermal areas outside known hot ground indicated by wintertime satellite image
Satellite mapping of thermal ground at Secret Valley Hot Springs, Yellowstone National Park

(a) NAIP (National Agriculture Imagery Program) natural-color aerial photograph of Secret Valley Hot Springs, in the backcountry between Norris Geyser Basin and Madison Junction, from September 25, 2015, showing snow-free zone mapping based on snowy wintertime imagery from multiple years. The mapped boundaries of the thermal area are indicated by the orange out

(a) NAIP (National Agriculture Imagery Program) natural-color aerial photograph of Secret Valley Hot Springs, in the backcountry between Norris Geyser Basin and Madison Junction, from September 25, 2015, showing snow-free zone mapping based on snowy wintertime imagery from multiple years. The mapped boundaries of the thermal area are indicated by the orange out

Green lake surrounded by forest, with satellite inset of the same lake in winter with a few ice-free areas on the lake
Mapping thermal input to Fern Lake, Yellowstone National Park, using satellite imagery

(a) NAIP (National Agriculture Imagery Program) natural-color aerial photograph of Fern Lake, in the east part of Yellowstone National Park, from July 17, 2022, showing mapped locations of liquid water during the winter when the rest of the water body was iced over.  The mapped boundary of the lake is indicated by the orange outline, with shaded areas noting re

(a) NAIP (National Agriculture Imagery Program) natural-color aerial photograph of Fern Lake, in the east part of Yellowstone National Park, from July 17, 2022, showing mapped locations of liquid water during the winter when the rest of the water body was iced over.  The mapped boundary of the lake is indicated by the orange outline, with shaded areas noting re

Map of scattered seismicity, deformation showing spreading, and plot showing earthquakes per day near Norris Uplift Anomaly
Deformation and seismicity during 2024-2025 associated with Norris Uplift Anomaly, Yellowstone National Park

Map of horizontal velocities between July and December 2025 at Global Positioning System (GPS) stations P711 and NRWY (arrows and yellow circles; arrow length gives displacement rate) in the area between Norris Geyser Basin and Madison Junction. Dashed black line indicates boundary of Yellowstone Caldera and gray lines are roads.

Map of horizontal velocities between July and December 2025 at Global Positioning System (GPS) stations P711 and NRWY (arrows and yellow circles; arrow length gives displacement rate) in the area between Norris Geyser Basin and Madison Junction. Dashed black line indicates boundary of Yellowstone Caldera and gray lines are roads.

Map of Yellowstone caldera's north rim showing uplift and earthquakes located right in the center of the uplift
Map of uplift and earthquakes near Norris Geyser Basin, Yellowstone National Park, during 2024-2025

Map of uplift as seen by interferometric synthetic aperture radar (InSAR) covering the time between October 7, 2024, and October 2, 2025 (the uplift began in July 2025) along the north rim of Yellowstone Caldera to the south of Norris Geyser Basin (NGB). 

earthquakes were scattered throughout the Yellowstone region in 2025, mostly occurring between Hebgen Lake and Norris
Map of Yellowstone seismicity in 2025

Map of seismicity (red circles) in the Yellowstone region during 2025. Gray lines are roads, black dashed line shows the caldera boundary, Yellowstone National Park is outlined by black dot-dashed line, and gray dashed lines denote state boundaries.

Map of seismicity (red circles) in the Yellowstone region during 2025. Gray lines are roads, black dashed line shows the caldera boundary, Yellowstone National Park is outlined by black dot-dashed line, and gray dashed lines denote state boundaries.

Shaded relief map of Madison Junction area of Yellowstone with arrows showing motion of GPS stations away from uplift source
Horizontal GPS velocities during July-December 2025 in the Madison and Norris areas of Yellowstone National Park

Map of horizontal velocities between July and December 2025 at Global Positioning System (GPS) stations P711 and NRWY (arrows and yellow circles) in the area between Norris Geyser Basin and Madison Junction. Dashed red line indicates boundary of Yellowstone Caldera and gray lines are roads.

column plot showing numbers of earthquakes per day, with increased seismicity in September-December 2025
Plot of daily earthquakes located in the area of the Norris Uplift Anomaly during 2024-2025

Plot of numbers of earthquakes per day in the immediate vicinity of the Norris Uplift Anomaly during 2024-2025.  An increase in the rate of seismicity occurred in September-December 2025, especially in November.  The largest earthquake during that time was M2.7.

Plot of numbers of earthquakes per day in the immediate vicinity of the Norris Uplift Anomaly during 2024-2025.  An increase in the rate of seismicity occurred in September-December 2025, especially in November.  The largest earthquake during that time was M2.7.

The same hot spring shown with lots of sticks and rocks and red in color, and cleaned of debris and clear to gray in color
Hot spring along trail to Grand Prismatic Spring overlook before and after remediation

Hot spring located along the trail to the Grand Prismatic Spring overlook shown before and after the Yellowstone National Park Geology Program team cleaned the feature of sticks and rocks that were thrown in by visitors.  National Park Service photos by Margery Price, July and September 2025,

Hot spring located along the trail to the Grand Prismatic Spring overlook shown before and after the Yellowstone National Park Geology Program team cleaned the feature of sticks and rocks that were thrown in by visitors.  National Park Service photos by Margery Price, July and September 2025,

infographic with pie charts showing hat types and colors, maps showing locations, and logos that were on recovered hats
Infographic with statistics about hats that were recovered from thermal areas in Yellowstone National Park during 2025

Infographic showing the numbers, styles, colors, and other data regarding hats recovered from thermal areas by the Yellowstone National Park Geology Program in 2025.  Designed by Margery Price, Yellowstone National Park.

Map view and cross section with tightly clustered earthquakes depicting fluid-fault interaction in the Yellowstone area
Relocated Yellowstone seismicity recorded during 2008-2022

Map view of relocated Yellowstone seismicity recorded during 2008-2022, colored by time, on the left.  White line gives the outline of Yellowstone caldera. The A-A’ cross section through Yellowstone Lake is shown at the right and illustrates how seismic swarms that are distinct in time relate to one another.  Adapted from Florez and others, 2025 (

Map view of relocated Yellowstone seismicity recorded during 2008-2022, colored by time, on the left.  White line gives the outline of Yellowstone caldera. The A-A’ cross section through Yellowstone Lake is shown at the right and illustrates how seismic swarms that are distinct in time relate to one another.  Adapted from Florez and others, 2025 (

Colorful map of Yellowstone region with bullseyes of color on the north caldera rim and east caldera.
InSAR data from the Yellowstone region spanning October 7, 2024 to October 2, 2025

Interferogram created from satellite radar data collected on October 7, 2024, and October 2, 2025, over the Yellowstone region by the Sentinel-1 satellite system. Colored fringes indicate a change in distance (called range change) between the satellite and ground surface that is caused by surface deformation during the time spanned.

Interferogram created from satellite radar data collected on October 7, 2024, and October 2, 2025, over the Yellowstone region by the Sentinel-1 satellite system. Colored fringes indicate a change in distance (called range change) between the satellite and ground surface that is caused by surface deformation during the time spanned.

Map of Yellowstone with colored triangles and boxes showing locations, types, and operators for seismic stations
Yellowstone seismic network

Map of seismic stations in the Yellowstone region, with numbers of channels indicated by number and sensor type by color.  Inverted triangles indicate stations operated by University of Utah Seismograph Stations (UUSS), and squares indicate stations operated by other agencies.

Map of seismic stations in the Yellowstone region, with numbers of channels indicated by number and sensor type by color.  Inverted triangles indicate stations operated by University of Utah Seismograph Stations (UUSS), and squares indicate stations operated by other agencies.

A man and a woman work next to a tower with electronics equipment. Tools are scattered on the grass. Sparse trees behind.
Upgrading the WLWY continuous GPS site in Yellowstone National Park

EarthScope engineers Brendan Hodge (left) and Lia Lajoie (right) perform upgrades at the WLWY (White Lake) continuous GPS station in Yellowstone National Park.  The white box contains the receiver, while the barrel on the ground contains batteries.  The tower holds the solar panels, as well as a cellular modem and meteorological sensors that were recently

EarthScope engineers Brendan Hodge (left) and Lia Lajoie (right) perform upgrades at the WLWY (White Lake) continuous GPS station in Yellowstone National Park.  The white box contains the receiver, while the barrel on the ground contains batteries.  The tower holds the solar panels, as well as a cellular modem and meteorological sensors that were recently

Hundreds of hats laid out for display with a truck in the background providing a sense of scale
Hats collected by the Yellowstone National Park Geology Program from sensitive thermal areas in 2025

Just some of the hats collected by the Yellowstone National Park Geology Program from sensitive thermal areas throughout the park in 2025.  National Park Service photo by Margery Price, September 3, 2025.

Rock outcrop in the midst of a forest with a person standing on top collecting a sample
USGS geologist collects a sample from a potential newly recognized lava flow along the Gibbon River, Yellowstone National Park
plot showing spikes in temperature due to geyser eruptions over a 6-hour period in August 2025
Temperature record from Valentine and Guardian Geysers, Norris Geyser Basin, Yellowstone National Park, from August 24, 2025

Plot of temperatures measured by continuous loggers at Guardian Geyser (light red) and Valentine Geyser (dark red) on August 24, 2025. Activity at Guardian Geyser included episodic splashing for a few hours prior to the near-simultaneous eruptions of both geysers just after 6:30 a.m. MDT on this date.  Data collected by Mara Reed, Yellowstone National Park.

Plot of temperatures measured by continuous loggers at Guardian Geyser (light red) and Valentine Geyser (dark red) on August 24, 2025. Activity at Guardian Geyser included episodic splashing for a few hours prior to the near-simultaneous eruptions of both geysers just after 6:30 a.m. MDT on this date.  Data collected by Mara Reed, Yellowstone National Park.

Was this page helpful?