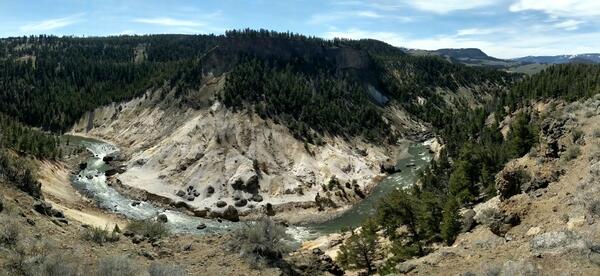
U.S. flag

An official website of the United States government

Images

Images related to Yellowstone Volcano Observatory.

Filter Total Items: 719
Seismic signal showing an icequake on Yellowstone Lake
Seismic signal of an icequake on Yellowstone Lake from January 24, 2022.

Signals from a suspected icequake that occurred on Yellowstone Lake recorded at Yellowstone Seismic Network stations YLA on Lake Butte (top) and YTP at The Promontory (bottom 3 plots). Plot shows about 2 minutes of data from January 24, 2022, starting at about 7:43:34 p.m. MST.  YLA waveform (YLA EHZ) was recorded on a vertical short-period sensor.

Signals from a suspected icequake that occurred on Yellowstone Lake recorded at Yellowstone Seismic Network stations YLA on Lake Butte (top) and YTP at The Promontory (bottom 3 plots). Plot shows about 2 minutes of data from January 24, 2022, starting at about 7:43:34 p.m. MST.  YLA waveform (YLA EHZ) was recorded on a vertical short-period sensor.

Plot showing seismic and acoustic waves from the 2022 Hunga Tonga–Hunga Haʻapai eruption as recorded in Yellowstone
Seismic and acoustic waves from the 2022 Hunga Tonga–Hunga Haʻapai eruption recorded by the Yellowstone Seismic Network

Signals recorded at station YDD in Yellowstone National Park from the 2022 Hunga Tonga–Hunga Haʻapai volcanic eruption. The seismometer at YDD recorded both the direct seismic phase (top left) as well as the atmospheric Lamb Wave that coupled to the ground as it propagated (top right).  The infrasound microphone at YDD recorded the atmospheric disturbance

Signals recorded at station YDD in Yellowstone National Park from the 2022 Hunga Tonga–Hunga Haʻapai volcanic eruption. The seismometer at YDD recorded both the direct seismic phase (top left) as well as the atmospheric Lamb Wave that coupled to the ground as it propagated (top right).  The infrasound microphone at YDD recorded the atmospheric disturbance

Map of seismicity in the Yellowstone region during 2021
Seismicity in the Yellowstone region during 2021

Map of seismicity (red circles) in the Yellowstone region during 2021. Gray lines are roads, black dashed line shows the caldera boundary, Yellowstone National Park is outlined by black dot-dashed line, and gray dashed lines denote state boundaries.

Map of seismicity (red circles) in the Yellowstone region during 2021. Gray lines are roads, black dashed line shows the caldera boundary, Yellowstone National Park is outlined by black dot-dashed line, and gray dashed lines denote state boundaries.

Difference in mapped rock units for Mount Everts, Yellowstone National Park

Simplified geologic maps showing the difference in mapped rock units from the current, large-scale geologic maps dividing Mount Everts and that join along the boundary between Montana and Wyoming.

Map of the Uhl Hill fault in eastern Grand Teton National Park, Wyoming

Map of the Uhl Hill fault in eastern Grand Teton National Park. Base map is a 1-meter lidar hillshade. Black arrows mark the visible fault scarp, and red lines mark locations where scarp profiles were generated from lidar data or field surveying.

Map of the Uhl Hill fault in eastern Grand Teton National Park. Base map is a 1-meter lidar hillshade. Black arrows mark the visible fault scarp, and red lines mark locations where scarp profiles were generated from lidar data or field surveying.

Castle Geyser features and Scanning Electron Microscope image of algal filament in a silica sheath

On the left is Castle Geyser during an eruption with a pool from nearby Tortoise Shell Spring showing photosynthetic pigments at the bottom. The middle image is of a small pool in the Geyser Hill Group in the Upper Geyser Basin with an outflow channel full of yellow, green, orange, red, and brown pigmented phototrophic microbial mats.

On the left is Castle Geyser during an eruption with a pool from nearby Tortoise Shell Spring showing photosynthetic pigments at the bottom. The middle image is of a small pool in the Geyser Hill Group in the Upper Geyser Basin with an outflow channel full of yellow, green, orange, red, and brown pigmented phototrophic microbial mats.

Siliceous sinter in the field and viewed via Scanning Electron Microscope

Left photo shows a loose piece of siliceous sinter that was precipitated around a photosynthetic microbial mat in the Lower Geyser Basin.  The microbial mat died when the outflow channel changed positions.

Scarp of the Uhl Hill fault in eastern Grand Teton National Park, Wyoming

Scarp of the Uhl Hill fault. Photo (top) is looking west at the east-facing fault scarp, with a geologist at the top of the scarp for scale. Here, the fault cuts through Pinedale-1 glacial deposits just south of a Pinedale-2 end moraine. Plot (bottom) is a scarp profile generated from lidar elevation data.

Scarp of the Uhl Hill fault. Photo (top) is looking west at the east-facing fault scarp, with a geologist at the top of the scarp for scale. Here, the fault cuts through Pinedale-1 glacial deposits just south of a Pinedale-2 end moraine. Plot (bottom) is a scarp profile generated from lidar elevation data.

Steaming hot spring and forest in background.  About a dozen logs are arranged alongside one another in the foreground.
Logs removed from Solitary Geyser in 2021

Logs and debris removed from Solitary Geyser, near Old Faithful, during remediation work in 2021.  Photo by Jeff Cross.

Image of Yellowstone Volcano monitoring map.

Screenshot of the December 8, 2021 Yellowstone volcano monitoring map. Seismometers, GPS, and earthquakes are the displayed icons, which can be filtered in the right menu.

Screenshot of the December 8, 2021 Yellowstone volcano monitoring map. Seismometers, GPS, and earthquakes are the displayed icons, which can be filtered in the right menu.

Cumulative number of aftershocks greater than magnitude 2.5 following the 2020 magnitude 6.5 Stanley earthquake

Cumulative number of aftershocks greater than magnitude 2.5 following the March 30, 2020, magnitude-6.5 Stanley earthquake in central Idaho. The black line shows the observed aftershocks, the red line shows the predicted number of aftershocks. Aftershocks are a normal and expected phenomenon following strong tectonic earthquakes.

Cumulative number of aftershocks greater than magnitude 2.5 following the March 30, 2020, magnitude-6.5 Stanley earthquake in central Idaho. The black line shows the observed aftershocks, the red line shows the predicted number of aftershocks. Aftershocks are a normal and expected phenomenon following strong tectonic earthquakes.

Regional map of southeastern Idaho showing Stanley earthquakes

Regional map of southeastern Idaho showing the relative location of Yellowstone National Park and the Stanley earthquake aftershocks. Yellowstone National Park (outlined in yellow) is at least 275 km away from the 2020 Mw6.5 Stanley earthquake. Several active faults (in red) are located between the Stanley earthquake and Yellowstone Caldera.

Regional map of southeastern Idaho showing the relative location of Yellowstone National Park and the Stanley earthquake aftershocks. Yellowstone National Park (outlined in yellow) is at least 275 km away from the 2020 Mw6.5 Stanley earthquake. Several active faults (in red) are located between the Stanley earthquake and Yellowstone Caldera.

A branching root cast from grasses that grew on the ashy lahars deposited along the ancestral Missouri River system

A branching root cast from grasses that grew on the ashy lahars deposited along the ancestral Missouri River system. Plant roots growing in calcareous soils made holes that were filled with calcite after the organics rotted away.  Photo by Rob Thomas, August 2021.

High powered microscopic images showing clay particles and diatoms
SEM_Colloidal_poolpng.png

Scanning electron microscopy (SEM) images of the Colloidal Pool colloids (images are a combination of backscatter and secondary electrons). The colloids are a mixture of clay particles, hydrated silica, alunite, and diatoms.

Scanning electron microscopy (SEM) images of the Colloidal Pool colloids (images are a combination of backscatter and secondary electrons). The colloids are a mixture of clay particles, hydrated silica, alunite, and diatoms.

Map of Porcelain Basin and images of colloidal pool over time.
Colloidal_Pool_maps_and_photos.png

Comparison of (a) 1904 Historical map with (b) 1988 USGS map. Colloidal Pool is a large, labeled pool roughly located on a straight line between Hurricane vent and Whirligig Geyser on the 1988 map (b); this same transect on the 1904 map (a) shows no feature at that location (white circle).

Comparison of (a) 1904 Historical map with (b) 1988 USGS map. Colloidal Pool is a large, labeled pool roughly located on a straight line between Hurricane vent and Whirligig Geyser on the 1988 map (b); this same transect on the 1904 map (a) shows no feature at that location (white circle).

Thin section photo of Lava Creek Tuff “unit 2"

Microscope thin-section photo of Lava Creek Tuff “unit 2.” Photo by Ray Salazar (Montana State University) on October 28, 2021.

View of White Mountain from the Sunlight Basin Road

A view of White Mountain -- a deposit of the Heart Mountain detachment -- from the Sunlight Basin Road in Wyoming. Much of the evidence supporting the lamprophyre diatreme triggering mechanism theory for the landslide was gathered at White Mountain.

A view of White Mountain -- a deposit of the Heart Mountain detachment -- from the Sunlight Basin Road in Wyoming. Much of the evidence supporting the lamprophyre diatreme triggering mechanism theory for the landslide was gathered at White Mountain.

Was this page helpful?