
The beach-dependent shorebirds project at the Woods Hole Coastal and Marine Science Center models current and future habitat availability for nesting shorebirds in an effort to map current and likely future habitat availability on a range of sites along the U.S. Atlantic coast.
All Multimedia
Access all multimedia to include images, video, audio, webcams, before-after imagery, and more. Filter and explore with filtering options to refine search.
Filter Total Items: 24926

Piping Plover Habitat, Cedar Island
The beach-dependent shorebirds project at the Woods Hole Coastal and Marine Science Center models current and future habitat availability for nesting shorebirds in an effort to map current and likely future habitat availability on a range of sites along the U.S. Atlantic coast.

Plot of Kīlauea ground motion
Plot of ground motion as recorded by a GPS station at Kīlauea's summit (red) and the Pu‘u ‘Ō‘ō vent (blue) for the 8 months leading up to the 2018 eruption. Note the sharp increase indicating pressurization beginning in March. Image shows an aerial view of Halema‘uma‘u crater and the actively overflowing lava lake on April 23, 2018.
Plot of ground motion as recorded by a GPS station at Kīlauea's summit (red) and the Pu‘u ‘Ō‘ō vent (blue) for the 8 months leading up to the 2018 eruption. Note the sharp increase indicating pressurization beginning in March. Image shows an aerial view of Halema‘uma‘u crater and the actively overflowing lava lake on April 23, 2018.

pockets of natural gas from the burning plant material can ignite
pockets of natural gas from the burning plant material can igniteWhen molten lava encroaches on grassland, forests, or other vegetated land, subsurface pockets of natural gas from the burning plant material can ignite, causing a blast known as a "methane explosion." To avoid this hazard, keep a safe distance—at least tens of yards—from the margin of an active lava flow in vegetated areas.

Polar Bears Film Their Own Sea Ice World
This video showcases the latest polar bear point-of-view footage to date along with an interview of the research scientist who is responsible for the project. Released in conjunction with a new scientific study led by the USGS.
This video showcases the latest polar bear point-of-view footage to date along with an interview of the research scientist who is responsible for the project. Released in conjunction with a new scientific study led by the USGS.

Power Generation Plant
Source: U.S. Nuclear Regulatory Commission
Source: U.S. Nuclear Regulatory Commission

progression of the magmatic intrusion from Kīlauea
progression of the magmatic intrusion from KīlaueaEarthquakes (red dots) track the progression of the magmatic intrusion from Kīlauea Volcano's middle East Rift Zone to the lower East Rift Zone between April 30 and May 3, 2018. Orange triangles show the locations of fissure 1 (right), which erupted on May 3, and Pu‘u ‘Ō‘ō (left).

PROSPER in StreamStats screenshot
PROSPER in StreamStats screenshot
PROSPER in StreamStats screenshot

Public Supply Water Use in 2015
Public Supply Water Use in 2015

R/V Petrel
R/V Petrel surveying off Beach Haven, NJ during USGS FA 2018-001-FA
R/V Petrel surveying off Beach Haven, NJ during USGS FA 2018-001-FA

Raindrop trace in StreamStats screenshot
Screenshot of raindrop trace in StreamStats
Screenshot of raindrop trace in StreamStats

Regulation in StreamStats screenshot
Regulation in StreamStats screenshot
Regulation in StreamStats screenshot
Releasing a loggerhead with radio tag
A loggerhead sea turtle, outfitted with a popoff ADL package (orange item on the turtle’s back), is released by New England Aquarium Biologist Nick Whitney.
A loggerhead sea turtle, outfitted with a popoff ADL package (orange item on the turtle’s back), is released by New England Aquarium Biologist Nick Whitney.

RV Petrel towing subbottom profiler
RV Petrel towing subbottom profiler (yellow raft) parallel to the beach to measure the thickness of sand offshore.
RV Petrel towing subbottom profiler (yellow raft) parallel to the beach to measure the thickness of sand offshore.

Salt Deposits (Gypsum)
Salt Deposits (Gypsum). (Source: Siim Sepp, http://www.sandatlas.org/)

Salt Impacted Field
Salt impacted field.
(Source: Colorado State University Extension, Fact Sheet No. 0.521)

Samples processing from an ecological monitoring and processing statio
Samples processing from an ecological monitoring and processing statioUSGS scientists retrieve and process samples from an ecological processing monitoring station. Each station includes a caged native mussel (shown attached to the buoy rope) and a sampler for measuring invertebrate consumers

Scientist surveying the behavior of birds at Pelican Island, Alabama
Scientist surveying the behavior of birds at Pelican Island, AlabamaScientist surveying the presence and behavior of birds at Pelican Island, Alabama. The CMHRP is working with personnel within the Ecosystems Mission Area on this project to identify how physical characteristics of barrier islands influence use by wintering shorebirds.

Scientists collect data on Pelican Island, Alabama
Scientists collect data on Pelican Island, AlabamaIn an effort spanning the Natural Hazards and Ecosystems Mission Areas, pilots from the Saint Petersburg and Woods Hole Coastal and Marine Science Centers collect imagery data using Unmanned Aerial System (UAS) while personnel from the Wetlands and Aquatic Research Center (WARC) conduct ground-based site surveys of Pelican Island, Alabama.
Scientists Looking for Grass Carp Larvae
Dr. Patrick Kocovsky and Maddy Tomczak, University of Toledo student, look for Grass Carp lavae and eggs in the Sandusky River using a set of bongo nets, so named because they resemble bongo drums. The nets are deployed one above the other so that one samples the surface water while the other samples deeper water.
Dr. Patrick Kocovsky and Maddy Tomczak, University of Toledo student, look for Grass Carp lavae and eggs in the Sandusky River using a set of bongo nets, so named because they resemble bongo drums. The nets are deployed one above the other so that one samples the surface water while the other samples deeper water.
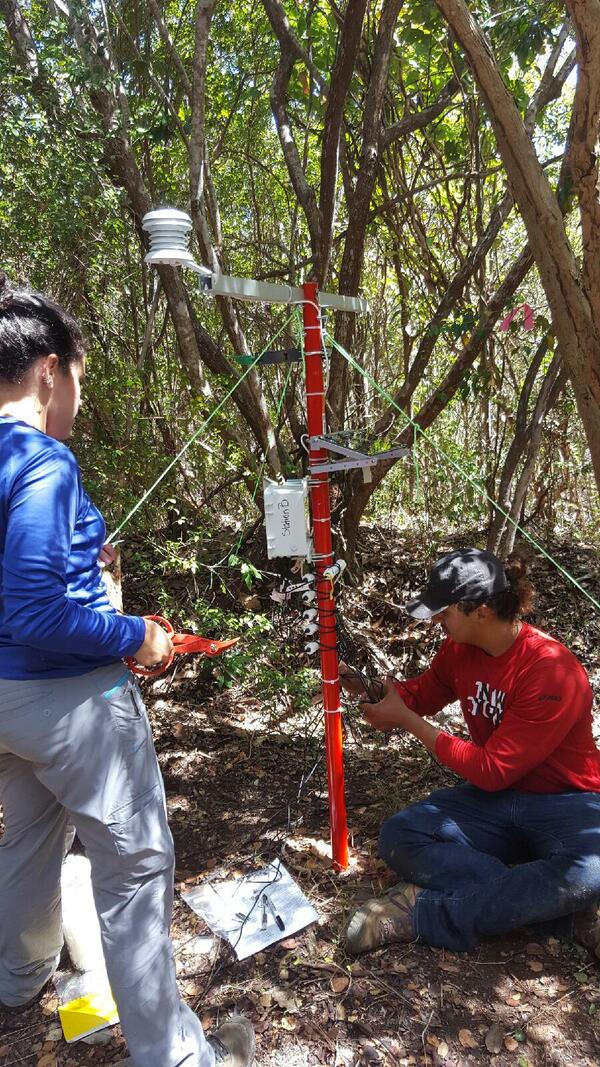
Scientists Monitoring Moisture in a Puerto Rican Forest
Scientists Monitoring Moisture in a Puerto Rican ForestDeploying environmental monitoring equipment in a mesic (between wet and dry) forest in western Puerto Rico. Characterizing fine-scale moisture gradients between dry and wet forests is critical to understand which habitats are likely to remain suitable for vulnerable amphibian species as the climate changes.

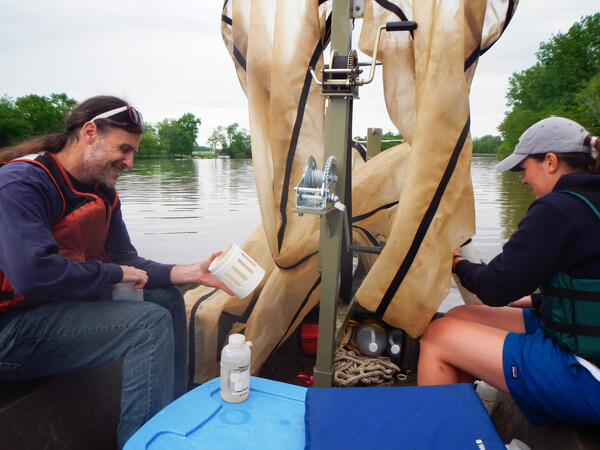
SEABOSS Collage
SEABed Observation and Sampling System (SEABOSS) (center image) and the MiniSEABOSS (right) designed for rapid, inexpensive, and effective collection of seabed imagery (photographs and video) as well sediment samples from the coastal/inner-continental shelf regions.
SEABed Observation and Sampling System (SEABOSS) (center image) and the MiniSEABOSS (right) designed for rapid, inexpensive, and effective collection of seabed imagery (photographs and video) as well sediment samples from the coastal/inner-continental shelf regions.