
In the past, each USGS topographic map typically required 3 individual lithographic stones for printing, one for each color shown on the map.
Images
Explore our planet through photography and imagery, including climate change and water all the way back to the 1800s when the USGS was surveying the country by horse and buggy.
Filter Total Items: 21545

Lithographic Printing Stones for Map-making
In the past, each USGS topographic map typically required 3 individual lithographic stones for printing, one for each color shown on the map.

Low-level Helicopter Towing a Large Wire-Loop Contraption Hanging from a Cable
A low-level helicopter towing a large wire-loop contraption hanging from a cable is flying straight across an open field in Nebraska on a clear day.
A low-level helicopter towing a large wire-loop contraption hanging from a cable is flying straight across an open field in Nebraska on a clear day.

Low-level Helicopter Towing a Large Wire-Loop Contraption Hanging From a Cable
Helicopter towing a large, wire-loop contraption hanging from a cable is turning in air on a relatively clear day in Nebraska.
Helicopter towing a large, wire-loop contraption hanging from a cable is turning in air on a relatively clear day in Nebraska.

Lunch Lake in the Seven Lakes Basin
Deer in the mist by Lunch Lake in the Seven Lakes Basin of Olympic National Park.
Deer in the mist by Lunch Lake in the Seven Lakes Basin of Olympic National Park.
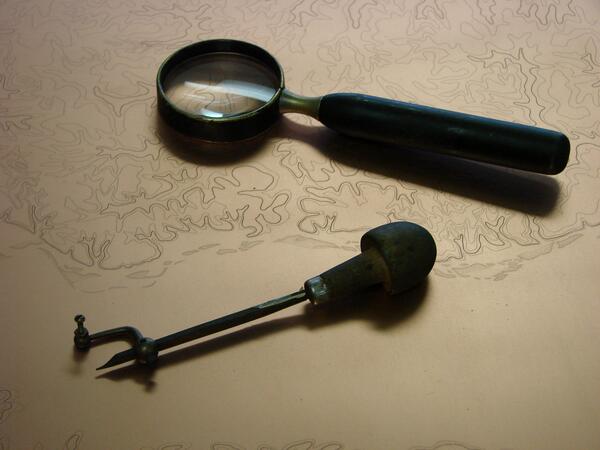
Map Contour Engraving Tools
Tools of the trade for a US Geological Survey engraver- the burin and the hand lens, resting on a contours engraving.
Tools of the trade for a US Geological Survey engraver- the burin and the hand lens, resting on a contours engraving.

Maureen Ryan with Chuckler
Reseracher Maureen Ryan poses by a pond holding one of her study species, a cascades frog.
Reseracher Maureen Ryan poses by a pond holding one of her study species, a cascades frog.

Meadow Vole
Meadow vole rests in its habitat.

Measuring a Frog in the Cascades
USGS researchers Brome McCreary (orange vest) and Chris Pearl take measurements on Cascades frog at a mountain lake in Oregon.
USGS researchers Brome McCreary (orange vest) and Chris Pearl take measurements on Cascades frog at a mountain lake in Oregon.

Measuring Streamflow in 1920
H.D. McGlashan measures streamflow in the Merced River, circa 1920. Multiple velocity and water-depth measurements along a stream cross section are used to calculate the total volume of water passing a certain location over a specific period of time (cubic feet per second).
Location: Merced River, Yosemite National Park, California

Methane Seeps along Offshore New England
Seafloor image at a deepwater (~1400 m water depth) seep site on the New England margin. Seafloor conditions here are well inside the pressure-temperature stability field for methane hydrate. Gas being emitted below the rock overhang has formed gas hydrate (the white ice-like material). Distinct bubbles are visible in the foreground. The red laser scale is 10 cm.
Seafloor image at a deepwater (~1400 m water depth) seep site on the New England margin. Seafloor conditions here are well inside the pressure-temperature stability field for methane hydrate. Gas being emitted below the rock overhang has formed gas hydrate (the white ice-like material). Distinct bubbles are visible in the foreground. The red laser scale is 10 cm.

Methane Seeps along Offshore Virginia
Numerous distinct methane streams emanating from the seafloor at an upper slope (< 500 m water depth) cold seep site offshore Virginia. Image courtesy of NOAA Okeanos Explorer Program, 2013 Northeast U.S. Canyons Expedition.
Numerous distinct methane streams emanating from the seafloor at an upper slope (< 500 m water depth) cold seep site offshore Virginia. Image courtesy of NOAA Okeanos Explorer Program, 2013 Northeast U.S. Canyons Expedition.

Monitoring Trees
Every year, the health of each of the thousands of trees in established research plots is checked, and if a tree has died, the cause of death is determined.
Every year, the health of each of the thousands of trees in established research plots is checked, and if a tree has died, the cause of death is determined.

Pacific Lamprey (Lampetra tridentata)
Larval Pacific lamprey collected from the upper Umatilla River in northeastern Oregon.
Larval Pacific lamprey collected from the upper Umatilla River in northeastern Oregon.

Panorama of Silverton, Colorado
Panoramic photo of Silverton, Colorado, with Sultan Mountain in the distance. Silverton is the town most directly affected by the Gold King mine blowout.
Panoramic photo of Silverton, Colorado, with Sultan Mountain in the distance. Silverton is the town most directly affected by the Gold King mine blowout.

Pictographs on Rock
Pictographs at Saguaro National Park. Photographed 2006 or earlier
Pictographs at Saguaro National Park. Photographed 2006 or earlier

Pictographs on Rock
Pictographs at Saguaro National Park. Photographed 2006 or earlier.
Pictographs at Saguaro National Park. Photographed 2006 or earlier.

Radiolarians (10 Species)
A photomicrograph depicting the siliceous tests of ten species of marine radiolarians. Upon death, their tests can form siliceous marine sediments known as radiolarian ooze.
A photomicrograph depicting the siliceous tests of ten species of marine radiolarians. Upon death, their tests can form siliceous marine sediments known as radiolarian ooze.

Radiolarians (10 Species)
A photomicrograph depicting the siliceous tests of ten species of marine radiolarians. This image has been inverted to bring out details. Upon death, their tests can form siliceous marine sediments known as radiolarian ooze.
A photomicrograph depicting the siliceous tests of ten species of marine radiolarians. This image has been inverted to bring out details. Upon death, their tests can form siliceous marine sediments known as radiolarian ooze.

Redbeds Near Herat
Aerial view near Herat. Dark red iron stains hint that other minerals might be found.
Aerial view near Herat. Dark red iron stains hint that other minerals might be found.

Riparian system within the rugged desert landscape.
An example of a riparian system within the rugged desert landscape. Zone-tailed Hawks nested in the trees in the bottom of the canyon.
An example of a riparian system within the rugged desert landscape. Zone-tailed Hawks nested in the trees in the bottom of the canyon.

Ross basin, upper Cement Creek in Watershed above North Fork Cement Creek
Western view toward the Red Mountains near Silverton, Colorado, taken just upstream from the North Fork Cement Creek drainage in 2006. The photo illustrates acidic drainage (red drainage at right) and less acidic drainage (white drainage at left of photo) that originates from altered rocks and mines in the watershed.
Western view toward the Red Mountains near Silverton, Colorado, taken just upstream from the North Fork Cement Creek drainage in 2006. The photo illustrates acidic drainage (red drainage at right) and less acidic drainage (white drainage at left of photo) that originates from altered rocks and mines in the watershed.