



A magnitude 7.0 earthquake ruptured the Mendocino Transform Fault offshore Northern California on December 5, 2024. The USGS and colleagues from the Woods Hole Oceanographic Institution’s Ocean Bottom Seismic Instrument Center deployed our new fleet of rapid response ocean bottom seismographs just 11 days later—the fastest response in U.S. history.
Images
Coastal and Marine Hazards and Resources Program images.
Filter Total Items: 2413

Mendocino RROBS Retrieval
A magnitude 7.0 earthquake ruptured the Mendocino Transform Fault offshore Northern California on December 5, 2024. The USGS and colleagues from the Woods Hole Oceanographic Institution’s Ocean Bottom Seismic Instrument Center deployed our new fleet of rapid response ocean bottom seismographs just 11 days later—the fastest response in U.S. history.

Mendocino RROBS Retrieval
A magnitude 7.0 earthquake ruptured the Mendocino Transform Fault offshore Northern California on December 5, 2024. The USGS and colleagues from the Woods Hole Oceanographic Institution’s Ocean Bottom Seismic Instrument Center deployed our new fleet of rapid response ocean bottom seismographs just 11 days later—the fastest response in U.S. history.
A magnitude 7.0 earthquake ruptured the Mendocino Transform Fault offshore Northern California on December 5, 2024. The USGS and colleagues from the Woods Hole Oceanographic Institution’s Ocean Bottom Seismic Instrument Center deployed our new fleet of rapid response ocean bottom seismographs just 11 days later—the fastest response in U.S. history.
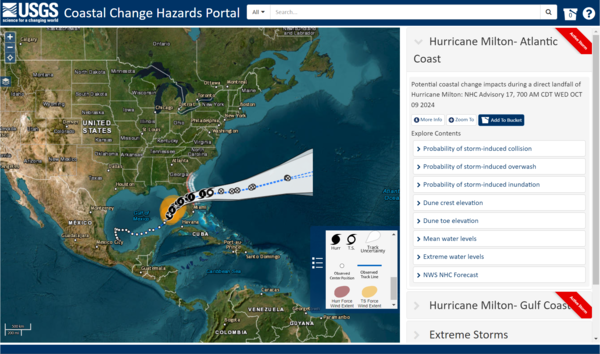
CCH Portal - Hurricane Milton
Coastal Change Hazards Portal showing the trajectory of Hurricane Milton and the various data users could explore on the map.
Coastal Change Hazards Portal showing the trajectory of Hurricane Milton and the various data users could explore on the map.
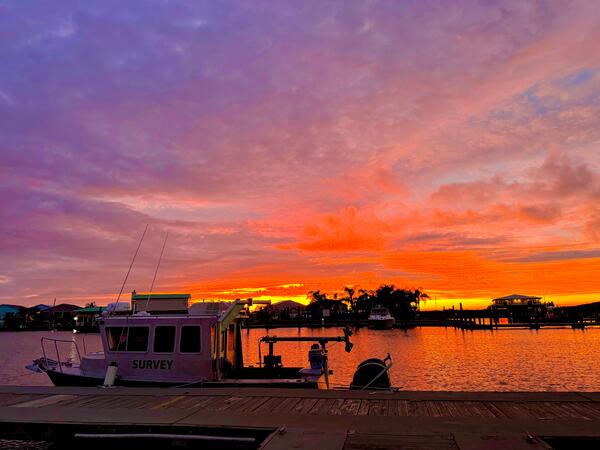
MRDF Geophysical Survey
The USGS has a long history of studying seafloor instability in the Mississippi River Delta Front, beginning in the 1970s.
As part of the OASIS project, we play a leading role in seafloor mapping, geophysical imaging, and interpreting the processes that shape this important region.
The USGS has a long history of studying seafloor instability in the Mississippi River Delta Front, beginning in the 1970s.
As part of the OASIS project, we play a leading role in seafloor mapping, geophysical imaging, and interpreting the processes that shape this important region.
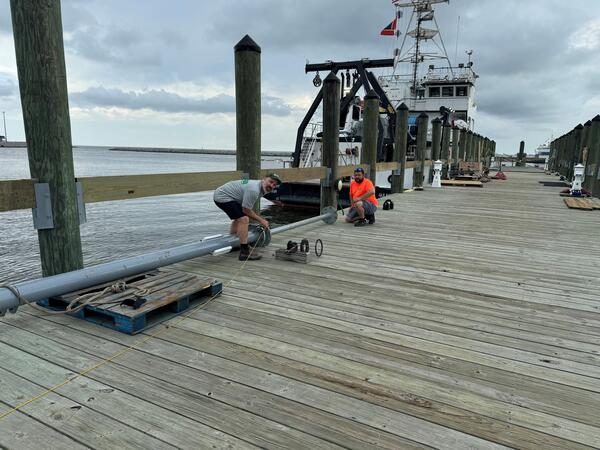
MRDF Coring
The USGS has a long history of studying seafloor instability in the Mississippi River Delta Front, beginning in the 1970s.
As part of the OASIS project, we play a leading role in seafloor mapping, geophysical imaging, and interpreting the processes that shape this important region.
The USGS has a long history of studying seafloor instability in the Mississippi River Delta Front, beginning in the 1970s.
As part of the OASIS project, we play a leading role in seafloor mapping, geophysical imaging, and interpreting the processes that shape this important region.
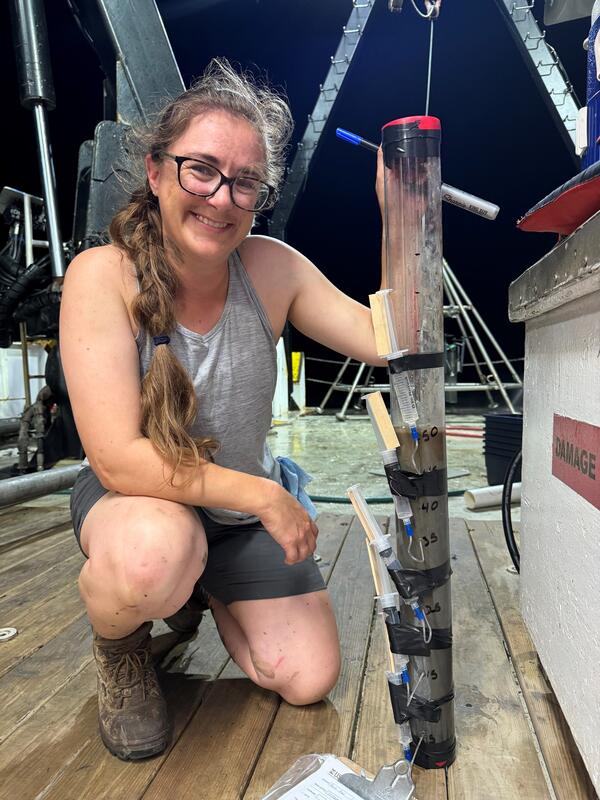
MRDF Coring
The USGS has a long history of studying seafloor instability in the Mississippi River Delta Front, beginning in the 1970s.
As part of the OASIS project, we play a leading role in seafloor mapping, geophysical imaging, and interpreting the processes that shape this important region.
The USGS has a long history of studying seafloor instability in the Mississippi River Delta Front, beginning in the 1970s.
As part of the OASIS project, we play a leading role in seafloor mapping, geophysical imaging, and interpreting the processes that shape this important region.
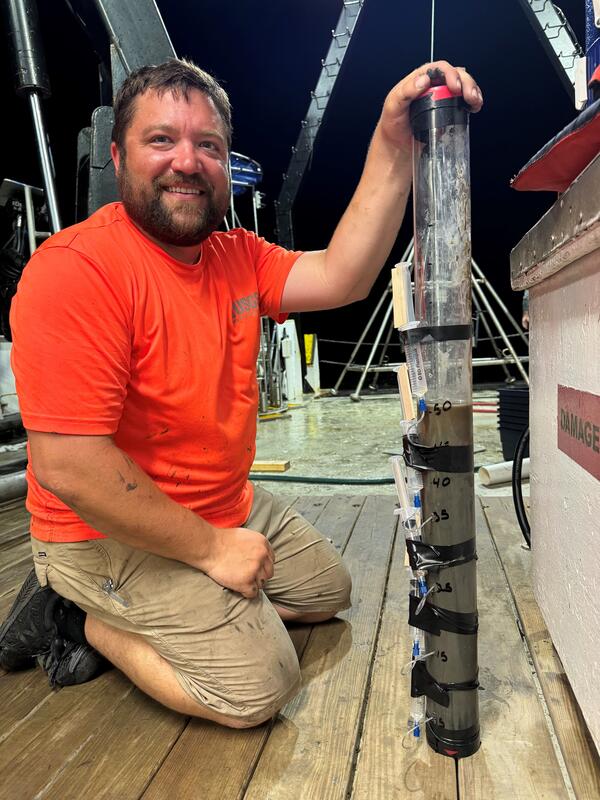
MRDF Mega Multi Coring
The USGS has a long history of studying seafloor instability in the Mississippi River Delta Front, beginning in the 1970s.
As part of the OASIS project, we play a leading role in seafloor mapping, geophysical imaging, and interpreting the processes that shape this important region.
The USGS has a long history of studying seafloor instability in the Mississippi River Delta Front, beginning in the 1970s.
As part of the OASIS project, we play a leading role in seafloor mapping, geophysical imaging, and interpreting the processes that shape this important region.
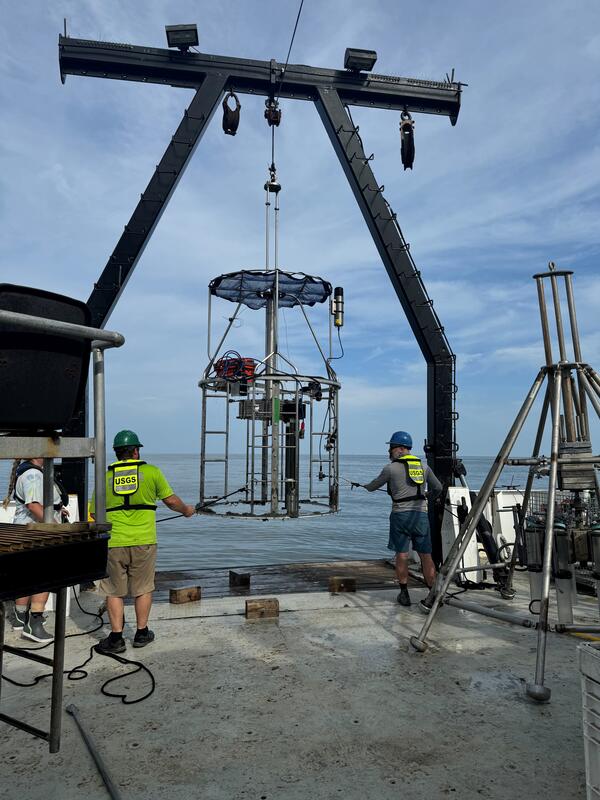
MRDF Coring
The USGS has a long history of studying seafloor instability in the Mississippi River Delta Front, beginning in the 1970s.
As part of the OASIS project, we play a leading role in seafloor mapping, geophysical imaging, and interpreting the processes that shape this important region.
The USGS has a long history of studying seafloor instability in the Mississippi River Delta Front, beginning in the 1970s.
As part of the OASIS project, we play a leading role in seafloor mapping, geophysical imaging, and interpreting the processes that shape this important region.
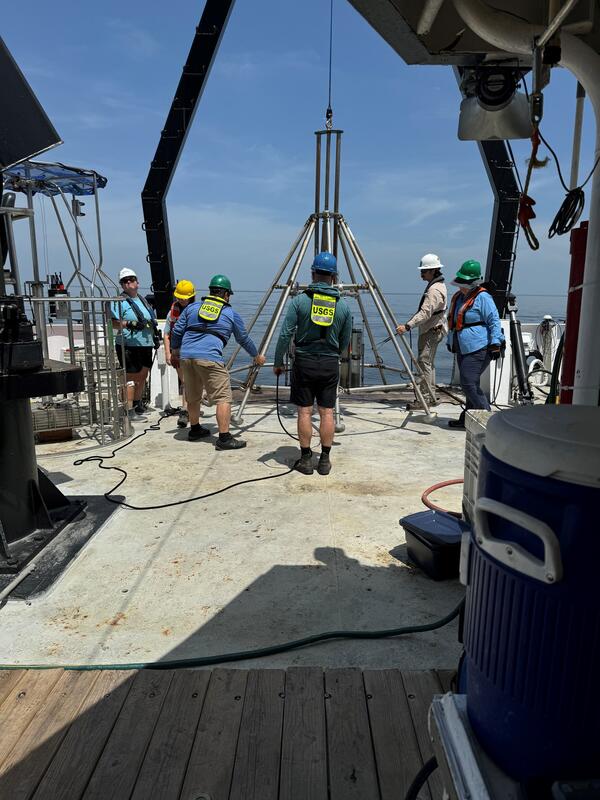
MFDF Coring
The USGS has a long history of studying seafloor instability in the Mississippi River Delta Front, beginning in the 1970s.
As part of the OASIS project, we play a leading role in seafloor mapping, geophysical imaging, and interpreting the processes that shape this important region.
The USGS has a long history of studying seafloor instability in the Mississippi River Delta Front, beginning in the 1970s.
As part of the OASIS project, we play a leading role in seafloor mapping, geophysical imaging, and interpreting the processes that shape this important region.
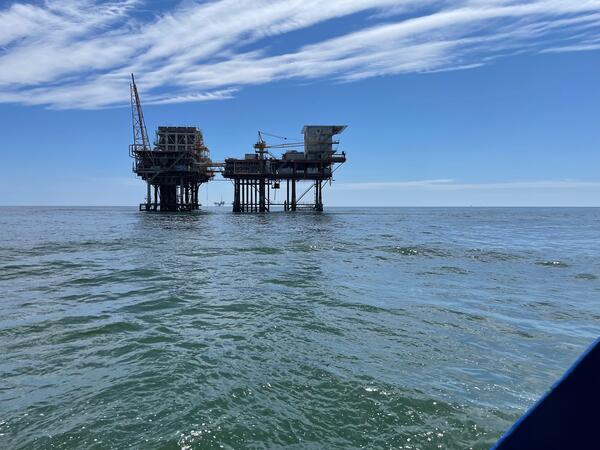
MRDF Offshore Infrastructure
Offshore infrastructure in the Mississippi River Delta Front.
Offshore infrastructure in the Mississippi River Delta Front.
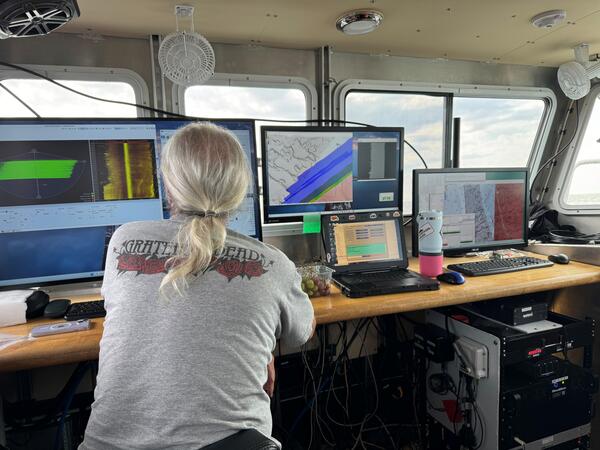
MRDF Geophysical Survey
The USGS has a long history of studying seafloor instability in the Mississippi River Delta Front, beginning in the 1970s.
As part of the OASIS project, we play a leading role in seafloor mapping, geophysical imaging, and interpreting the processes that shape this important region.
The USGS has a long history of studying seafloor instability in the Mississippi River Delta Front, beginning in the 1970s.
As part of the OASIS project, we play a leading role in seafloor mapping, geophysical imaging, and interpreting the processes that shape this important region.
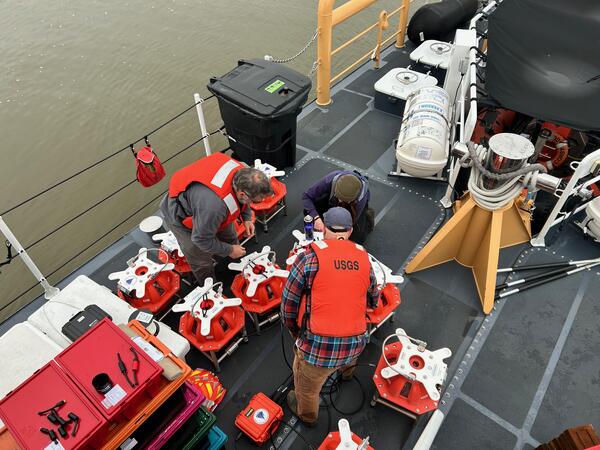
Rapid Response OBS - Mendocino
Wayne Baldwin (USGS), Eric Moore (USGS), and Hannah Brewer (Woods Hole Oceanographic Institution) preparing the rapid response ocean bottom seismograph fleet for deployment. Photo credit: Nathan Miller, USGS Woods Hole Coastal and Marine Science Center.
Wayne Baldwin (USGS), Eric Moore (USGS), and Hannah Brewer (Woods Hole Oceanographic Institution) preparing the rapid response ocean bottom seismograph fleet for deployment. Photo credit: Nathan Miller, USGS Woods Hole Coastal and Marine Science Center.
Rapid Response OBS - Mendocino
Wayne Baldwin (USGS), Eric Moore (USGS), and Hannah Brewer (Woods Hole Oceanographic Institution) preparing the rapid response ocean bottom seismograph fleet for deployment. Photo credit: Nathan Miller, USGS Woods Hole Coastal and Marine Science Center.
Wayne Baldwin (USGS), Eric Moore (USGS), and Hannah Brewer (Woods Hole Oceanographic Institution) preparing the rapid response ocean bottom seismograph fleet for deployment. Photo credit: Nathan Miller, USGS Woods Hole Coastal and Marine Science Center.
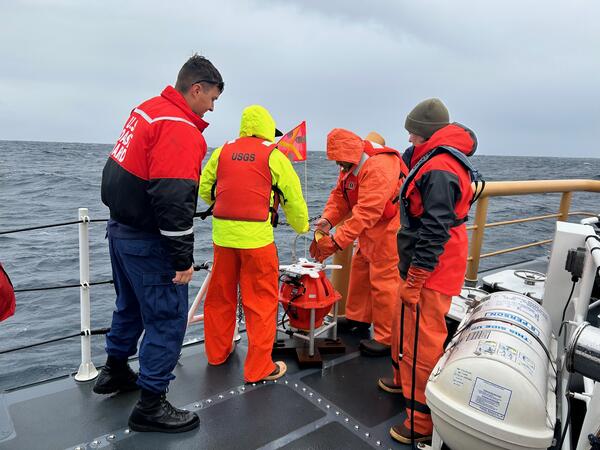
Rapid Response OBS - Mendocino
Wayne Baldwin (USGS), Eric Moore (USGS), and Hannah Brewer (Woods Hole Oceanographic Institution) about to deploy one of the rapid response ocean bottom seismograph fleet. Photo credit: Nathan Miller, USGS Woods Hole Coastal and Marine Science Center.
Wayne Baldwin (USGS), Eric Moore (USGS), and Hannah Brewer (Woods Hole Oceanographic Institution) about to deploy one of the rapid response ocean bottom seismograph fleet. Photo credit: Nathan Miller, USGS Woods Hole Coastal and Marine Science Center.
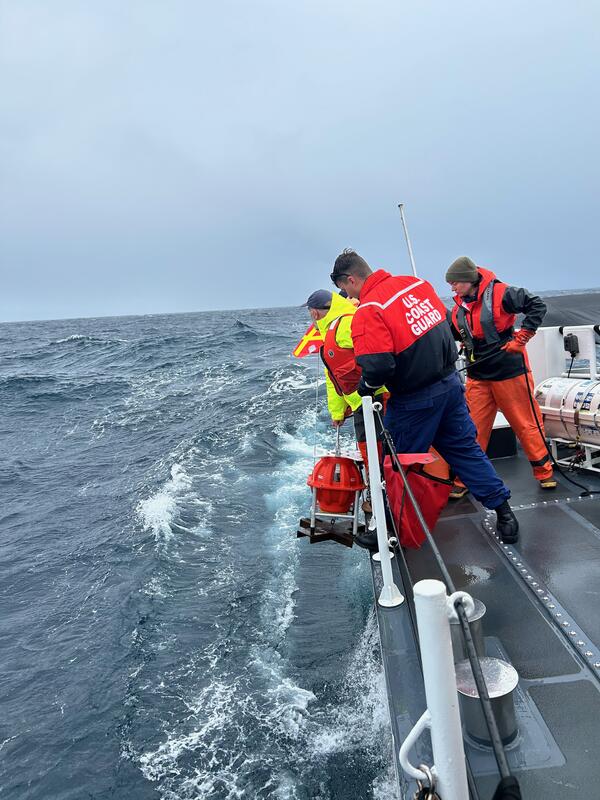
Rapid Response OBS - Mendocino
Eric Moore (USGS) deploying one of the rapid response ocean bottom seismographs. Photo credit: Nathan Miller, USGS Woods Hole Coastal and Marine Science Center.
Eric Moore (USGS) deploying one of the rapid response ocean bottom seismographs. Photo credit: Nathan Miller, USGS Woods Hole Coastal and Marine Science Center.
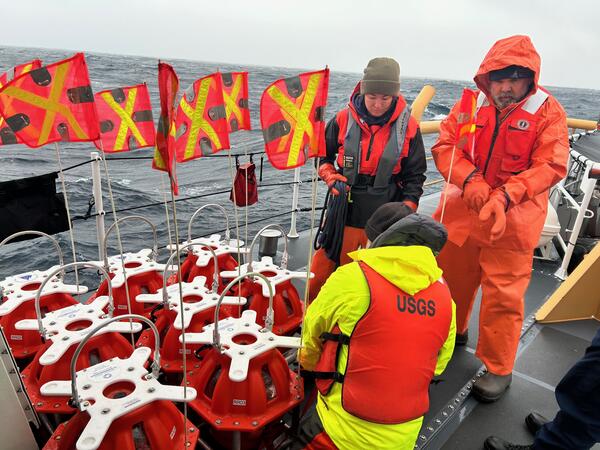
Rapid Response OBS - Mendocino
Wayne Baldwin (USGS) and Eric Moore (USGS) preparing the rapid response ocean bottom seismograph fleet for deployment. Photo credit: Nathan Miller, USGS Woods Hole Coastal and Marine Science Center.
Wayne Baldwin (USGS) and Eric Moore (USGS) preparing the rapid response ocean bottom seismograph fleet for deployment. Photo credit: Nathan Miller, USGS Woods Hole Coastal and Marine Science Center.
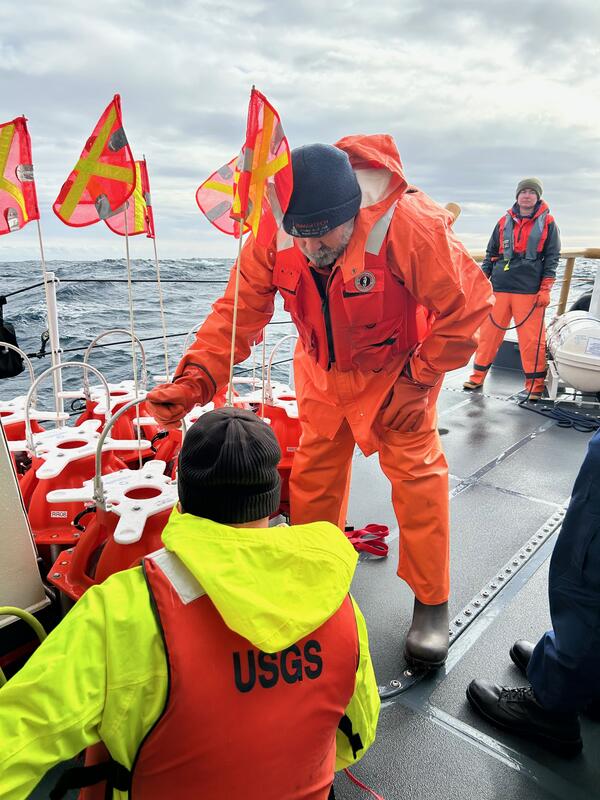
Rapid Response OBS - Mendocino
Wayne Baldwin (USGS) and Eric Moore (USGS) preparing the rapid response ocean bottom seismograph fleet for deployment. Photo credit: Nathan Miller, USGS Woods Hole Coastal and Marine Science Center.
Wayne Baldwin (USGS) and Eric Moore (USGS) preparing the rapid response ocean bottom seismograph fleet for deployment. Photo credit: Nathan Miller, USGS Woods Hole Coastal and Marine Science Center.
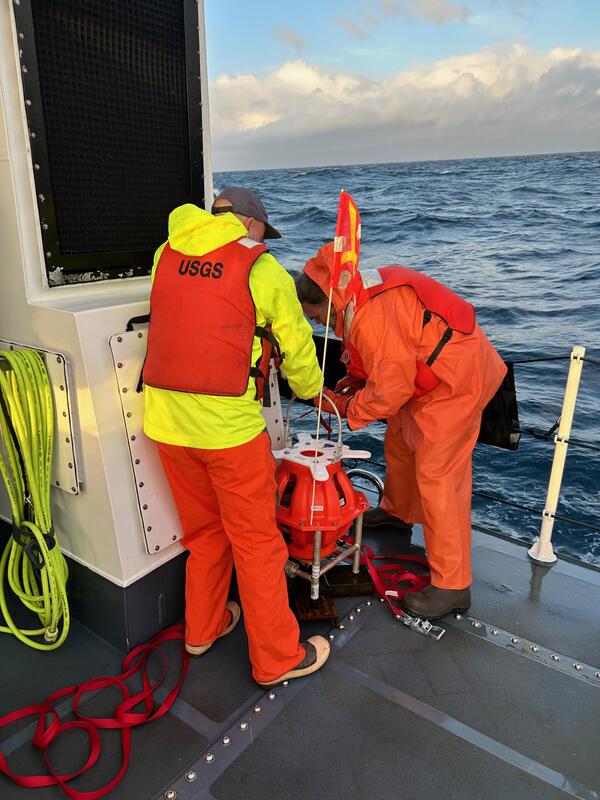
Rapid Response OBS - Mendocino
Wayne Baldwin (USGS) and Eric Moore (USGS) preparing the rapid response ocean bottom seismograph fleet for deployment. Photo credit: Nathan Miller, USGS Woods Hole Coastal and Marine Science Center.
Wayne Baldwin (USGS) and Eric Moore (USGS) preparing the rapid response ocean bottom seismograph fleet for deployment. Photo credit: Nathan Miller, USGS Woods Hole Coastal and Marine Science Center.
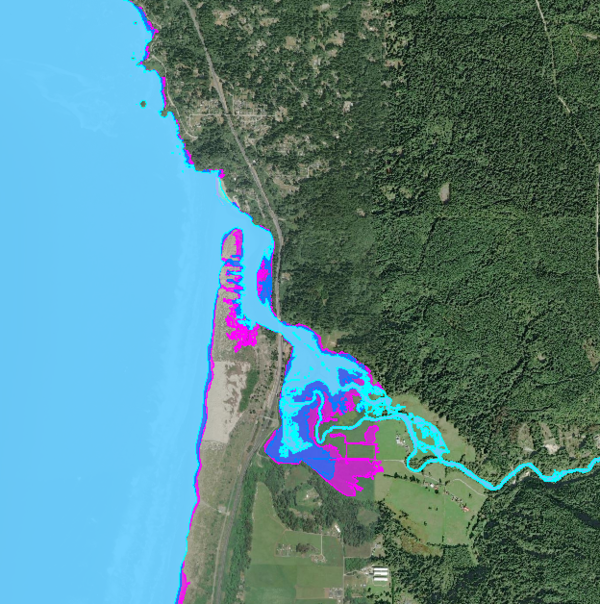
CoSMoS flood extent map
Example CoSMoS flood extent map products for the Humboldt County region, showing a 100-year storm across three sea-level rise scenarios.
Example CoSMoS flood extent map products for the Humboldt County region, showing a 100-year storm across three sea-level rise scenarios.
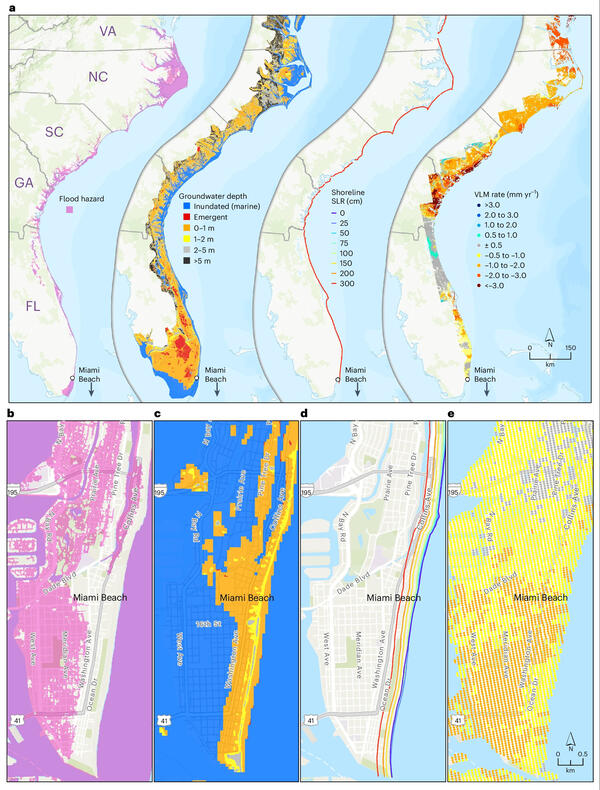
Coastal hazard exposure across SE Atlantic coast of US
Coastal hazard exposure across SE Atlantic coast of USFigure a) Coastal flooding (no storm), shallow groundwater exposure and erosion (unimpeded model case) for 1.00 m of SLR (that is, the Intermediate scenario projected for 210014), and observed vertical land motion (VLM) across the Southeast Atlantic coast.
Coastal hazard exposure across SE Atlantic coast of US
Coastal hazard exposure across SE Atlantic coast of USFigure a) Coastal flooding (no storm), shallow groundwater exposure and erosion (unimpeded model case) for 1.00 m of SLR (that is, the Intermediate scenario projected for 210014), and observed vertical land motion (VLM) across the Southeast Atlantic coast.

NOPP Hurricane Coastal Impacts Geonarrative
As powerful hurricanes approach the coast, they generate elevated water levels and dangerous wave conditions that can cause extensive flooding, significant landscape changes, and destruction of property.
As powerful hurricanes approach the coast, they generate elevated water levels and dangerous wave conditions that can cause extensive flooding, significant landscape changes, and destruction of property.