
Maps showing the results of the Coastal Change Likelihood (CCL) for Long Beach, CT (top), and for Whitehall Beach, NY (bottom).
Images
Coastal and Marine Hazards and Resources Program images.
Filter Total Items: 2415
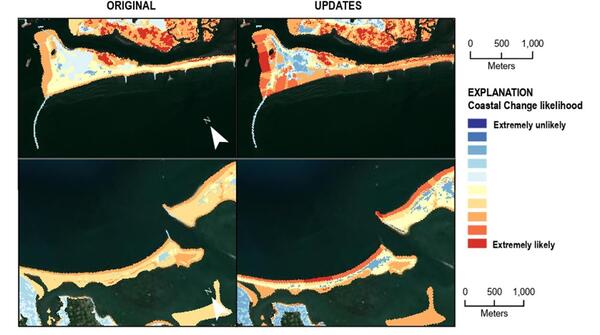
CCL for Long Beach and Whitehall Beach
Maps showing the results of the Coastal Change Likelihood (CCL) for Long Beach, CT (top), and for Whitehall Beach, NY (bottom).
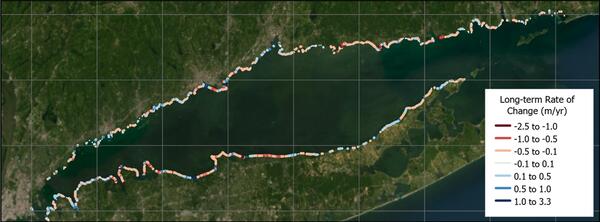
Long-Term Shoreline Change for Long Island Sound
Map showing long-term shoreline change rate variations for coastal Long Island Sound.
Map showing long-term shoreline change rate variations for coastal Long Island Sound.
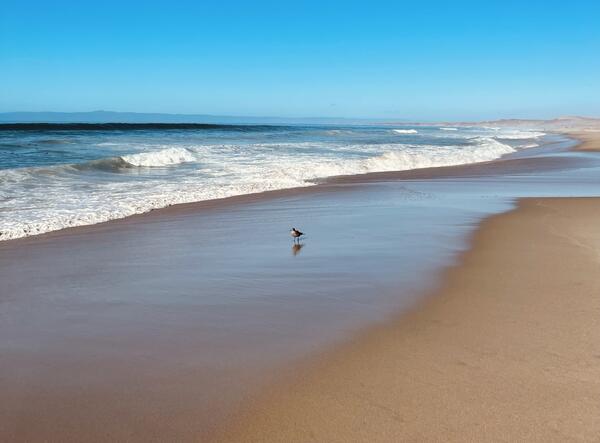
Sandy Shoreline
Sandy shoreline with bird on the wet sand.
Sandy shoreline with bird on the wet sand.
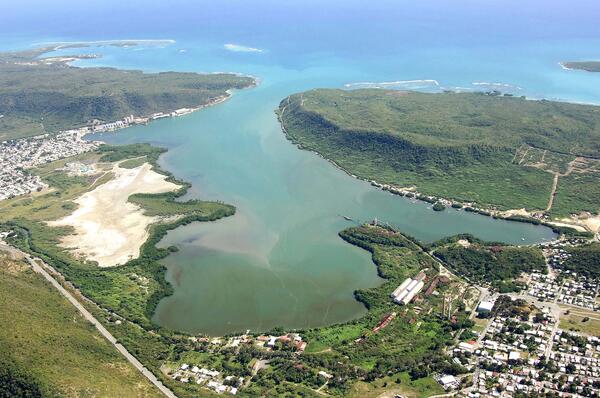
Aerial image of Bahia de Guanica in Puerto Rico
Aerial image of Bahia de Guanica in Puerto Rico.
Aerial image of Bahia de Guanica in Puerto Rico.
Box core sample containing polymetallic nodules from American Samoa, 2026
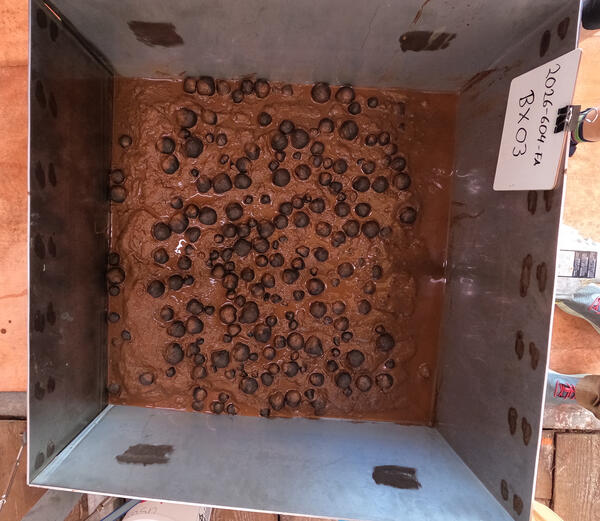
Box core sample containing polymetallic nodules from American Samoa, 2026Box core sample containing polymetallic nodules from American Samoa, 2026, from the American Samoa Mapping Project.
Box core sample containing polymetallic nodules from American Samoa, 2026
Box core sample containing polymetallic nodules from American Samoa, 2026Box core sample containing polymetallic nodules from American Samoa, 2026, from the American Samoa Mapping Project.
Map depicting Valle De Lajas and Río Loco drainage, Puerto Rico
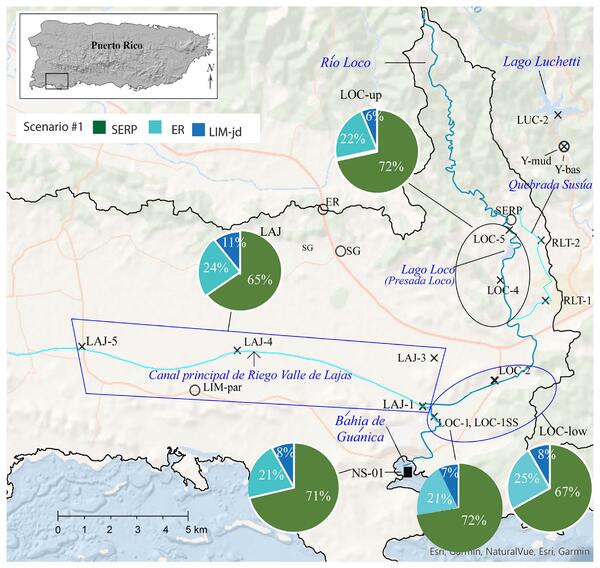
Map depicting Valle De Lajas and Río Loco drainage, Puerto RicoMap depicting Valle De Lajas and Río Loco drainage, the westernmost zone of the study area. Pie charts summarizing Sr isotope mixing model results. River sediment sample locations are represented by an X, bedrock sampling locations by open circles. An infilled black rectangle shows Bahía de Guánica sediment sampling location (NS-01).
Map depicting Valle De Lajas and Río Loco drainage, Puerto Rico
Map depicting Valle De Lajas and Río Loco drainage, Puerto RicoMap depicting Valle De Lajas and Río Loco drainage, the westernmost zone of the study area. Pie charts summarizing Sr isotope mixing model results. River sediment sample locations are represented by an X, bedrock sampling locations by open circles. An infilled black rectangle shows Bahía de Guánica sediment sampling location (NS-01).
Modeled barrier island behavior, drowning time, and net shoreline change
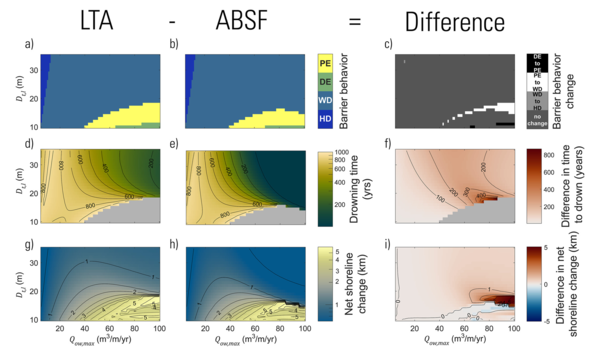
Modeled barrier island behavior, drowning time, and net shoreline changeBarrier behavior, drowning time, and net shoreline change for a range of overwash flux and lower shoreface toe depths modeled by the LTA and ABSF.
Modeled barrier island behavior, drowning time, and net shoreline change
Modeled barrier island behavior, drowning time, and net shoreline changeBarrier behavior, drowning time, and net shoreline change for a range of overwash flux and lower shoreface toe depths modeled by the LTA and ABSF.
Coastal Response Likelihood Workflow
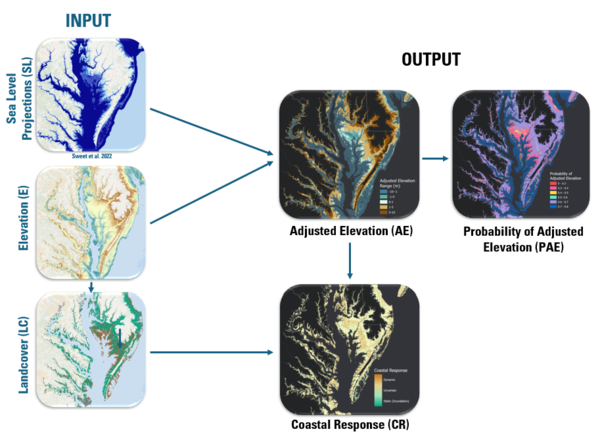
Conceptual diagram showing the structure of the Bayesian network used to assess potential sea-level rise impacts on the coastal landscape.
Conceptual diagram showing the structure of the Bayesian network used to assess potential sea-level rise impacts on the coastal landscape.
Coastal Response
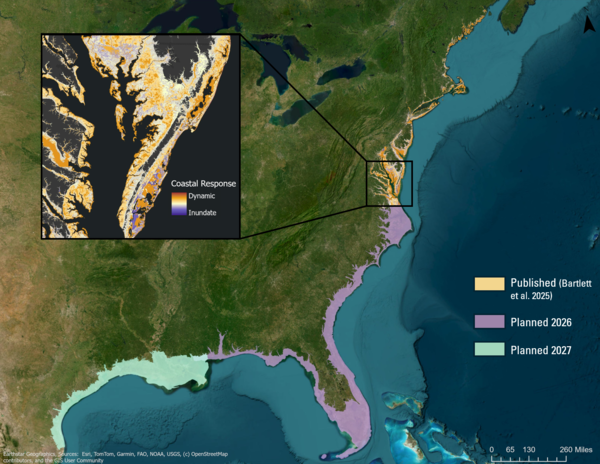
Geographic extent of Coastal Response data layers by publication timeline. Results for the Northeast U.S. are available as of 2025 (inset). Data for the Southeast Atlantic and eastern Gulf of Mexico are anticipated in mid-2026, with expansion to the western Gulf planned for 2027.
Geographic extent of Coastal Response data layers by publication timeline. Results for the Northeast U.S. are available as of 2025 (inset). Data for the Southeast Atlantic and eastern Gulf of Mexico are anticipated in mid-2026, with expansion to the western Gulf planned for 2027.
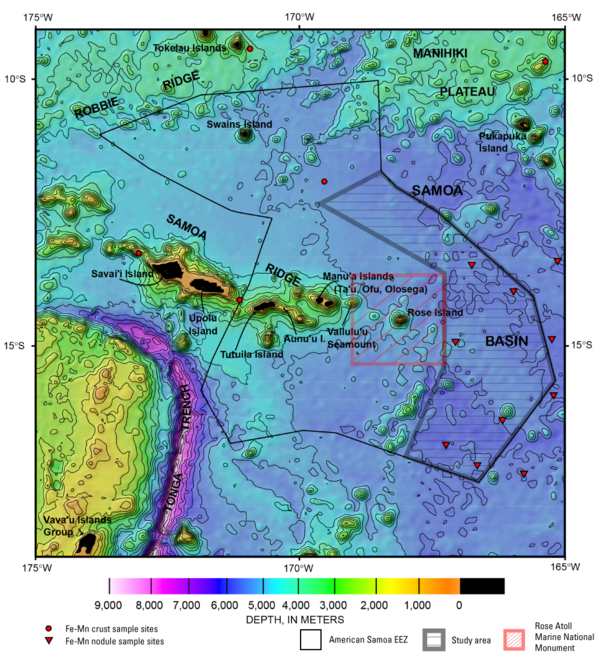
Map of American Samoa and study area
Map of American Samoa and study area of the American Samoa Mapping Project.
Map of American Samoa and study area of the American Samoa Mapping Project.
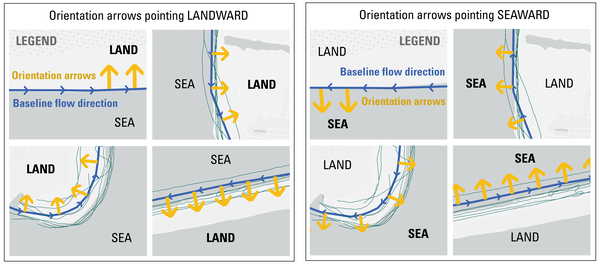
DSAS Landward vs Seaward
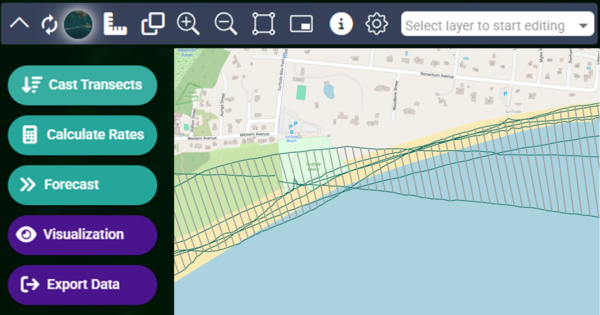
The Digital Shoreline Analysis System (DSAS) version 6 is a standalone application that calculates shoreline or boundary change over time. The GIS of a user’s choice is used to prepare the data for DSAS. Like previous versions, DSAS v.6 enables a user to calculate rate-of-change statistics from multiple historical shoreline positions.
The Digital Shoreline Analysis System (DSAS) version 6 is a standalone application that calculates shoreline or boundary change over time. The GIS of a user’s choice is used to prepare the data for DSAS. Like previous versions, DSAS v.6 enables a user to calculate rate-of-change statistics from multiple historical shoreline positions.
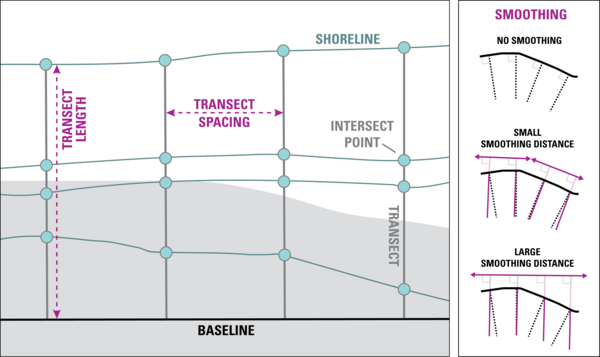
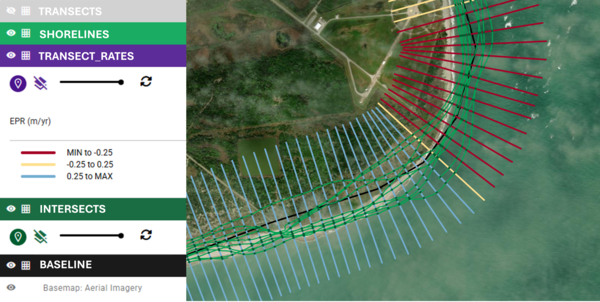
DSAS Elements
DSAS generates transects that are cast perpendicular to the reference baseline to intersect shorelines at a user-specified spacing alongshore.
DSAS generates transects that are cast perpendicular to the reference baseline to intersect shorelines at a user-specified spacing alongshore.
DSAS Software
The Digital Shoreline Analysis System (DSAS) version 6 is a standalone application that calculates shoreline or boundary change over time. The GIS of a user’s choice is used to prepare the data for DSAS. Like previous versions, DSAS v.6 enables a user to calculate rate-of-change statistics from multiple historical shoreline positions.
The Digital Shoreline Analysis System (DSAS) version 6 is a standalone application that calculates shoreline or boundary change over time. The GIS of a user’s choice is used to prepare the data for DSAS. Like previous versions, DSAS v.6 enables a user to calculate rate-of-change statistics from multiple historical shoreline positions.
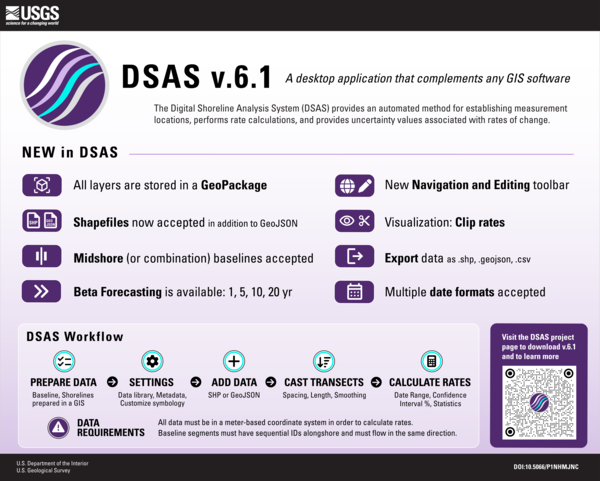
DSAS v6.1 Infographic
The Digital Shoreline Analysis System (DSAS) version 6 is a standalone application that calculates shoreline or boundary change over time. The GIS of a user’s choice is used to prepare the data for DSAS. Like previous versions, DSAS v.6 enables a user to calculate rate-of-change statistics from multiple historical shoreline positions.
The Digital Shoreline Analysis System (DSAS) version 6 is a standalone application that calculates shoreline or boundary change over time. The GIS of a user’s choice is used to prepare the data for DSAS. Like previous versions, DSAS v.6 enables a user to calculate rate-of-change statistics from multiple historical shoreline positions.
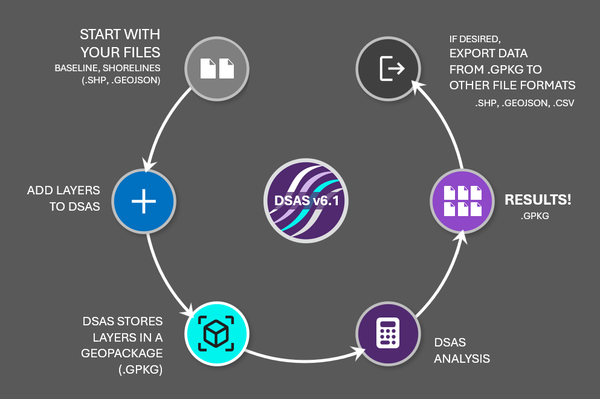
DSAS Sample Data
The Digital Shoreline Analysis System (DSAS) version 6 is a standalone application that calculates shoreline or boundary change over time. The GIS of a user’s choice is used to prepare the data for DSAS. Like previous versions, DSAS v.6 enables a user to calculate rate-of-change statistics from multiple historical shoreline positions.
The Digital Shoreline Analysis System (DSAS) version 6 is a standalone application that calculates shoreline or boundary change over time. The GIS of a user’s choice is used to prepare the data for DSAS. Like previous versions, DSAS v.6 enables a user to calculate rate-of-change statistics from multiple historical shoreline positions.
DSAS step by step
The Digital Shoreline Analysis System (DSAS) version 6 is a standalone application that calculates shoreline or boundary change over time. The GIS of a user’s choice is used to prepare the data for DSAS. Like previous versions, DSAS v.6 enables a user to calculate rate-of-change statistics from multiple historical shoreline positions.
The Digital Shoreline Analysis System (DSAS) version 6 is a standalone application that calculates shoreline or boundary change over time. The GIS of a user’s choice is used to prepare the data for DSAS. Like previous versions, DSAS v.6 enables a user to calculate rate-of-change statistics from multiple historical shoreline positions.
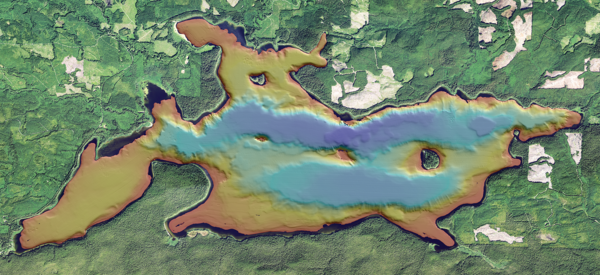
Bathymetric map of Ozette Lake in Washington State
Bathymetric map of Ozette Lake in Washington StateBathymetric map of Ozette Lake in Washington State. Cover image for the Ozette Lake Paleoseismology video.
Bathymetric map of Ozette Lake in Washington State
Bathymetric map of Ozette Lake in Washington StateBathymetric map of Ozette Lake in Washington State. Cover image for the Ozette Lake Paleoseismology video.
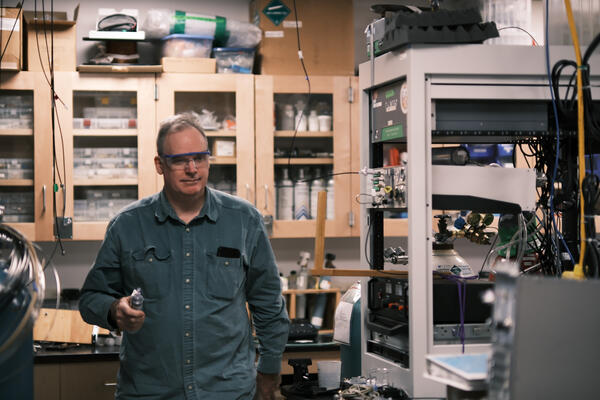
Testing DSIM
Testing a USGS patented device (DSIM) and measuring it's performance with a new analytical upgrade recently designed and installed. The DSIM allows for gas samples to be put into a spectrometer and measured in a closed loop, which increased the data signal fidelity, repeatability, and amount an analyte used.
Testing a USGS patented device (DSIM) and measuring it's performance with a new analytical upgrade recently designed and installed. The DSIM allows for gas samples to be put into a spectrometer and measured in a closed loop, which increased the data signal fidelity, repeatability, and amount an analyte used.
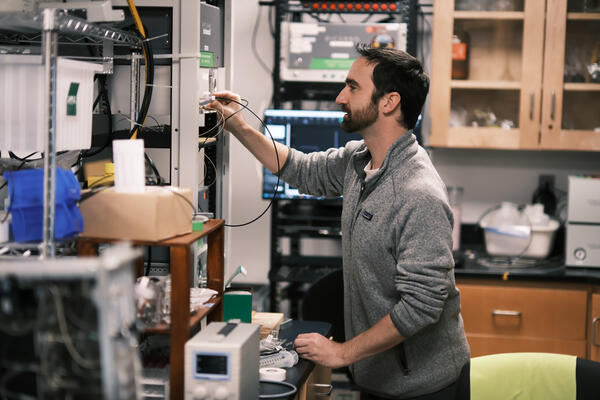
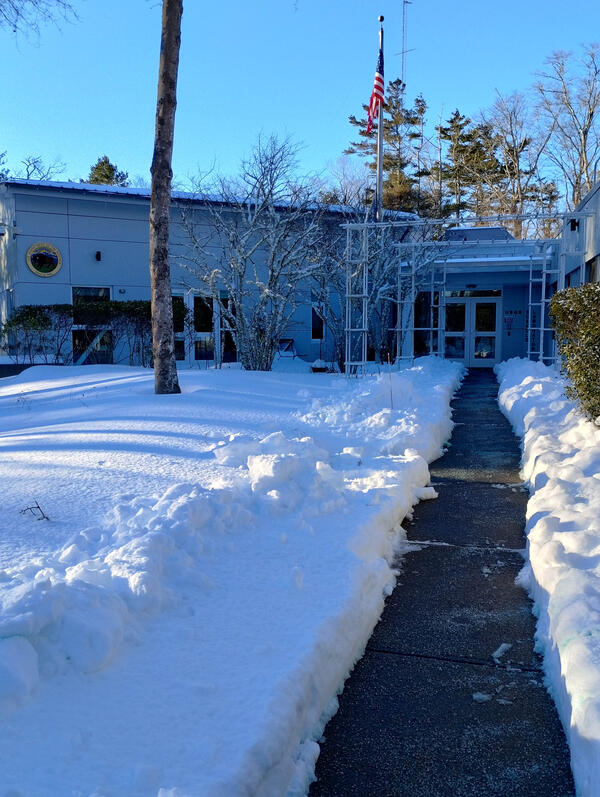
Snow Day
A snow covered science center in Woods Hole, Massachusetts after a powerful nor'easter hit the Cape Cod on January 25, 2026.
A snow covered science center in Woods Hole, Massachusetts after a powerful nor'easter hit the Cape Cod on January 25, 2026.
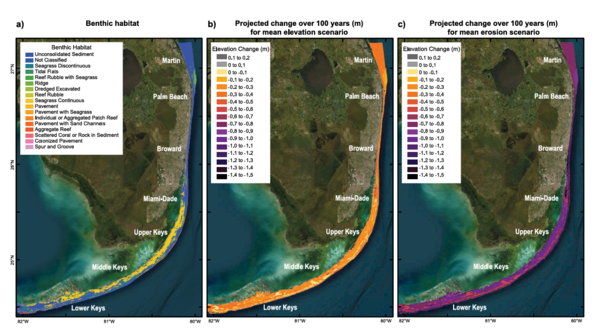
Maps showing FL coral reef degradation
Maps showing FL coral reef degradation, from the study Coral Reef Protection May Help Avert Risks to People, Property, and Economic Activity Caused by Projected Reef Degradation.
Maps showing FL coral reef degradation, from the study Coral Reef Protection May Help Avert Risks to People, Property, and Economic Activity Caused by Projected Reef Degradation.