
Approaching Storms
Discover USGS tools that forecast storms and report coastal conditions for emergency management
The USGS Coastal and Marine Hazards and Resources Program has various products that report near real-time coastal conditions and forecast an active storm’s path, intensity, and associated coastal change hazards. These tools provide local officials and emergency managers with the scientific information they need to help make life-saving decisions before a storm makes landfall.
Supporting Storm Preparedness
The USGS studies the dynamics of coastal and marine processes. This research helps us better understand how storms could change coastal landscapes and impact coastal communities.
Our science-based products provide information on real-time coastal and ocean conditions (i.e., wave height and water level), as well as predicted impacts to the coast (i.e., flooding, erosion, and overwash). USGS science supports emergency management decision making for an approaching storm at the local and regional levels by providing knowledge, data, and tools to stakeholders. These products can also provide assistance in rapid response and recovery by informing decision makers of vulnerable locations within their management area, the expected degree of damage, and the duration of hazardous conditions.


Products for Emergency Management Decision Making
Coastal Change Hazards Portal
The Coastal Change Hazards Portal is an interactive map with links to published datasets and layers organized within three coastal change hazard themes: extreme storms, shoreline change, and sea-level rise. During active storms, users can access real-time predictions of storm path, intensity, and coastal change. This tool integrates several USGS products, including data from COAWST.
Regional Coverage: Alaska, East Coast, Great Lakes, Gulf of America, and Atlantic territories.
“The Coastal Change Hazards Portal provides forecasts of potential coastal change when storms threaten our beaches and can also provide information for planning purposes on hurricane and storm scenarios and long-term planning and sea level rise.” – Kara Doran, USGS Supervisory Physical Scientist


Specific Features for Emergency Management
During active storms you can access:
- The probability of storm-induced collision, overwash, and inundation.
- Existing dune crest and dune toe elevation.
- Storm-induced average and extreme water levels at the shoreline.
- The latest Tropical Cyclone Forecast from the National Weather Service National Hurricane Center, updated hourly.
- COAWST model predicted maximum wave height and water level (tide and surge) that may occur over the next 5 days.
- The projected path and intensity of an approaching hurricane or tropical storm.
Emergency managers can use the Coastal Change Hazard Portal to better understand storm path and potential coastal change hazards, as well as prepare for dune erosion under different hurricane category scenarios. Additionally, by accessing historical shoreline and marsh vulnerability data, users can identify chronically impacted areas and plan accordingly.
A unique feature in the Coastal Change Hazards Portal is the data bucket. As you find datasets of interest via the tool, you can add datasets to your bucket (think of it like a shopping cart) to create a customized map. When you are done, you will be redirected to the data from USGS data release sites for download. Users can also generate a link for sharing their customized map with colleagues, friends, or on social media.
Use Case:
In Puerto Rico, community leaders used the Coastal Change Hazard Portal to prepare for an approaching storm by using the Category 1 hurricane scenario to identify areas of the coast that were more vulnerable to flooding and erosion.
Future Plans:
- USGS scientists are examining the possibility of integrating more climate-based variables into the tool outputs. It is also being targeted for translation into Spanish.
Contacts:
- Coastal Change Hazards Portal team, cch_help@usgs.gov

Coastal Storm Modeling System (CoSMoS) and Hazard Exposure Reporting and Analytics (HERA) web tool
The Coastal Storm Modeling System (CoSMoS) makes detailed projections of coastal hazards resulting from both future sea-level rise and changing storms. The Hazard Exposure Reporting and Analytics (HERA) web tool provides access to map-based visualizations of the CoSMoS hazard products and interactive summaries of potential community exposure risk. Although the primary application for these products is for long-term planning and coastal adaptation, the flood hazard projections can be used to inform emergency preparedness during an approaching storm on the U.S. West Coast, Pacific Islands, and Southeast Atlantic.
Regional Coverage: California, Hawai'i and the Pacific Island Territories, and the Southeast Atlantic.


Specific Functions for Emergency Management
- CoSMoS/HERA provides pre-run flood hazard scenarios of future climate conditions primarily to support long-range planning.
- Use the annual, 20-year and 100-year storm scenarios with no sea-level rise to determine potential coastal flood impacts, including storm surge and wave-driven water levels.
- Flood hazard map products display locations that may be at risk of coastal flooding.
Due to the narrower or non-existent continental shelf, wave-driven flooding is a much more significant contributor to coastal storm flooding on the U.S. West Coast and Pacific Islands compared to the storm-surge dominated dynamics of the U.S. East and Gulf Coasts. Most real-time weather forecast flood models, which have been developed for hurricane predictions in the Atlantic, do not account for wave-driven flooding. In the absence of better information, the CoSMoS annual, 20-year and 100-year storm scenarios with zero sea-level rise can be used to provide emergency managers with an indication of the potential for storm-driven flood impacts. This information can help inform decisions regarding community evacuations or where to stage equipment that may be necessary for post-storm cleanup and recovery.
Use Case:
In May 2023 as Super Typhoon Mawar was approaching the U.S. Territory of Guam as a Category 4 storm, the USGS Storm Team and U.S. Department of the Interior command center at the Hawai’i Emergency Management Center were activated, as well as the Guam Office of Civil Defense. Available flood forecast models for the region did not include wave-driven flood factors, drastically underpredicting the potential extent of flooding. In the Pacific, Category 4 storms are roughly equivalent to a 20- to 35-year return interval storm event. The CoSMoS team provided an emergency release of data for the 20-year and 100-year storm scenarios with no sea-level rise. Although these scenarios were not forecasting the actual Typhoon Mawar conditions, they provided more accurate bookends for the location and extent of possible wave-driven flooding. Emergency managers evacuated low-lying coastal areas that were the most at-risk and prepared those same areas for more focused post-storm recovery operations.
Future Plans:
- As part of the National Oceanographic Partnership Program (NOPP) Hurricane Coastal Impacts project, the underlying CoSMoS flood modeling framework is being modified and tested to produce research-grade forecasts of coastal flooding based on real-time information for in-bound hurricanes impacting the Eastern U.S. and Gulf of America.
- A version of the CoSMoS modeling system is being developed and tested for real-time operational flood forecasting of hurricanes in the Gulf and Southeast Atlantic.
- Led by partners from Deltares, the team has made coastal impact forecasts during the hurricane seasons of 2022-2024, with results available in an online viewer and described in an ArcGIS Storymap.
Contacts:
- Maya Hayden, mkhayden@usgs.gov
- Nathan J. Wood, nwood@usgs.gov

COAWST Modeling System
The Coupled Ocean-Atmosphere-Wave-Sediment Transport (COAWST) modeling system is a tool that predicts many aspects of storm dynamics. The coupled modeling system can simultaneously run several, individual models representing the ocean, atmosphere, waves, sediment transport, hydrology, and sea ice. By creating a system that allows these various models to feed back to one another, storm simulations depict a more realistic suite of physical processes such as water level, wave heights, and the vertical structure of the ocean temperature, salinity, and currents that contribute to storm development and hazards to coastal communities.
Regional Coverage: East Coast and the Gulf of America.
“The advantages of using a coupled system have become apparent because the Earth is controlled by interconnected systems. Forecast modelers have realized that hurricane predictions were more accurate when feedback from the ocean and waves was included. Coastal zone predictions of surge and erosion will be improved by using full ocean simulations rather than simplified physics.” – John Warner, USGS research oceanographer


Specific Features for Emergency Management:
- In the Daily Forecast geonarrative, the COAWST modeling system provides daily maximum forecasts of water level, wave height, sea surface temperature, and suspended sediment concentrations. Updated daily at 6:00AM eastern time.
- In the Coastal Change Hazards Portal, the COAWST model predicts maximum wave heights and water level (tide and storm surge) that may occur over the next 5 days for an active storm.
- Forecasts based on daily updated, hourly records since 2010.
The COAWST modeling system provides valuable data to better help scientists and communities fully understand dynamic storm impacts. Emergency managers can use COAWST 5-day forecasts in preparation for an approaching storm. COAWST can be used to improve hazard assessments and make decisions regarding safety and risk reduction, including what areas may need to be evacuated.
Use Case:
State and Local partners: As part of the National Oceanographic Partnership Program (NOPP), USGS forecasted Hurricane Ian as it approached landfall using the COAWST modeling system. Maps of forecast maximum water levels and wave heights were updated daily and distributed to State and local emergency planning authorities.
Contacts:
- John Warner, jcwarner@usgs.gov
- Zafer Defne, zdefne@usgs.gov

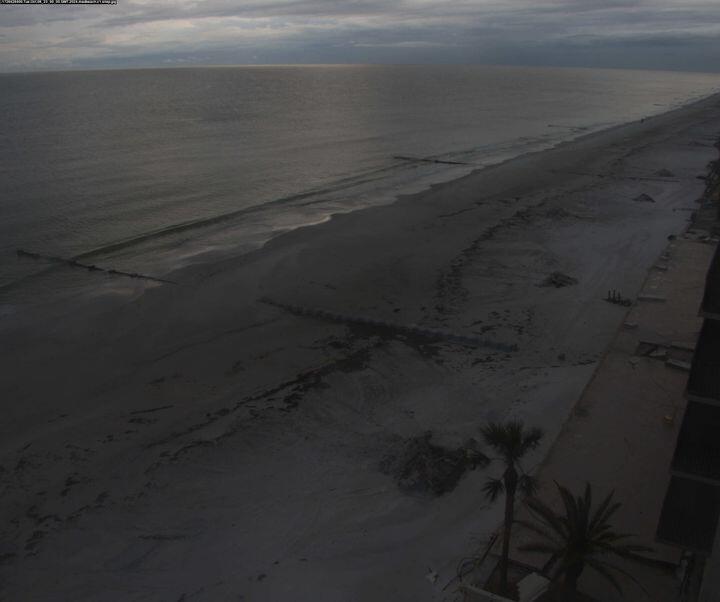
CoastCams
The CoastCams web page gives users access to a network of cameras that provide near real-time snapshots of coastal conditions during daylight hours. Images are collected multiple times per second for 10-30 minutes every 30-60 minutes. In addition to snapshots, several analysis products are available using time-exposure. Through the USGS Hydrologic Imagery Visualization and Information System (HIVIS) interface, some cameras also have timelapse of the most recent 48-72 hours.
Regional Coverage: Alaska, California, Florida, Massachusetts, and Puerto Rico.

Specific Features for Emergency Management
- Provides situational awareness of event impacts and conditions along the coast.
- New images available every 30-60 minutes during daylight hours.
- Concurrent wave buoy data available at some camera sites.
- Recorded images can provide visual analysis of prior events.
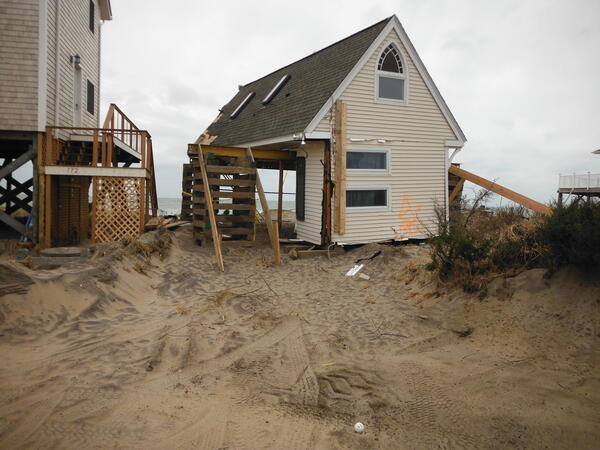
- Pre-event evaluation of beach condition (are the dunes/beachface eroded or intact) to assess the potential for damage to communities andstructures behind the dune
- Connects to USGS HIVIS, which provides previously captured images and displays timelapse videos of CoastCam footage.
Images taken from CoastCams are useful for observing current beach conditions and for comparing how conditions along the coast change over time. This includes, for example, tracking increasing water levels, wave runup, and wave breaking during a storm (internet, power, and cell service stability dependent), as well as monitoring the potential impacts of waves colliding with protective sand dunes. Accessing CoastCam imagery during and after an active storm can provide emergency managers with situational awareness and help determine when it is safe to visit a specific location.
Use Case:
As Hurricane Milton approached the Florida west coast, beach communities were still reeling from the severe impacts of Hurricane Helene less than two weeks prior. The camera allowed rapid assessment of the state of Madeira Beach and Sand Key. Forecasters needed this information to help predict potential impacts from Milton based on the severe damage protective beach-dune systems suffered from Helene.
Future Plans:
- Limited time research deployment of cameras may be available on CoastCams as they become active. Some permanent stations could be added in the future as well.
Contacts:
- Margaret Palmsten, mpalmsten@usgs.gov (For overall project, as well as Florida and Puerto Rico cameras)
- Daniel Nowacki, dnowacki@usgs.gov (For Alaska cameras)
- Jonathan Warrick, jwarrick@usgs.gov (For California cameras)
- Chris Sherwood, csherwood@usgs.gov (For Massachusetts cameras)

Flood Event Viewer
The Flood Event Viewer is a map interface from which users can view near real-time storm data being collected from an active hurricane or nor’easter. This map collates data from a number of monitoring stations and compiles them into a single map for monitoring storm conditions. The data integrated into the viewer includes ocean buoys (monitoring waves), coastal cameras (monitoring real-time coastal ocean conditions), river gages (monitoring flooding and water levels), rapid deployment instruments that can monitor ocean and atmospheric conditions (waves, pressure), tide stations, and the hurricane forecast track.
Regional Coverage: East Coast, West Coast, Gulf of America, Great Lakes, Alaska, Hawai'i, Atlantic Territories, and Pacific Territories


Specific Features for Emergency Management
- Buoys provide hourly wave height and wave period data.
- Stream gages provide real-time water level and discharge rate.
- Post-event data provides downloadable storm information searchable by event, state, county, environment type, and more.
Emergency managers can use the Flood Event Viewer to gain situational awareness before, during, and after a storm. For example, wave buoys and coastal water level stations provide insight into potential hazards along the coast and allow for assessment of impacts. Also, by including graphed averages in comparison to peak conditions, users get a better idea of how much a storm’s wave heights vary from average conditions. Concurrent use of the NOAA Tropical Cyclone Forecast Track and USGS CoastCams (through the HIVIS interface) provides additional insight into storm conditions. Additionally, the Flood Event Viewer can be used for recovery, mitigation, and identifying areas of likely structure damage.
Use Case:
Data from a barometric pressure gage in the Flood Event Viewer was used by the National Hurricane Center to upgrade Hurricane Michael to a category 5 hurricane.
Contacts:
- Athena Clark, aclark@usgs.gov

Total Water Level and Coastal Change Forecast Viewer
The Total Water Level and Coastal Change Forecast Viewer provides graphical representations of six-day water level forecasts along sandy shorelines, as well as any potential associated coastal change impacts, such as dune erosion, overwash, and flooding. Predicted coastal impacts are available for 3,000 miles of beach at a spacing of approximately a third of a mile between forecast points. The model on which the viewer is based accounts for tides, storm surge, and elevated water levels resulting from wave dynamics (setup and swash ). Updates of the hourly forecast happen every 6-12 hours depending on presence of an active storm event. The Total Water Level and Coastal Change Forecast Viewer was originally designed to provide information on the potential for beach erosion to the National Weather Service for inclusion in coastal hazards warnings, and has since gained a variety of other users.
Regional Coverage: East Coast and Gulf of America. Note: there is not continuous coverage along these coasts and forecasts are not available at all locations.
“This product gives you a forecast of the timing and duration of impacts to our coasts that includes not just tide and storm-surge but also waves, and how they will interface with our coastline.” – Kara Doran, USGS supervisory physical scientist


Specific Features for Emergency Management
- Identify locations with the greatest potential for damage/impacts on an interactive map.
- View six-day forecast animation of water level in relation to dunes.
- Visualize the expected timing and magnitude of water levels.
- View regional summary of the coastal change forecast.
- Provides real-time and historical forecasts.
The Total Water Level and Coastal Change Forecast Viewer shows the timing and magnitude of water levels at the shoreline and determines the potential for dune erosion, over-wash, and flooding/inundation at specific locations. The tool is especially useful before hurricanes and winter storms make landfall to raise awareness of coastal vulnerabilities. This information can also be used to help determine where to station resources for post storm recovery efforts, such as positioning bulldozers where roads may be affected by overwash.
Use Cases:
National Park Service, Eastern North Carolina
Meaghan Johnson, chief of resource management and science for National Parks of Eastern North Carolina, uses the Total Water Level and Coastal Change Forecast Viewer to predict overwash potential for a critical, single source access road (highway 12) needed for travel and transport, beach access, and preserving natural and cultural resources in the park.
Federal Emergency Management Agency (FEMA)
As Hurricane Milton approached the West Coast of Florida, FEMA used the Total Water Level and Coastal Change Forecast Viewer to identify beaches and dunes that were likely to overtop during the storm.
Future Plans:
- USGS researchers are currently expanding the forecast for use along the Nation’s 3,300+ kilometers of coral reef-fronted coasts.
- They are testing the model for potential usability along the rocky and sandy coasts of California.
- They are also experimenting with application to other features of the beach complex beyond the dune.
Contacts:
- Kara Doran, kdoran@usgs.gov
- Meg Palmsten, mpalmsten@usgs.gov
- Richard Snell, rsnell@contractor.usgs.gov

Our coastlines are home to nearly 55 million people (40% of the population), as well as important wildlife and resources. Though natural hazards are unavoidable, their impact can be reduced with proper preparedness. The science-based products developed by USGS help ensure emergency managers have the information they need to protect lives, infrastructure, and our beloved coastal landscapes.


Related

COAWST: A Coupled-Ocean-Atmosphere-Wave-Sediment Transport Modeling System

USGS CoastCams

Coastal Storm Modeling System (CoSMoS)

COAWST System Components

Coastal Change Hazards
Providing Major Storm and Short-Term Flood Event Data

Operational Total Water Level and Coastal Change Forecasts
Related
COAWST: A Coupled-Ocean-Atmosphere-Wave-Sediment Transport Modeling System
USGS CoastCams
Coastal Storm Modeling System (CoSMoS)
COAWST System Components
Coastal Change Hazards
Providing Major Storm and Short-Term Flood Event Data