
This time-lapse of Barter Island in Alaska during three summer months in 2014, shows the pack ice melting and the subsequent effects to the beach and permafrost cliffs from storms and summer temperatures. This camera sat on a fallen snow fence to capture storm events.
Eyes on the Coast—Video Cameras Help Forecast Coastal Change
By Coastal and Marine Hazards and Resources Program
November 1, 2017
Coastal communities count on beaches for recreation and for protection from large waves, but beaches are vulnerable to threats such as erosion by storms and flooding. Whether beaches grow, shrink, or even disappear depends in part on what happens just offshore. How do features like shifting sandbars affect waves, currents, and the movement of sand from the beach to offshore and back?
This article is part of the August-October 2017 issue of the Sound Waves newsletter.
If we understand these processes well enough, scientists can include them in computer models of coastal change that can be used to forecast, for example, how the shoreline will react to severe storms and how it could change over years, decades, or even centuries. Coastal communities can use these forecasts to plan for storms, sea-level rise, changes in sand supply, and other threats.
Media

Sources/Usage: Public Domain. View Media Details
Media

Sources/Usage: Public Domain. View Media Details
When a storm is on the way, it’s really powerful to be able to say: Here’s how the water and sand will move,” says Shawn Harrison, a USGS postdoctoral oceanographer.
That’s why USGS scientists have installed video cameras pointed at beaches on the coasts of western Florida and central California. They’re analyzing the videos to measure features of the beach and ocean so they can improve coastal-change forecasts.
In Santa Cruz, California, Harrison and ocean engineer Gerry Hatcher installed two video cameras on the roof of the 10-story hotel, Dream Inn. One camera looks east over Main Beach, and the other south over Cowells Beach. Starting in May 2017, the cameras recorded video of the beach and ocean for 10 minutes every half hour during daylight hours. The most recent images from the Dream Inn in Santa Cruz are available online, as well as images from Sunset State Beach in Watsonville, two locations in the Cape Cod National Seashore in Massachusetts, and Tres Palmas in Rincón, Puerto Rico.
Research oceanographers Jenna Brown and Joe Long installed a camera atop the Shoreline Island Resort in Madeira Beach, Florida. That camera has recorded video between sunrise and sunset for 17 minutes every hour since February 2017. The most recent images from Madeira Beach, Florida and also from Sand Key, Florida, are available online.
Different clues from different views
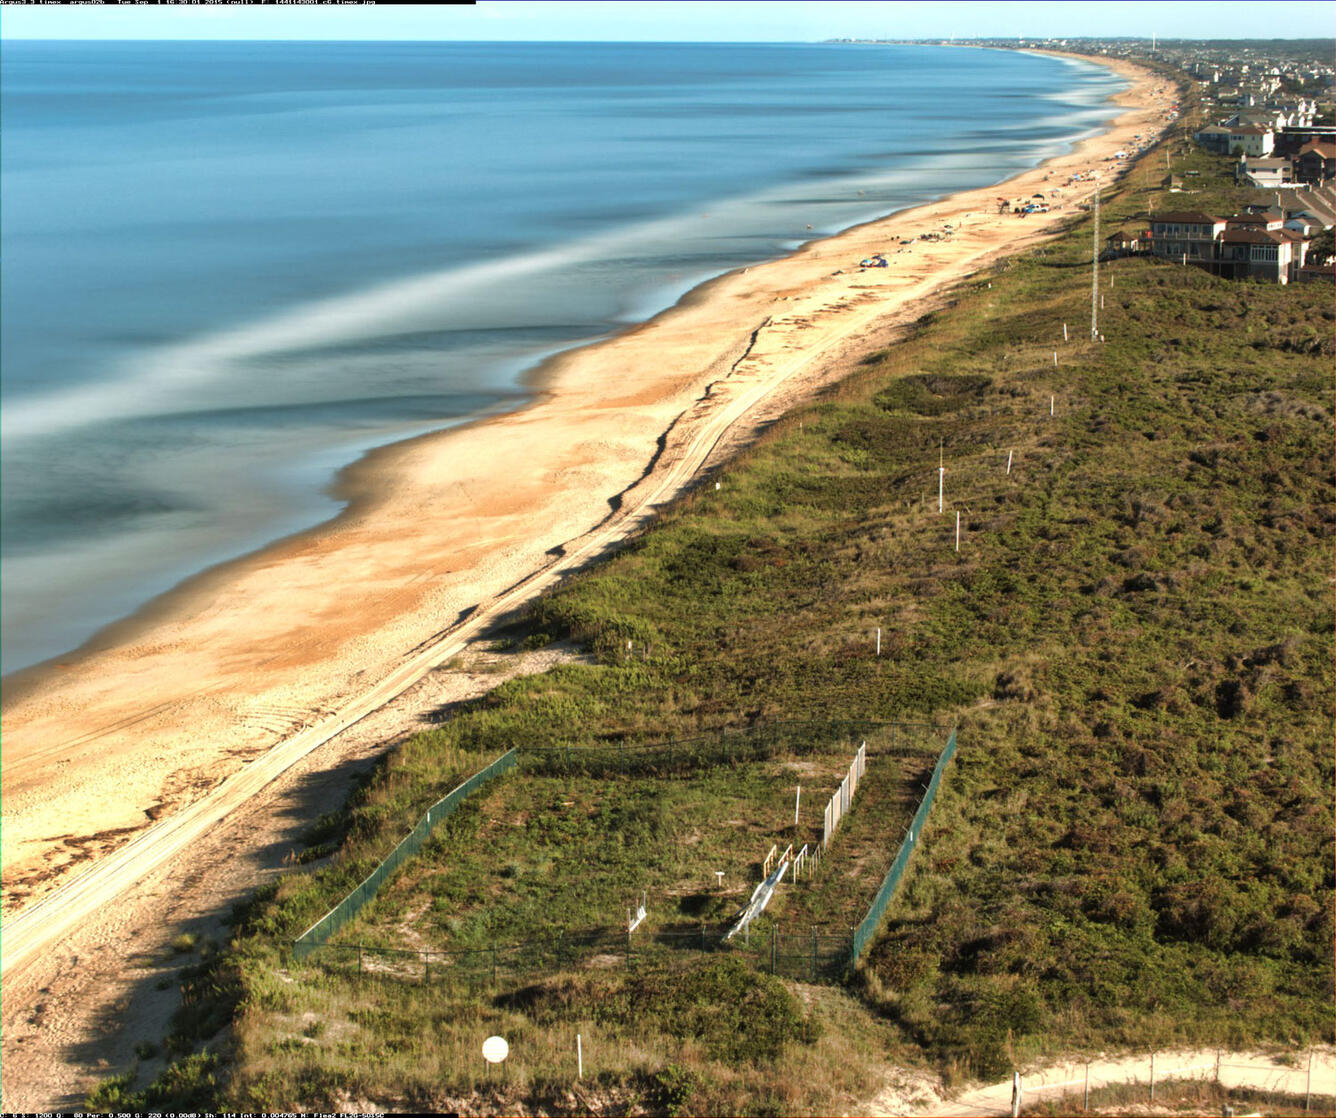
The California, Massachusetts, and Puerto Rico websites display five types of images. A “snapshot” is typically the first frame of a video—just like a still photo. A “time-averaged image” is an average of all the frames in a video. In Santa Cruz, for example, the scientists combine 1,200 frames per video. A “variance” image shows the standard deviation of pixel intensity throughout the video. And a “bright” and a “dark” image shows the brightest and darkest pixel values throughout the video, repectively. The Florida web site shows just the snapshots and time-averaged images.
A time-averaged image provides several measurements of the coast. Breaking waves produce a band of white in the time-averaged image. A sandbar is probably beneath that bright band, creating a shallow area that causes the waves to break. Dark areas extending out from the shoreline mark rip channels, formed by rip currents. Rip currents are fast, narrow, and often dangerous flows of water moving away from the shore. The line between dry beach sand and wet sand shows the maximum elevation reached by waves, or runup.
Media

Sources/Usage: Public Domain. View Media Details
Media

Sources/Usage: Public Domain. View Media Details
Media
Sources/Usage: Public Domain. View Media Details
Other image types provide even more information. “Each element in an image, called a pixel, contains color intensity, which can be used to extract information about changes along the coast,” says Brown.
Pixels as scientific instruments
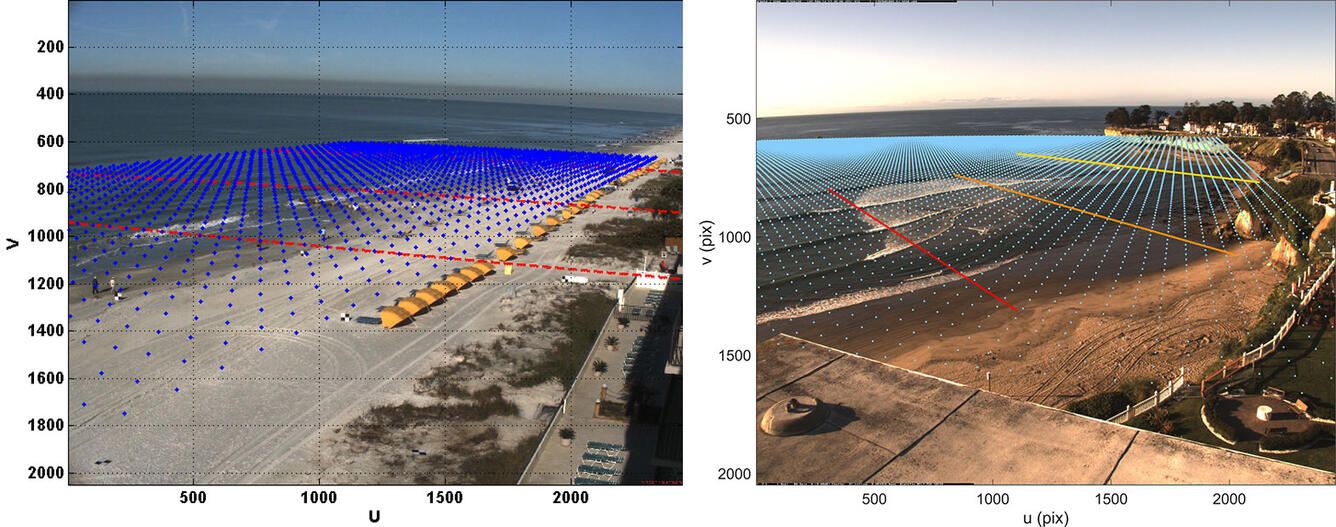
“The pixels in these videos can be used like scientific instruments,” says Harrison. “For example, we can identify an array of pixels and measure changes recorded by those pixels over time.”
Media
Sources/Usage: Public Domain. View Media Details
Media

Sources/Usage: Public Domain. View Media Details
USGS scientists use “cBathy,” a computer program which analyzes groups of pixels to detect passing waves, then estimates the water depths, or bathymetry, required to produce the observed wave speeds. Combining results from many pixel groups creates a bathymetry map of the seafloor.
Scientists have long made measurements at single points and along lines or “transects.” For example, current meters can measure ocean currents at one point, and small boats with sonar can measure water depths along multiple transects.
A video system “is not going to replace any of those [ traditional techniques],” says Harrison, “but it lets us do things that we couldn’t do otherwise.” Video cameras can collect data almost continuously over longer periods, and supply more detail over a larger area. During bad weather and high surf the cameras continue recording data, when it would be dangerous to use a boat or personal watercraft.
These camera stations are also much less expensive than traditional oceanographic equipment. “The whole [Santa Cruz] system cost less than \$5,000,” says Harrison.
Nuts and bolts
The Santa Cruz camera station includes two cameras in weatherproof cases and a computer in a separate weatherproof box. The computer is smaller than a deck of cards, costs less than a tank of gas, and uses easily replaceable parts. The whole system runs on a rechargeable battery, solar power, or a standard wall outlet.
Media

Sources/Usage: Public Domain. View Media Details
The Madeira Beach station is similar but uses a larger computer. Brown built and installed that station months before Hatcher and Harrison started, so she helped them with system design. One of her recommendations was to make a smaller, portable system to capture big storms.
“We have now built a system like ours for Jenna,” says Hatcher, so it can be deployed before a large storm or hurricane. The information will help scientists better understand the impacts of these large storms.
Harrison and Hatcher also got tips from John Stanley, a senior faculty research assistant at Oregon State University (OSU). Stanley helped develop coastal video systems as part of OSU’s Argus Program, which inspired the USGS camera stations.
How it began: Argus
Development of Argus started in the early 1980s under Rob Holman (currently OSU professor emeritus) and his team. After more than 30 years of academic research and commercial applications, in 2016 Holman released the software and shared his expertise with the public under an open source license. The international community of Argus users embraced the move, and created an online knowledge base and software repository at the Coastal Imaging Research Network (CIRN).
“In September 2016, we had an Argus users workshop,” recalls Brown, “and that’s where I met Shawn [Harrison].”
Both Brown and Harrison are CIRN members, and part of the new USGS Remote Sensing Coastal Change project. Nathaniel Plant, of the USGS Coastal and Marine Science Center in St. Petersburg, Florida, is a co-investigator. “Nathaniel Plant was one of the original Argus users [when he was a student at OSU], and he wrote a bunch of the original [software],” says Brown. “He helped me get started.”
Putting the data to work
Brown is particularly interested in how beaches respond to storms. She compares beach surveys from before and after storms, “but I would really like to capture and examine the processes occurring during the storm.” The Madeira Beach camera station, and the more portable system from Harrison and Hatcher, should enable her to do just that.
Media

Sources/Usage: Public Domain. View Media Details
Harrison’s focus is on the shape—or morphology—of the beach and the seafloor near the shore. “I'm really interested in how morphology changes the way currents and sediment move,” he says. Harrison specializes in simulating how changes in seafloor morphology—the growth of sandbars, for example—change ocean currents, which reshape the seafloor, and so on. “[The camera system] is a great tool to capture that behavior and to provide data I can use to refine morphodynamic models.”
According to Harrison, today’s morphodynamic models oversimplify how waves and currents behave, and how those forces move sediment and change the seafloor. He wants to use data from the videos—especially during a single storm—to improve the models. “We’re able to track the movement of morphological features as they adjust to waves and currents, and that gives us something to shoot for in our model simulations,” Harrison says.
Media

Sources/Usage: Public Domain. View Media Details
Media

Sources/Usage: Public Domain. View Media Details
“Once we get it right in our models, then it could be incorporated into operational coastal hazard forecast models,” Harrison says. These operational forecasts, frequently updated like weather forecasts, can warn coastal communities about potentially hazardous beach and dune erosion. Data from the Madeira Beach video camera are already helping USGS researcher Joe Long fine tune the Total Water Level and Coastal-Change Forecast Viewer. The web site displays forecasts for parts of the U.S. coastline using local beach characteristics.
Harrison views the Santa Cruz camera system as both a long-term observatory, and a testbed for new ideas and improving the system. Eventually, similar systems could be used for rapid storm response, and for remote locations like Pacific island atolls or Arctic bluffs that are much harder to access.
Related

Remote Sensing Coastal Change
We use remote-sensing technologies—such as aerial photography, satellite imagery, structure-from-motion (SfM) photogrammetry, and lidar (laser-based surveying)—to measure coastal change along U.S. shorelines.

Using Video Imagery to Study Coastal Change: Santa Cruz Beaches
Two video cameras atop the Dream Inn hotel in Santa Cruz, California, overlook the coast in northern Monterey Bay. One camera looks eastward over Santa Cruz Main Beach and boardwalk, while the other looks southward over Cowells Beach.

Time-lapse Photography of Barter Island in Alaska
This time-lapse of Barter Island in Alaska during three summer months in 2014, shows the pack ice melting and the subsequent effects to the beach and permafrost cliffs from storms and summer temperatures. This camera sat on a fallen snow fence to capture storm events.
Related
Remote Sensing Coastal Change
We use remote-sensing technologies—such as aerial photography, satellite imagery, structure-from-motion (SfM) photogrammetry, and lidar (laser-based surveying)—to measure coastal change along U.S. shorelines.
Using Video Imagery to Study Coastal Change: Santa Cruz Beaches
Two video cameras atop the Dream Inn hotel in Santa Cruz, California, overlook the coast in northern Monterey Bay. One camera looks eastward over Santa Cruz Main Beach and boardwalk, while the other looks southward over Cowells Beach.
Time-lapse Photography of Barter Island in Alaska
This time-lapse of Barter Island in Alaska during three summer months in 2014, shows the pack ice melting and the subsequent effects to the beach and permafrost cliffs from storms and summer temperatures. This camera sat on a fallen snow fence to capture storm events.
This time-lapse of Barter Island in Alaska during three summer months in 2014, shows the pack ice melting and the subsequent effects to the beach and permafrost cliffs from storms and summer temperatures. This camera sat on a fallen snow fence to capture storm events.