USGS scientist collects enviromental samples for AIV detection
USGS scientist collects enviromental samples for AIV detectionUSGS collects environmental samples for AIV detection at Crissy Marsh at Golden Gate National Recreation Area

Official websites use .gov
A .gov website belongs to an official government organization in the United States.
Secure .gov websites use HTTPS
A lock () or https:// means you’ve safely connected to the .gov website. Share sensitive information only on official, secure websites.
All items in this gallery are considered public domain unless otherwise noted.
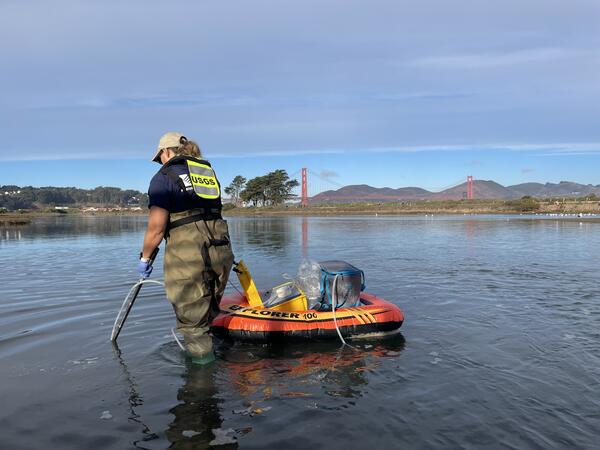
USGS collects environmental samples for AIV detection at Crissy Marsh at Golden Gate National Recreation Area
USGS collects environmental samples for AIV detection at Crissy Marsh at Golden Gate National Recreation Area

The USGS One Health approach addresses the interconnection between people, animals, plants, and their shared environment.
The USGS One Health approach addresses the interconnection between people, animals, plants, and their shared environment.
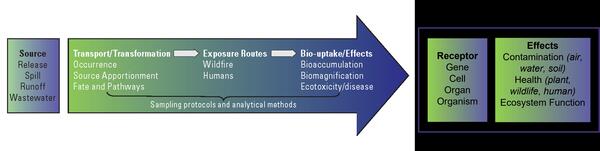
Updated image that shows the strategic approach for the Environmental Health Program for Environmental Contaminants
Updated image that shows the strategic approach for the Environmental Health Program for Environmental Contaminants
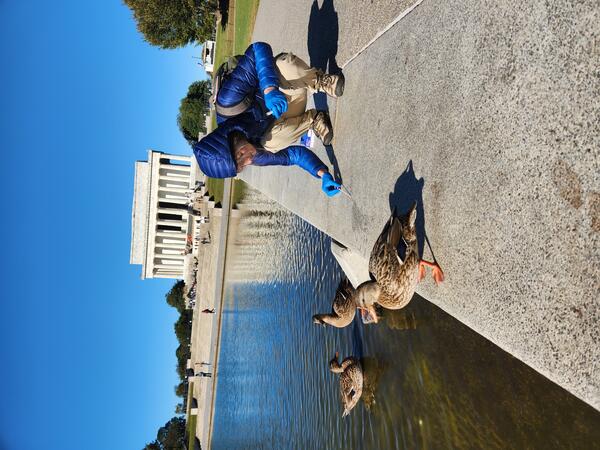
USGS scientist swabs fresh duck feces at Lincoln Memorial Reflecting Pool, Washington DC for AIV study
USGS scientist swabs fresh duck feces at Lincoln Memorial Reflecting Pool, Washington DC for AIV study
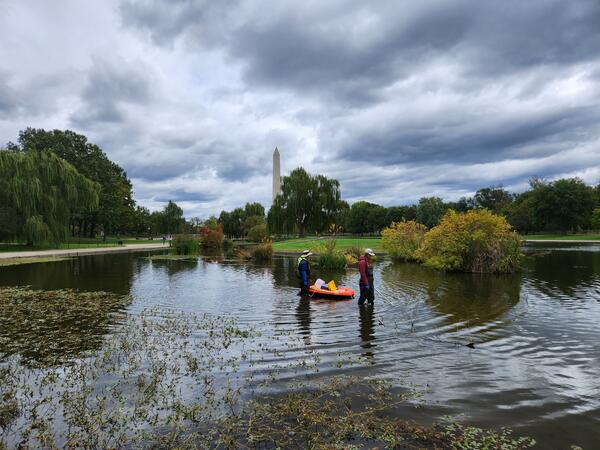
USGS and NPS employees sample for environmental AIV at Constitution Gardens, National Mall and Memorial Parks, Washington DC
USGS and NPS employees sample for environmental AIV at Constitution Gardens, National Mall and Memorial Parks, Washington DC
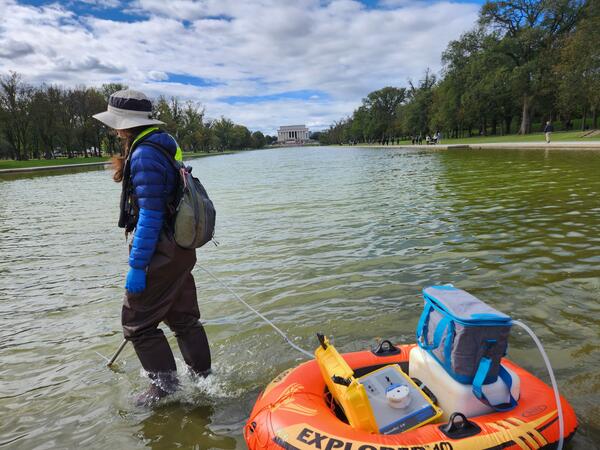
USGS scientists collects water samples for AIV sampling at the Lincoln Memorial Reflecting Pool at National Mall and Memorial Parks, Washington DC
USGS scientists collects water samples for AIV sampling at the Lincoln Memorial Reflecting Pool at National Mall and Memorial Parks, Washington DC

Photo of the USGS UMID Michigan Bacteriological Research Laboratory at the Upper Midwest Water Science Center
Photo of the USGS UMID Michigan Bacteriological Research Laboratory at the Upper Midwest Water Science Center

Michael Tate using the Raman microscope to identify and characterize microplastics at the Upper Midwest Water Science Center
Michael Tate using the Raman microscope to identify and characterize microplastics at the Upper Midwest Water Science Center

Filtered plastics from surface water in Madison, WI. This photo was taken at UMID for microplastic analysis and method development.
Filtered plastics from surface water in Madison, WI. This photo was taken at UMID for microplastic analysis and method development.

Water tracing dye was injected into a stream in Leadville, Colorado, to identify locations of metal loading and to guide geophysical measurements.
Water tracing dye was injected into a stream in Leadville, Colorado, to identify locations of metal loading and to guide geophysical measurements.

Butterflies and moths are submitted to the KS WSC for the Lepidoptera Research Collection Citizen Science Project. Julie Dietze holds a sphinx moth received from Texas.
Butterflies and moths are submitted to the KS WSC for the Lepidoptera Research Collection Citizen Science Project. Julie Dietze holds a sphinx moth received from Texas.

A long-term fiber-optic distributed temperature sensing monitoring array installed along Cement Creek near Silverton CO to track acid mine influenced groundwater discharge to the creek over time.
A long-term fiber-optic distributed temperature sensing monitoring array installed along Cement Creek near Silverton CO to track acid mine influenced groundwater discharge to the creek over time.

A Citizen Science Flyer requesting people to mail in deceased butterflies, moths, and skippers to help begin a USGS Scientific Collection to further research related to the decline of insect populations.
A Citizen Science Flyer requesting people to mail in deceased butterflies, moths, and skippers to help begin a USGS Scientific Collection to further research related to the decline of insect populations.

Specimens from a USGS Lepidoptera Research Collection stored at the Kansas WSC Organic Geochemistry Reseearch Laboratory. Specimens are received as part of a Citizen Science effort to establish a collection to further insect research.
Specimens from a USGS Lepidoptera Research Collection stored at the Kansas WSC Organic Geochemistry Reseearch Laboratory. Specimens are received as part of a Citizen Science effort to establish a collection to further insect research.

Smallmouth Bass are good indicators of methylmercury exposure to humans and wildlife because they are a common, popular sport fish and eat a variety of food during their lifetime. Juvenile Smallmouth Bass – smaller than 150mm in length - eat zooplankton, or microscopic animals.
Smallmouth Bass are good indicators of methylmercury exposure to humans and wildlife because they are a common, popular sport fish and eat a variety of food during their lifetime. Juvenile Smallmouth Bass – smaller than 150mm in length - eat zooplankton, or microscopic animals.

Image of pipettors used in the laboratory. Pipettes are stored on charging docking stations.
Image of pipettors used in the laboratory. Pipettes are stored on charging docking stations.

Image shows equipment for analysis of targeted and non-targeted organic contaminants at the OGRL located at the KS WSC.
Image shows equipment for analysis of targeted and non-targeted organic contaminants at the OGRL located at the KS WSC.

Fathead minnows (Pimephales promelas), pond mussel (Ligumia subrostrata), and passive samplers in an exposure tank housed inside of a mobile laboratory at the legacy fire-training area contaminated by PFAS derived from aqueous film-forming foams on Cape Cod, Massachusetts.
Fathead minnows (Pimephales promelas), pond mussel (Ligumia subrostrata), and passive samplers in an exposure tank housed inside of a mobile laboratory at the legacy fire-training area contaminated by PFAS derived from aqueous film-forming foams on Cape Cod, Massachusetts.

This is the instrument laboratory of the Organic Geochemistry Research Laboratory located in the KS WSC.
This is the instrument laboratory of the Organic Geochemistry Research Laboratory located in the KS WSC.

Image of numerous bottles of water used increasingly as an alternative drinking water source.
Image of numerous bottles of water used increasingly as an alternative drinking water source.

A biologist measures the length of a brook trout as part of a study on environmental DNA (eDNA).
A biologist measures the length of a brook trout as part of a study on environmental DNA (eDNA).