We collect interdisciplinary land imaging user needs focusing on what needs to be measured rather than specific technology. The foundation of our work is community engagement focused on understanding and documenting the needs of the land imaging user community.
REQUIREMENTS / User Needs
Our comprehensive user needs database consists of information gathered from hundreds of subject matter experts. User needs are captured in a “technology agnostic” format that provides flexibility in our analysis of the range of current and future technologies that could potentially meet the needs.
To serve you best, please:
- Review the sections below to learn more about the range and scope of user needs that we have collected.
- Explore how this information is being used to inform decisions.
- After learning more about the user needs gathering process, submit your request using the RCA-EO User Needs Form.
Types of Land Imaging Observation Needs
User needs cover a breadth of land-imaging observation types, spatial scales, and frequencies. The image below displays the general frequency and resolution of various earth observation needs, and the table lists the definitions of each topical area listed, with regards to land imaging user needs.
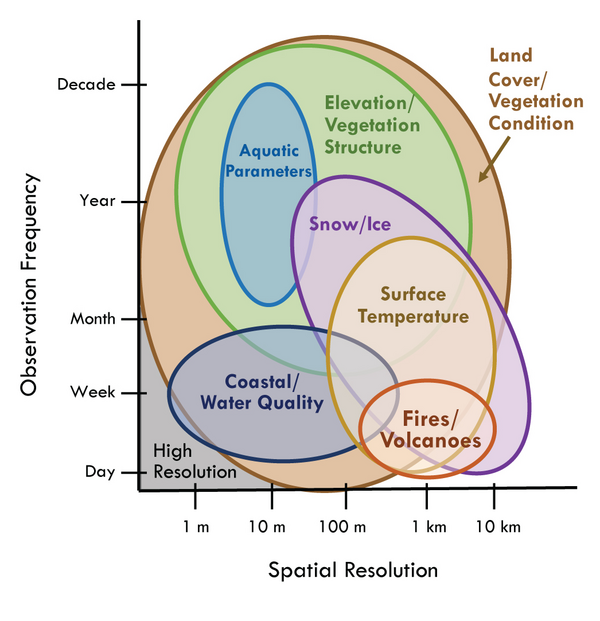
Topical Application Area Descriptions
- Aquatic Parameters - Includes aquatic biomass, coral reefs, bottom cover features, and bathymetry for inland lakes and rivers
- Coastal - Includes detection of oil spills, marine vessels, and surface debris in coastal environments
- Elevation/ Vegetation Structure - Includes the height and structure of land or ice surfaces, tree canopies and vegetation
- Fires/Volcanoes - Includes mapping of fire location, measurement of fire intensity, and detection of volcanic activity
- Land Cover/ Vegetation Condition - Includes vegetation characteristics such as water content, condition, structure, and assessment of burned areas
- Snow/Ice - Includes the properties of glaciers, sea ice, and snow
- Surface Temperature - Includes measurement of land and water surface temperature, surface emissivity, and evapotranspiration
- Water Quality - Includes measurements of surface water quality such as chlorophyll, turbidity, and suspended sediments
High Resolution - Crosscuts many topical areas including land cover, water quality, vegetation condition/type, soil moisture, snow, ice, elevation, and geology
Application Areas
User needs cover a breadth of applications including ecology, land use/land cover change, water resources and quality, and emergency/disaster management. The block chart below displays the top application areas where Earth observation data is required and the general proportion of needs related to each application.

Application Area Descriptions
- Agriculture - Irrigation monitoring, crop area/yield/condition monitoring
- Coastal - Coastal wetland research, coral reef monitoring, and sea-level monitoring
- Cryosphere - Snow cover extent and glacier research
- Ecology - Wildlife, vegetation, invasive species, and wetland monitoring
- Emergency/Disaster Management - Fire activities, volcano monitoring, flood mapping, landslide mapping, and emergency response activities
- Energy - Coal fires and bio-fuel estimation
- Forestry - Forest inventory/change, forest carbon estimation, and insect/disease mapping
- Geology - Mine reclamation and surface mineral mapping
- Land Use/Land Cover - Land cover change and land use mapping
- Other - Other land imaging applications
- Planning/Dev - Infrastructure mapping
- Public Health - Disease research and urban heat island
- Water Quality - Algal blooms, and water quality/water clarity monitoring
Water Resources - Consumptive use, irrigation monitoring, and surface water extent monitoring
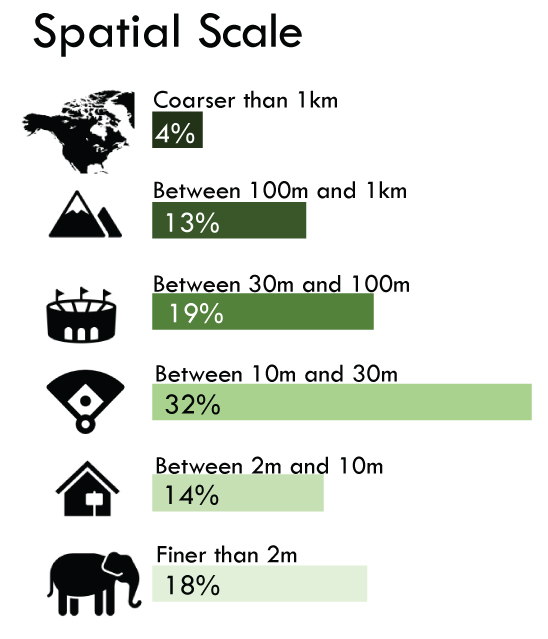
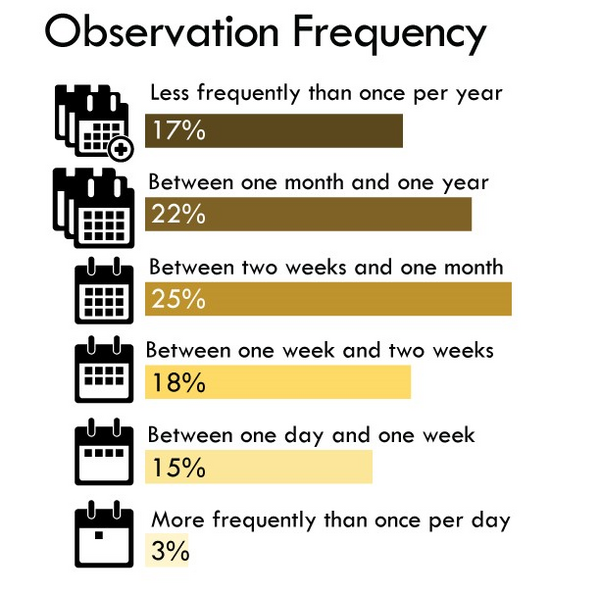
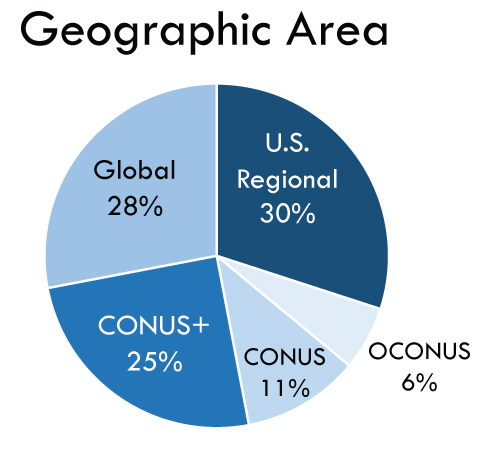
Attribute Distribution
User needs range in scale from centimeters to kilometers, observation frequency from minutes to decades, and geographic coverage from areas as narrow as the Great Lakes to the entire globe.