
May 2026 snowstorm in the Colorado River Basin. This infographic includes data visualizations showing the impact of the snowstorm on snow water equivalent across the basin.
Hayley Corson-Dosch
Hayley Corson-Dosch is a hydrologist in the Data Science Branch of the USGS Water Resources Mission Area.
Hayley received a B.A. in Earth and Environmental Sciences from Wesleyan University, a M.S. in Water Resources Science from Oregon State University, and a M.S. in Cartography and GIS from the University of Wisconsin – Madison. Her work at the USGS is multidisciplinary, focusing on lake and stream temperature modeling, data science workflows, and data visualization.
Science and Products
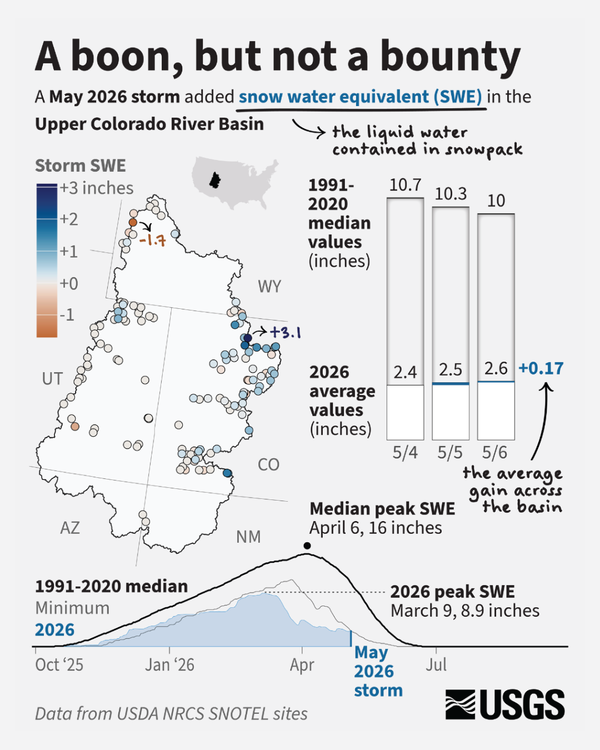
May 2026 snowstorm in the Colorado River Basin
May 2026 snowstorm in the Colorado River Basin. This infographic includes data visualizations showing the impact of the snowstorm on snow water equivalent across the basin.
River DroughtCast mobile video capture March 17, 2026
River DroughtCast mobile video capture March 17, 2026River DroughtCast is a new machine learning system that predicts streamflow droughts — specifically “streamflow” droughts when rivers and streams drop to unusually low levels— up to 90 days in advance. Each prediction comes with uncertainty information to help users understand the confidence level of the forecast.
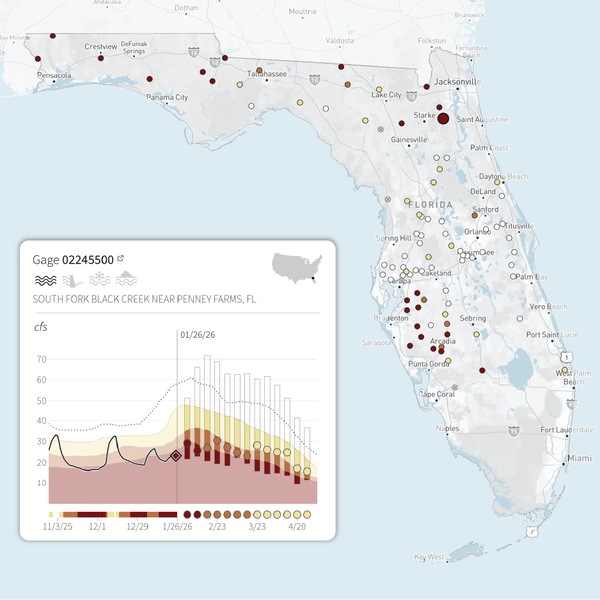
River DroughtCast streamflow drought status and forecasts
River DroughtCast streamflow drought status and forecastsRiver DroughtCast delivers current streamflow drought conditions and weekly forecasts of streamflow drought at select streamgages with long-term, complete records across the lower 48 states (the conterminous U.S., or CONUS).

Timeseries: tiles - Changes in U.S. water use from 1985 to 2015
Timeseries: tiles - Changes in U.S. water use from 1985 to 2015A tile map of the U.S. with alluvial charts for each state and the nation that show changes in the total volume of water use from 1985-2015 across eight categories (thermoelectric, irrigation, public supply, industrial, aquaculture, mining, domestic, and livestock).

Relationships: network - Which stream order covers the most distance?
Relationships: network - Which stream order covers the most distance?A map of the Potomac River stream network is colored by Strahler stream order, where higher order represents a larger stream. Next to the map is a donut chart, showing that small headwater streams (order 1) make up 57% of the river network, by length. The first three orders of streams, together, make up 87% of the network by length.

Distributions: humans - How are we using water?
8 maps of the continental U.S. show county-level water use for 8 categories of use – thermoelectric, irrigation, public supply, industrial, aquaculture, mining, domestic, and livestock. Use in each category is shown as a percent of total water use, by county. In the northern plains, most water is used for livestock. In west Texas, most water is used for mining.
8 maps of the continental U.S. show county-level water use for 8 categories of use – thermoelectric, irrigation, public supply, industrial, aquaculture, mining, domestic, and livestock. Use in each category is shown as a percent of total water use, by county. In the northern plains, most water is used for livestock. In west Texas, most water is used for mining.
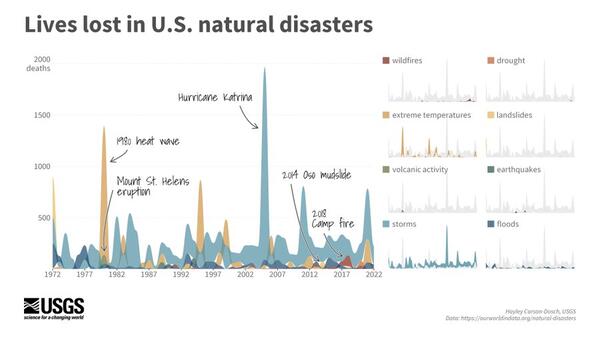
Comparisons data day: OWID - Lives lost in natural disasters
Comparisons data day: OWID - Lives lost in natural disastersAn alluvial diagram showing the number of deaths due to natural disasters in the United States over the past 50 years (1972 – 2022). The data include deaths due to eight types of natural disasters: wildfires, drought, extreme temperatures, landslides, volcanic activity, earthquakes, storms, and floods

Comparisons: waffle - 2015 daily water use
In 2015, water use in the U.S. totaled 322 billion gallons/day. Total water use is broken out into 8 categories using different colors.
In 2015, water use in the U.S. totaled 322 billion gallons/day. Total water use is broken out into 8 categories using different colors.

The Water Cycle (PNG)
This diagram, released in 2022, depicts the global water cycle. It shows how human water use affects where water is stored, how it moves, and how clean it is. This diagram is available in English and Spanish.
This diagram, released in 2022, depicts the global water cycle. It shows how human water use affects where water is stored, how it moves, and how clean it is. This diagram is available in English and Spanish.

El Ciclo del Agua - The Water Cycle, Spanish (PNG)
El Ciclo del Agua - The Water Cycle, Spanish (PNG)*English is the official language and authoritative version of all federal information
El Ciclo del Agua - The Water Cycle, Spanish (PNG)
El Ciclo del Agua - The Water Cycle, Spanish (PNG)*English is the official language and authoritative version of all federal information
Science and Products
May 2026 snowstorm in the Colorado River Basin
May 2026 snowstorm in the Colorado River Basin. This infographic includes data visualizations showing the impact of the snowstorm on snow water equivalent across the basin.
May 2026 snowstorm in the Colorado River Basin. This infographic includes data visualizations showing the impact of the snowstorm on snow water equivalent across the basin.
River DroughtCast mobile video capture March 17, 2026
River DroughtCast mobile video capture March 17, 2026River DroughtCast is a new machine learning system that predicts streamflow droughts — specifically “streamflow” droughts when rivers and streams drop to unusually low levels— up to 90 days in advance. Each prediction comes with uncertainty information to help users understand the confidence level of the forecast.
River DroughtCast streamflow drought status and forecasts
River DroughtCast streamflow drought status and forecastsRiver DroughtCast delivers current streamflow drought conditions and weekly forecasts of streamflow drought at select streamgages with long-term, complete records across the lower 48 states (the conterminous U.S., or CONUS).
Timeseries: tiles - Changes in U.S. water use from 1985 to 2015
Timeseries: tiles - Changes in U.S. water use from 1985 to 2015A tile map of the U.S. with alluvial charts for each state and the nation that show changes in the total volume of water use from 1985-2015 across eight categories (thermoelectric, irrigation, public supply, industrial, aquaculture, mining, domestic, and livestock).
Relationships: network - Which stream order covers the most distance?
Relationships: network - Which stream order covers the most distance?A map of the Potomac River stream network is colored by Strahler stream order, where higher order represents a larger stream. Next to the map is a donut chart, showing that small headwater streams (order 1) make up 57% of the river network, by length. The first three orders of streams, together, make up 87% of the network by length.
Distributions: humans - How are we using water?
8 maps of the continental U.S. show county-level water use for 8 categories of use – thermoelectric, irrigation, public supply, industrial, aquaculture, mining, domestic, and livestock. Use in each category is shown as a percent of total water use, by county. In the northern plains, most water is used for livestock. In west Texas, most water is used for mining.
8 maps of the continental U.S. show county-level water use for 8 categories of use – thermoelectric, irrigation, public supply, industrial, aquaculture, mining, domestic, and livestock. Use in each category is shown as a percent of total water use, by county. In the northern plains, most water is used for livestock. In west Texas, most water is used for mining.
Comparisons data day: OWID - Lives lost in natural disasters
Comparisons data day: OWID - Lives lost in natural disastersAn alluvial diagram showing the number of deaths due to natural disasters in the United States over the past 50 years (1972 – 2022). The data include deaths due to eight types of natural disasters: wildfires, drought, extreme temperatures, landslides, volcanic activity, earthquakes, storms, and floods
Comparisons: waffle - 2015 daily water use
In 2015, water use in the U.S. totaled 322 billion gallons/day. Total water use is broken out into 8 categories using different colors.
In 2015, water use in the U.S. totaled 322 billion gallons/day. Total water use is broken out into 8 categories using different colors.
The Water Cycle (PNG)
This diagram, released in 2022, depicts the global water cycle. It shows how human water use affects where water is stored, how it moves, and how clean it is. This diagram is available in English and Spanish.
This diagram, released in 2022, depicts the global water cycle. It shows how human water use affects where water is stored, how it moves, and how clean it is. This diagram is available in English and Spanish.
El Ciclo del Agua - The Water Cycle, Spanish (PNG)
El Ciclo del Agua - The Water Cycle, Spanish (PNG)*English is the official language and authoritative version of all federal information
El Ciclo del Agua - The Water Cycle, Spanish (PNG)
El Ciclo del Agua - The Water Cycle, Spanish (PNG)*English is the official language and authoritative version of all federal information