Real-Time Flood Impact Map
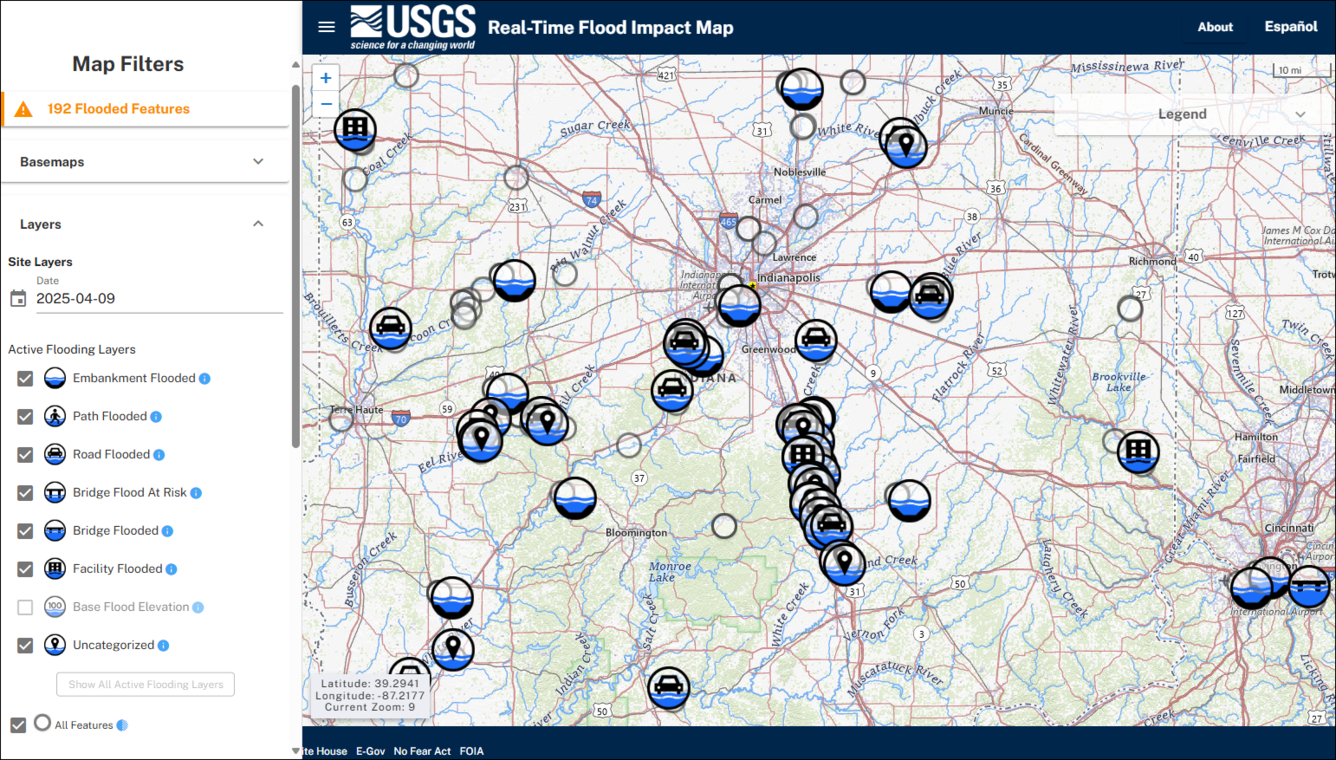
The USGS Real-Time Flood Impact (RT-FI) Map displays the locations (called “Flood Impact Locations”) where the USGS has measured the height of critical safety or infrastructure features that may be vulnerable to flood impacts. Some examples of Flood Impact Locations include stream and river embankments; roads and bridges; pedestrian paths; buildings; and more.
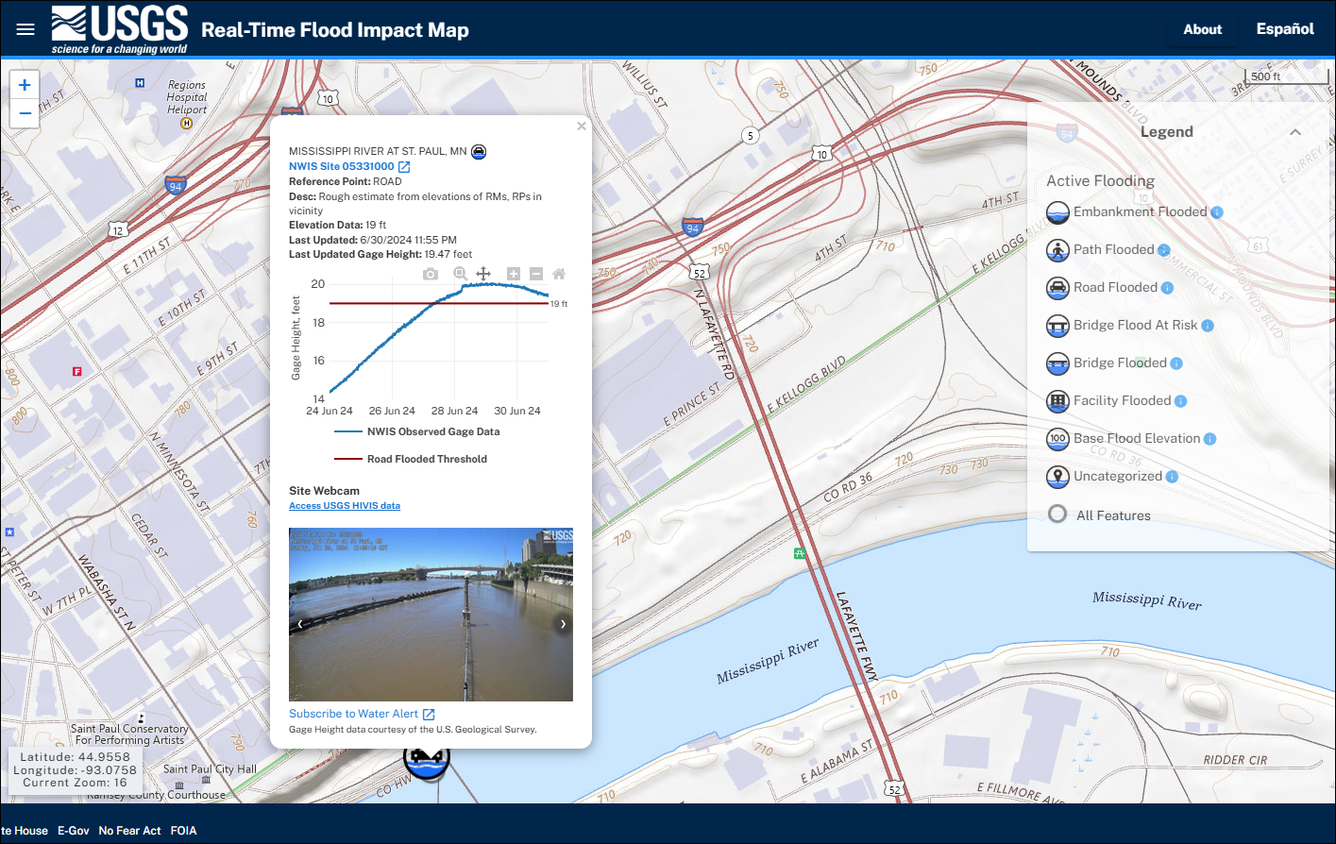
Flood Impact Locations are surveyed and associated with a nearby USGS real-time streamgage. When the streamgage water level (or gage height) exceeds the Flood Impact Location’s surveyed height, its icon will display on the map, showing that this location may be currently flooded. When you click on the icon, the pop-up will display the current gage height and the Flood Impact Location height, so you can compare how close that location is to the current water level. Some Flood Impact Locations may be measured below the level of actual flooding to provide an early warning that flooding may be imminent.
A Spanish translation of the front-end RT-FI Map interface is also available by clicking on "Español" in the upper right corner of the Map.
The Real-Time Flood Impact API service is also available through the modernized Water Data APIs site.