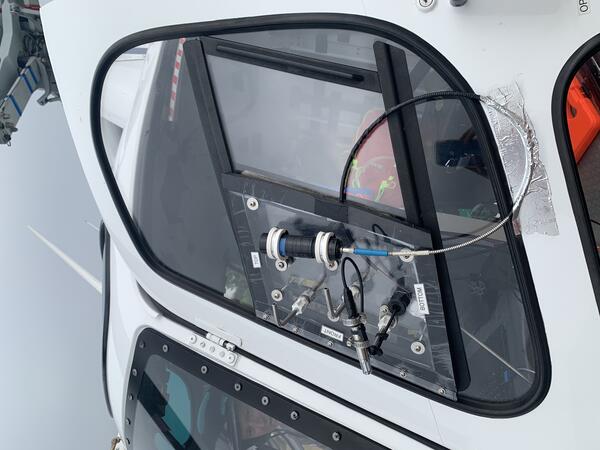
U.S. flag

An official website of the United States government

Images

Images related to Mount Rainier.

Filter Total Items: 28
Color photos of the summit of Mount Rainier with snow on the mountain and clouds below.
Aerial view of the summit of Mount Rainier taken during the gas flight.

Aerial view of the summit of Mount Rainier taken during the gas flight. The photo was taken looking south, and Rainier (14,411’) rises prominently above the cloud deck at about 8,000’. Mount St. Helens (8,357’) is faintly visible in the distance.  

Aerial view of the summit of Mount Rainier taken during the gas flight. The photo was taken looking south, and Rainier (14,411’) rises prominently above the cloud deck at about 8,000’. Mount St. Helens (8,357’) is faintly visible in the distance.  

Color photo of a hand held computer tablet displaying data in real time.
Gas composition data is displayed in real time during gas flights.

Gas composition data is displayed in real time during gas flights. The tablet display shows measurements of CO2 (blue line), SO2 (red line) and H2S (green line) that are collected every second.

Gas composition data is displayed in real time during gas flights. The tablet display shows measurements of CO2 (blue line), SO2 (red line) and H2S (green line) that are collected every second.

Color photo of the sampling equipment connected to the window of the helicopter.
Gas inlet window plate holding gas sampling equipment.

Gas inlet window plate holding rear-facing gas inlet ports, a temperature/relative humidity sensor, and an upward looking UV telescope that is connected to a spectrometer by fiber optic cable.

Gas inlet window plate holding rear-facing gas inlet ports, a temperature/relative humidity sensor, and an upward looking UV telescope that is connected to a spectrometer by fiber optic cable.

shaded relief map with July 8 - August 25, 2025, earthquakes in orange beneath summit of Rainier
Seismicity beneath Mount Rainier, highlighting July 8 - August 25, 2025, earthquake swarm

Seismicity beneath Mount Rainier, Washington, showing earthquakes during 2020-2025 in blue, and those that occurred as part of an earthquake swarm on July 8 - August 25, 2025, in orange.

plot of earthquake magnitudes and numbers at Mount Rainier over July 8 - August 25, 2025 both are decreasing with time
Earthquake magnitudes and numbers over time during July 8 - August 25, 2025, Mount Rainier earthquake swarm

Plots of earthquake magnitudes (top) and numbers (bottom) over the course of the July 8 - August 25, 2025 seismic swarm at Mount Rainier, Washington.  The swarm was greatest in terms of numbers of events on the morning of July 8.  After that time, earthquake rates slowly decreased over the course of the following days.

USGS Employees high five students participating in an outdoor lahar evacuation drill outside their school
Lahar Evacuation Drill

During the March 21, 2024 lahar evacuation drills, thousands of students walked to the Washington State Fairgrounds in Puyallup, Washington to practice evacuating from a lahar generated by Mount Rainier. A lahar, or volcanic mudflow, could reach this area in about 3 hours.

During the March 21, 2024 lahar evacuation drills, thousands of students walked to the Washington State Fairgrounds in Puyallup, Washington to practice evacuating from a lahar generated by Mount Rainier. A lahar, or volcanic mudflow, could reach this area in about 3 hours.

D-Claw computer simulation of landslide that begins on Mount Rainier's west flank (Tahoma Glacier Headwall).
D-Claw computer simulation of a landslide that begins on Mount Rainier's west flank (Tahoma Glacier Headwall).

Close-up oblique views of Mount Rainier’s west side showing simulated lahar flow depths from a landslide originating in the area of the Tahoma Glacier Headwall (T-260-HM simulation). Imagery appears blurry where lahar material is absent because D-Claw’s adaptive mesh refinement (AMR) employs very coarse resolution in those areas.

Close-up oblique views of Mount Rainier’s west side showing simulated lahar flow depths from a landslide originating in the area of the Tahoma Glacier Headwall (T-260-HM simulation). Imagery appears blurry where lahar material is absent because D-Claw’s adaptive mesh refinement (AMR) employs very coarse resolution in those areas.

Geophysicist checks data output at Mount Rainier station

A seismologist with the Cascades Volcano Observatory checks the data output on a newly installed monitoring station at Mount Rainier.

Geophysicist takes notes after installing a seismometer at Mount Rainier
A geophysicist notes location of new seismometer at Mount Rainier

A geophysicist from the Cascades Volcano Observatory notes the location of a newly buried seismometer at station PARA, on Mount Rainier.

NAGT intern installs an infrasound array at Mount Rainier
NAGT intern installs infrasound sensors at Mount Rainier

NAGT intern Emily Bryant installs one of three infrasound sensors at volcano monitoring station PARA, at Mount Rainier.

4 images showing boxes of equipment with wires being put into the ground in a forest setting.
Scientists installing a lahar monitoring station.

Lahar monitoring equipment is housed in a secure box with multiple types of instruments to detect approaching lahars.  

Geophysicist works at station PR05, part of the Mount Rainier lahar detection network.
Station PR05 is part of the Mount Rainier lahar detection network.

USGS-Cascades Volcano Observatory geophysicist Rebecca Kramer works on station PR05, which is part of the Mount Rainier lahar detection network (Mount Rainier is pictured in the distance). The purpose of the site visit was to upgrade the power system and deploy infrasound equipment. 

USGS-Cascades Volcano Observatory geophysicist Rebecca Kramer works on station PR05, which is part of the Mount Rainier lahar detection network (Mount Rainier is pictured in the distance). The purpose of the site visit was to upgrade the power system and deploy infrasound equipment. 

Depth of earthquakes at Mount Rainier 2010 to 2019
Mount Rainier: Earthquakes in the Hydrothermal System

Earthquakes at Mount Rainier from 2010 to 2019. As shown in the graphic, fluids from the magmatic system beneath the volcano rise through existing cracks and weaknesses in the crust. Along with rainwater and ice/snow melt, these fluids combine to create a hydrothermal system within the volcano.

Earthquakes at Mount Rainier from 2010 to 2019. As shown in the graphic, fluids from the magmatic system beneath the volcano rise through existing cracks and weaknesses in the crust. Along with rainwater and ice/snow melt, these fluids combine to create a hydrothermal system within the volcano.

Seismic swarm at Mount Rainier September 11-13, 2017....
Seismic swarm at Mount Rainier Sep. 11-13, 2017.

Top: Map view of well recorded historical seismicity at Mount Rainier since 2007 (gray circles) with seismicity since September 11 plotted as filled red circles. Location of seismic stations indicated by arrows. Bottom: Cross-sectional view looking north shows earthquake depths. Black outline is a west-east elevation profile of Mount Rainier.

Top: Map view of well recorded historical seismicity at Mount Rainier since 2007 (gray circles) with seismicity since September 11 plotted as filled red circles. Location of seismic stations indicated by arrows. Bottom: Cross-sectional view looking north shows earthquake depths. Black outline is a west-east elevation profile of Mount Rainier.

Mount Rainier, as viewed from Panhandle Gap....
Mount Rainier, as viewed from Panhandle Gap.
LaharZ model (left) of the possible lahar hazards from the Carbon a...
LaharZ model of the possible lahar hazards from the Carbon and Puya...

LaharZ model (left) of the possible lahar hazards from the Carbon and Puyallup River drainages from Mount Rainier. The town of Orting, Washington (photograph) sits in the lahar hazard zone.

Mount Rainier, WA, simplified hazards map showing primary volcano hazards
Mount Rainier, WA, simplified hazards map

This map shows areas that could be affected by debris flows, lahars, lava flows, and pyroclastic flows from Mount Rainier if events similar in size to past events occurred today. Because small lahars are more common than large ones, most lahars would be less extensive than the hazard zone shown on the map and a few would be more extensive.

This map shows areas that could be affected by debris flows, lahars, lava flows, and pyroclastic flows from Mount Rainier if events similar in size to past events occurred today. Because small lahars are more common than large ones, most lahars would be less extensive than the hazard zone shown on the map and a few would be more extensive.

Was this page helpful?