
Data Visualization Tools
Data Visualization Tools
Filter Total Items: 12
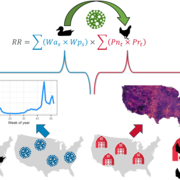
Advancing Risk Modeling for Highly Pathogenic Avian Influenza
Ongoing global outbreaks demonstrate the capacity of highly pathogenic avian influenza virus (HPAIV) to impact poultry, wild birds, and even human health. USGS research is advancing the understanding of the spatial and temporal interface between wild and domestic bird populations from which these viruses emerge to aid biosecurity planning and outbreak response.

Key Values of a Century of EESC Science
The USGS Eastern Ecological Science Center (EESC) is rooted in a proud tradition of service to the nation—advancing science that informs the conservation and management of fish, wildlife, and habitats across the eastern United States and beyond. Our mission is clear: deliver reliable, partner-driven science that supports natural resource decisions today, while ensuring these resources remain...

EESC Makes an Impact: Preserving our Hunting Resources
Hunting is an economic engine for the U.S. and responsible management of these resources directly supports 45.2 billion dollars spent by hunters annually. Conservation and management of hunting resources also contributes substantially to the 394.8 billion dollars spent on all wildlife-related recreation. Hunting traditions are an integral component of our American heritage, with 14.4 million...
EESC Makes an Impact: Reducing Management Costs and Increasing Efficiency
Decision analysis is widely used in business applications to improve cost saving and increase efficiency under uncertainty. Scientists at the U.S. Geological Survey Eastern Ecological Science Center (EESC) include world-renowned experts who use data, mathematics, statistics, and computer science to help frame and solve decision problems to support U.S. national security, public health, wildlife...

Using Global Telemetry to Understand Avian Movement and Migration
USGS researchers are collaborating with partners around the globe to leverage new and existing telemetry data to answer broad scale questions about factors influencing avian movement and migration.
Identifying Spatial and Temporal Trends in Avian Influenza Prevalence in Wild Waterfowl Across the United States
USGS researchers are at the forefront of building and maintaining datasets that represent the spatial and temporal patterns in avian influenza virus prevalence in wild birds, which is critical information used to estimate transmission risk to domestic poultry.
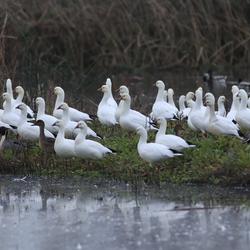
Developing Waterfowl Distribution and Abundance Models to Inform Avian Influenza Transmission Risk
USGS researchers are developing novel methods to improve our understanding of waterfowl distributions and abundance across the United States to inform a variety of ongoing disease studies. Understanding the distribution of wild waterfowl is a critical component to assessing avian influenza transmission risks across the landscape.

Production, Behavior, and Survival of Juvenile Shad and River Herring
USGS is conducting research to better understand biology, behavior, and survival of juvenile fishes that travel between fresh and saltwater to complete their lifecycles. Migratory fishes as such as herring and shad are vital components in riverine and coastal ecosystems, transporting food and nutrients between fresh rivers and the ocean. They are also an important forage fish for predators in...

Using Multiple Indicators to Assess Stream Condition in the Chesapeake Bay
USGS is working with federal, state and local partners to develop multiple assessments of stream and river conditions in non-tidal areas of the Chesapeake Bay watershed. These assessments will help managers preserve stream health and improve biological conditions in impaired streams as the human population and climate continue to change in this region.

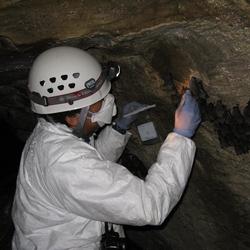
Decision Science Support for SARS-CoV-2 Risk to North American Bats
The Eastern Ecological Science Center is working closely with federal, state, and tribal partners to help inform decisions that reduce the risk of SARS-CoV-2 transmission from humans to North American wildlife, including bats.

Climate change forecasts for eastern salmonids
Small streams in forests are likely to see dramatic shifts as global climate change influences air temperature and rain patterns. We have already seen warmer stream temperatures as air temperatures increase in summer in the Northeastern US. The intensity and duration of floods and droughts are also expected to magnify as future rain patterns shift. This project will evaluate how stream temperature...

The West Brook Story
Natural systems, like rivers and streams, are remarkably complex, with many interacting parts. Data visualization tools make understanding and communicating complex ecological processes easier. Effective visualizations help users learn about patterns in data and how models work. Interactive visualizations are particularly useful, as they let users explore data and develop a personal understanding...