
Web Tools
At the Eastern Ecological Science Center (EESC), we strive to provide world-class science to inform natural resource decisions that preserve and enhance our quality of life.
Connect with Us
Connect with Us

Find locations, staff profiles and contact information for our team.
EESC's Latest Findings
EESC's Latest Findings
Search for EESC publications by location, author, year or keyword.
Filter Total Items: 22
PFAS in surface waters of the non-tidal Passaic River Basin PFAS in surface waters of the non-tidal Passaic River Basin
Per- and poly-fluoroalkyl substances (PFAS) are a class of thousands of manmade chemicals that are a concern to human-health due to their environmental prevalence and persistence and human exposures through food and drinking water. This study was designed to understand the presence and concentrations of PFAS in surface waters of the Passaic River Basin.
Visualizing Models for Avian Influenza Viruses Visualizing Models for Avian Influenza Viruses
Emergence of avian influenza viruses with the potential to be highly pathogenic to poultry, wild birds, & humans, such as the highly pathogenic H5N1 and H7N9 cause serious concern for the global economic & public health sectors. Visual representations of model data can be effective in helping to discover how the spread of the virus is influenced by environmental & human
Fishway Structure Data in the Eastern United States Fishway Structure Data in the Eastern United States
This geonarrative represents a compilation of fishways, and their associated characteristics, collected by the Atlantic States Marine Fisheries Commission (ASMFC) member states at the request of the U.S. Geological Survey (USGS).
Avian Influenza: Research by the USGS and Partners Avian Influenza: Research by the USGS and Partners
The USGS Ecosystems Mission Area provides science to understand wildlife diseases, including avian influenza (AI). Avian influenza viruses occur naturally in wild birds such as ducks, geese, swans, and gulls. These viruses generally do not cause illness in wild birds but they can be highly pathogenic and cause illness and death in poultry and wildlife. Learn more with this geonarrative.
By
Ecosystems Mission Area, Biological Threats and Invasive Species Research Program, Cooperative Research Units, Alaska Science Center, Eastern Ecological Science Center, National Wildlife Health Center, Upper Midwest Environmental Sciences Center, Upper Midwest Water Science Center, Western Ecological Research Center (WERC)
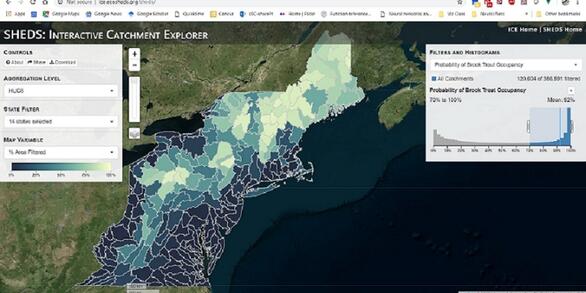
Interactive Catchment Explorer (ICE) Interactive Catchment Explorer (ICE)
Interactive Catchment Explorer (ICE) is a web-based data visualization tool for exploring complex, multivariate environmental datasets and model results. It is designed to help researchers and resource managers identify spatial patterns in hydro-ecological conditions and to prioritize locations for restoration or further study.
EcoSHEDS EcoSHEDS
EcoSHEDS is a collection of Spatial Hydro-Ecological Data Systems (SHEDS) designed to improve our understanding of stream ecosystems. The goal of EcoSHEDS is to provide a series of user-friendly tools for gaining insight and supporting transparent research, management, and decision-making of hydro-ecological resources.
Flow Photo Explorer Flow Photo Explorer
The Flow Photo Explorer is an integrated database, machine learning, and data visualization platform for monitoring streamflow and other hydrologic conditions using timelapse images.
PFAS in US Tapwater Interactive Dashboard PFAS in US Tapwater Interactive Dashboard
Drinking-water quality and potential exposures to per- and poly-fluoroalkyl substances (PFAS) at the point-of-use (tapwater) are a rising concern in the United States (US).
Environmental Health Program at the U.S. Geological Survey Environmental Health Program at the U.S. Geological Survey
One Health science to address high priority issues related to human and wildlife exposures to environmental contaminants and pathogens
North American Breeding Bird Survey Results and Analysis North American Breeding Bird Survey Results and Analysis
This website provides visualizations of population change for North American birds using data from the North American Breeding Bird Survey (BBS). The BBS is analyzed for a "core" area (contiguous United States and southern Canada, results available from 1966-present), and for an "expanded" survey area (including portions of Alaska and northern Canada with results from 1993-present).
National Early Detection and Rapid Response (EDRR) Framework National Early Detection and Rapid Response (EDRR) Framework
A geonarrative detailing the National Early Detection and Rapid Response (EDRR) Framework, a structure for interagency coordination to support early detection biosurveillance and rapid response to invasive species.