
New Jersey Tide Network
The USGS operates the most extensive network of tide-gaging stations in the region, many of which form the backbone of flood-warning and storm-hazard warning systems. The New Jersey Water Science Center monitors data for estuary and back-bay areas all along the New Jersey coast and links to related projects with more information about coastal flood hazards, water quality, and other topics. This network provides current conditions of tidal elevation, and meteorological data for coastal sites along the New Jersey shoreline, with a subset of sites providing tidal discharge and water-quality data.
Each summer the population of the barrier-island communities of New Jersey increases by tens of thousands. When a hurricane threatens these communities, the few bridges and causeways that connect the islands with the mainland become overcrowded, making evacuations from the barrier islands to the mainland difficult. Timely evacuation depends on well-defined emergency evacuation plans used in conjunction with accurate flood forecasting and real-time tidal elevation information.
The National Ocean Service (NOS) adequately covers tidal data collection on the ocean and large bays, but in New Jersey little to no data were available for the back-bay areas. Tidal elevation in the back bays behave quite differently than the ocean due to the complex interaction between the wind-driven surface water movement and the shifting geometry of the inlets, bays, and rivers. For example, a slow-moving Nor’easter can retain tidal elevation levels in back bays and upstream rivers several feet higher than the ocean by trapping additional water and not allowing tides to recede normally. This results in flooded coastal and low-land communities along with bridges and causeways that link the barrier islands to the mainland.
New Jersey’s back-bay communities annually face the risk of catastrophic flooding from hurricanes and coastal storms. Weather forecasters, along with emergency management and transportation officials, require comprehensive and timely tidal elevation and meteorological data to make accurate flood forecasts and to plan and execute coastal hazard mitigation strategies. These strategies include coastal evacuation, multi-agency coordination, contingency plans and drills, zoning and building code recommendations, and proper design of physical structures, roads, and bridges.
The U.S. Geological Survey (USGS), in cooperation with the New Jersey Department of Transportation (NJDOT), designed and installed the New Jersey Tide Network (NJTN) with assistance from NOS in 1997. The system continues to be operated in cooperation as part of a statewide network of tide gages, weather stations, and stream gages collecting invaluable data in real time. The NJTN supplies real-time tide-level and meteorological data for flood-prone areas along the New Jersey shore and back bays to critical decision-making centers and the publicly-available world wide web.
The USGS New Jersey Water Science Center is responsible for overall project coordination along with operation and maintenance of all instrumentation and remote data-collection platforms.

NEW JERSEY TIDE NETWORK
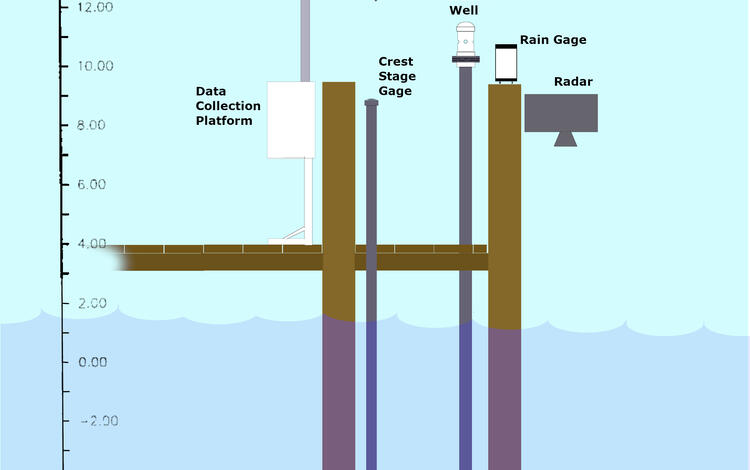
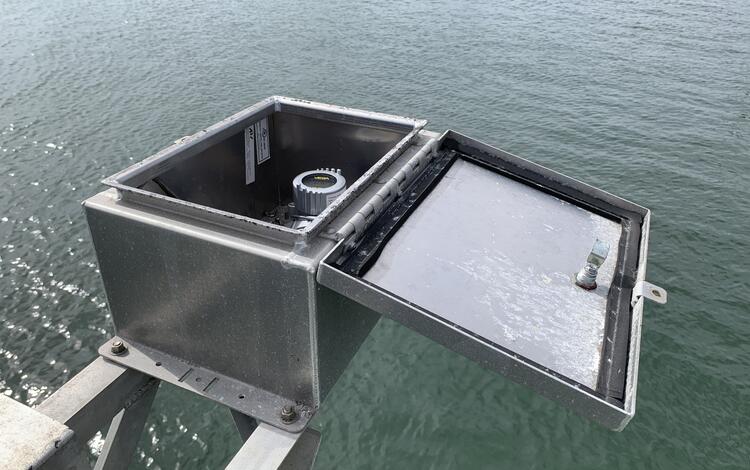
The NJTN presently consists of 31 tide gages, 28 weather stations, and 30 tidal crest-stage gages in 13 New Jersey counties, along the coastal regions of New Jersey, including the barrier islands, the back bays, the near-shore environments from Hackensack to Cape May, The Delaware Bay, and the Delaware River. The tidal elevation at each of the tide gages is averaged at 6-minute intervals, stored by a data collection platform (DCP), and transmitted via satellite to the Water Data for the Nation webpages.
Real-Time Tide Network
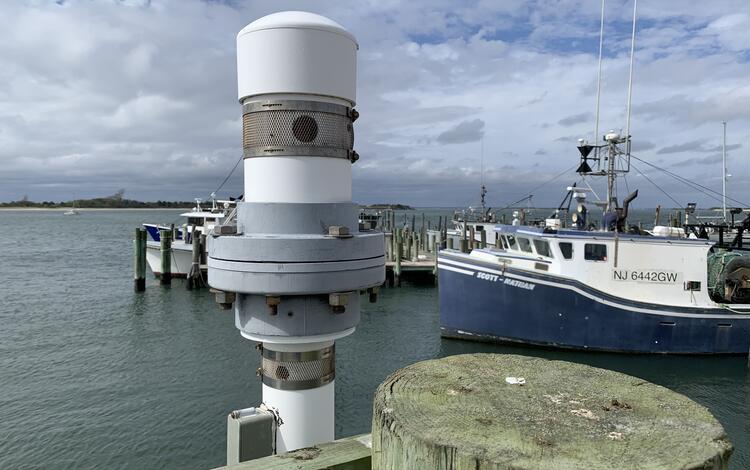
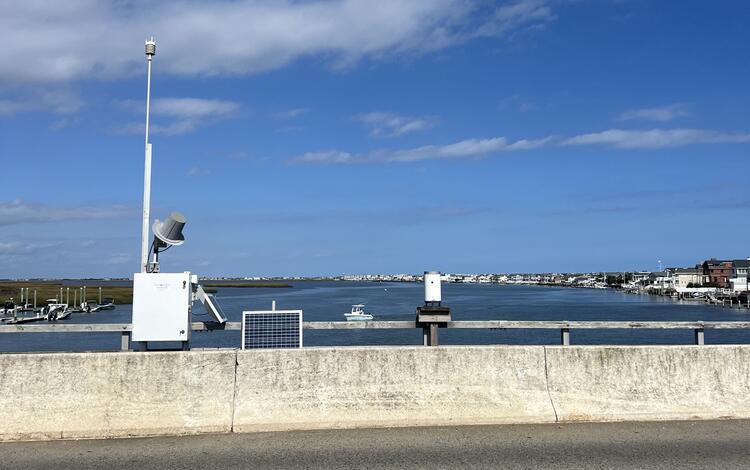
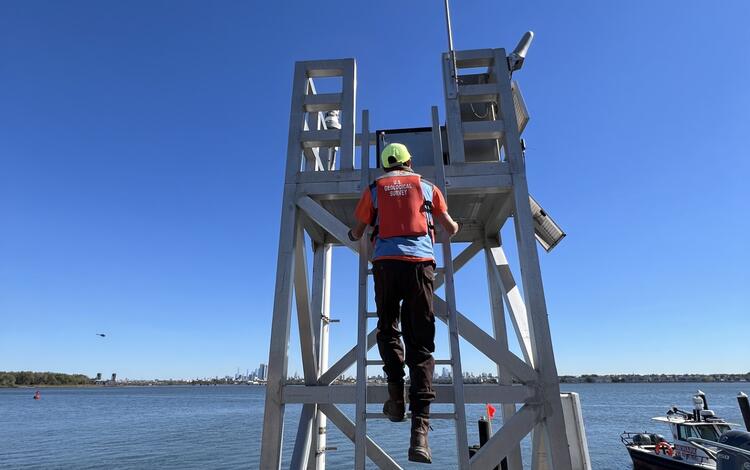
Tide Monitoring Equipment
Click on images below for more information

Storm Impact Studies
“The NJWSC NJ Tide Network was fully prepared to capture any storm, that is... until Hurricane Sandy in October 2012.
October 29, 2012
Hurricane Sandy
Changed Everything
Of the 24 real-time tide gages in operation in 2012, only seven recorded an uninterrupted tide signature over the course of the storm and four of those were south of Atlantic City. Six additional gages experienced real-time data interruptions, but accurate peaks were captured by the co-located tidal crest-stage gage (TCSG). The remaining 11 tide gage peaks were estimated based on high-water marks (HWMs) collected nearby. Four gages located in Newark, South Amboy, Seaside Heights, and Waretown suffered structural damaged with the latter two damaged beyond repair.
Storm Hardening our Gages
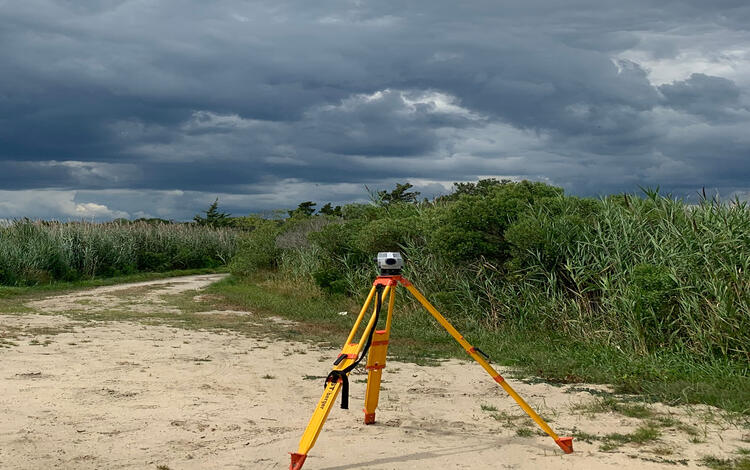
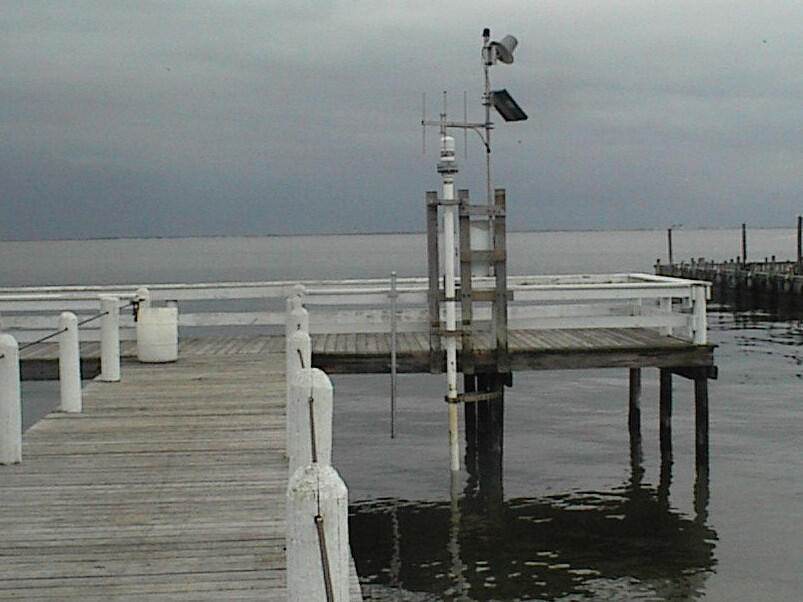
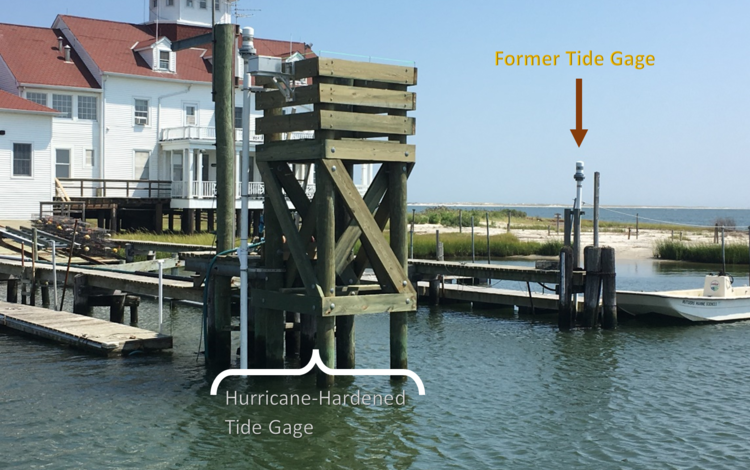
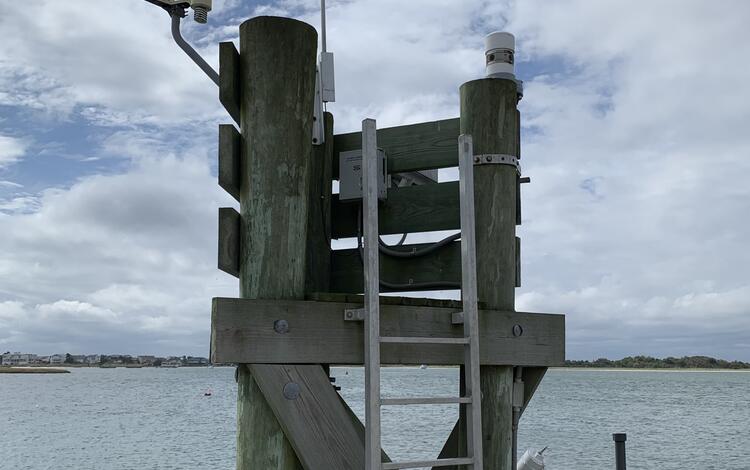
The New Jersey USGS 01409124 Barnegat Bay near Waretown, New Jersey as it was before Hurricane Sandy, what was found post Hurricane Sandy, and as it exists following the Storm Hardening procedures


Hurricane Sandy was a major coastal storm that affected many coastal communities in New Jersey. Our continuous tidal elevation network is important for various reasons over the range of the tidal cycle but are especially needed for extreme events like the one caused by Hurricane Sandy. These data are used by Emergency Management during the storm and decisionmakers post storm to help assess damage and appropriately plan.
Hurricane Sandy identified vulnerabilities in our network infrastructure. Following the storm, we assessed gages that needed to be storm hardened to ensure that our equipment continued to collect data for the duration of future extreme storm events. Some tide gages were adequately hardened as they stood, however, most of the existing gages needed upgrades to enhance storm resiliency. These upgrades involved elevating our sensors and other equipment above the tidal base flow elevation (BFE). Depending on site specific surroundings and existing infrastructure, this was accomplished by relocating gages to bridges, installing large 3- or 4-pile wooden platforms in the water, or by installing large aluminum platforms at the edge of water. Additional network enhancements included installing redundant tidal elevation sensor at each tide gage as backup in case the primary sensor gets damaged. The tide network was also enhanced with weather stations at each of the gages, which monitor air temperature, relative humidity, barometric pressure, and wind speed, direction, and gust. Precipitation is measured as well.


The New Jersey Tide Network has spawned many other programs and monitoring networks
New Jersey Coastal Weather Network
The weather stations measure, store, and transmit tide levels and meteorological data — rainfall, windspeed and direction, air temperature, relative humidity, and barometric pressure — using satellite telemetry.
Estimating Daily Upstream Location of the Freshwater-Saltwater Interface in New Jersey
Title
New Jersey Coastal Camera Network
To view the Webcam click on the number to see the location and click "Learn More"
The USGS operates the most extensive network of tide-gaging stations in the region, many of which form the backbone of flood-warning and storm-hazard warning systems. The New Jersey Water Science Center monitors data for estuary and back-bay areas all along the New Jersey coast and links to related projects with more information about coastal flood hazards, water quality, and other topics. This network provides current conditions of tidal elevation, and meteorological data for coastal sites along the New Jersey shoreline, with a subset of sites providing tidal discharge and water-quality data.
Each summer the population of the barrier-island communities of New Jersey increases by tens of thousands. When a hurricane threatens these communities, the few bridges and causeways that connect the islands with the mainland become overcrowded, making evacuations from the barrier islands to the mainland difficult. Timely evacuation depends on well-defined emergency evacuation plans used in conjunction with accurate flood forecasting and real-time tidal elevation information.
The National Ocean Service (NOS) adequately covers tidal data collection on the ocean and large bays, but in New Jersey little to no data were available for the back-bay areas. Tidal elevation in the back bays behave quite differently than the ocean due to the complex interaction between the wind-driven surface water movement and the shifting geometry of the inlets, bays, and rivers. For example, a slow-moving Nor’easter can retain tidal elevation levels in back bays and upstream rivers several feet higher than the ocean by trapping additional water and not allowing tides to recede normally. This results in flooded coastal and low-land communities along with bridges and causeways that link the barrier islands to the mainland.
New Jersey’s back-bay communities annually face the risk of catastrophic flooding from hurricanes and coastal storms. Weather forecasters, along with emergency management and transportation officials, require comprehensive and timely tidal elevation and meteorological data to make accurate flood forecasts and to plan and execute coastal hazard mitigation strategies. These strategies include coastal evacuation, multi-agency coordination, contingency plans and drills, zoning and building code recommendations, and proper design of physical structures, roads, and bridges.
The U.S. Geological Survey (USGS), in cooperation with the New Jersey Department of Transportation (NJDOT), designed and installed the New Jersey Tide Network (NJTN) with assistance from NOS in 1997. The system continues to be operated in cooperation as part of a statewide network of tide gages, weather stations, and stream gages collecting invaluable data in real time. The NJTN supplies real-time tide-level and meteorological data for flood-prone areas along the New Jersey shore and back bays to critical decision-making centers and the publicly-available world wide web.
The USGS New Jersey Water Science Center is responsible for overall project coordination along with operation and maintenance of all instrumentation and remote data-collection platforms.
NEW JERSEY TIDE NETWORK
The NJTN presently consists of 31 tide gages, 28 weather stations, and 30 tidal crest-stage gages in 13 New Jersey counties, along the coastal regions of New Jersey, including the barrier islands, the back bays, the near-shore environments from Hackensack to Cape May, The Delaware Bay, and the Delaware River. The tidal elevation at each of the tide gages is averaged at 6-minute intervals, stored by a data collection platform (DCP), and transmitted via satellite to the Water Data for the Nation webpages.
Real-Time Tide Network
Tide Monitoring Equipment
Click on images below for more information
Storm Impact Studies
“The NJWSC NJ Tide Network was fully prepared to capture any storm, that is... until Hurricane Sandy in October 2012.
October 29, 2012
Hurricane Sandy
Changed Everything
Of the 24 real-time tide gages in operation in 2012, only seven recorded an uninterrupted tide signature over the course of the storm and four of those were south of Atlantic City. Six additional gages experienced real-time data interruptions, but accurate peaks were captured by the co-located tidal crest-stage gage (TCSG). The remaining 11 tide gage peaks were estimated based on high-water marks (HWMs) collected nearby. Four gages located in Newark, South Amboy, Seaside Heights, and Waretown suffered structural damaged with the latter two damaged beyond repair.
Storm Hardening our Gages
The New Jersey USGS 01409124 Barnegat Bay near Waretown, New Jersey as it was before Hurricane Sandy, what was found post Hurricane Sandy, and as it exists following the Storm Hardening procedures
Hurricane Sandy was a major coastal storm that affected many coastal communities in New Jersey. Our continuous tidal elevation network is important for various reasons over the range of the tidal cycle but are especially needed for extreme events like the one caused by Hurricane Sandy. These data are used by Emergency Management during the storm and decisionmakers post storm to help assess damage and appropriately plan.
Hurricane Sandy identified vulnerabilities in our network infrastructure. Following the storm, we assessed gages that needed to be storm hardened to ensure that our equipment continued to collect data for the duration of future extreme storm events. Some tide gages were adequately hardened as they stood, however, most of the existing gages needed upgrades to enhance storm resiliency. These upgrades involved elevating our sensors and other equipment above the tidal base flow elevation (BFE). Depending on site specific surroundings and existing infrastructure, this was accomplished by relocating gages to bridges, installing large 3- or 4-pile wooden platforms in the water, or by installing large aluminum platforms at the edge of water. Additional network enhancements included installing redundant tidal elevation sensor at each tide gage as backup in case the primary sensor gets damaged. The tide network was also enhanced with weather stations at each of the gages, which monitor air temperature, relative humidity, barometric pressure, and wind speed, direction, and gust. Precipitation is measured as well.
The New Jersey Tide Network has spawned many other programs and monitoring networks
New Jersey Coastal Weather Network
The weather stations measure, store, and transmit tide levels and meteorological data — rainfall, windspeed and direction, air temperature, relative humidity, and barometric pressure — using satellite telemetry.
Estimating Daily Upstream Location of the Freshwater-Saltwater Interface in New Jersey
Title
New Jersey Coastal Camera Network
To view the Webcam click on the number to see the location and click "Learn More"