U.S. flag

An official website of the United States government

Images

Images intro.
Islands of Hawaii overlaid with colors representing rainfall. Dark blue & green is more rain, yellow and orange less rain
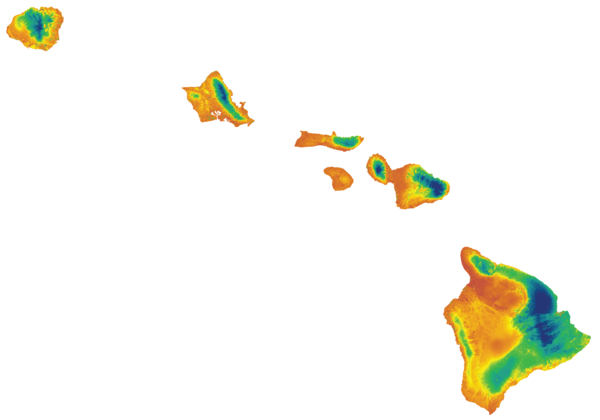
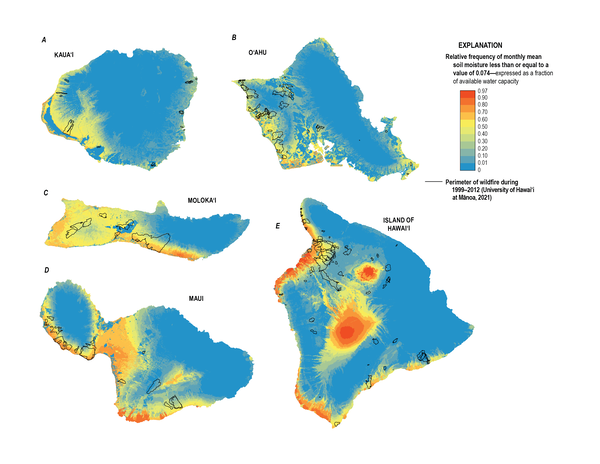
Distribution of mean annual recharge for 1978–2007 climate and 2017 land-cover conditions for the Hawaiian Islands

Map showing distribution of mean annual recharge for 1978–2007 climate and 2020 land-cover conditions for Kaua‘i, O‘ahu, Moloka‘i, Lāna‘i, Maui, and the Island of Hawai‘i.

Purple positive values=more rainfall. Orange-brown negative values=less rainfall.
Projected mean annual rainfall anomaly

Map of mean annual rainfall anomalies of three future-climate scenarios for Maui (A) Statistical Downscaling (SD) Representative Concentration Pathway (RCP) 8.5 2041–71 scenario from Elison Timm and others (2015), (B) SD RCP8.5 2071–99 scenario from Elison Timm and others (2015), (C) Hawai‘i Regional Climate Model A1B 2080–99 scenario from Zhang and others (201

Map of mean annual rainfall anomalies of three future-climate scenarios for Maui (A) Statistical Downscaling (SD) Representative Concentration Pathway (RCP) 8.5 2041–71 scenario from Elison Timm and others (2015), (B) SD RCP8.5 2071–99 scenario from Elison Timm and others (2015), (C) Hawai‘i Regional Climate Model A1B 2080–99 scenario from Zhang and others (201

see caption
How Often Will Maui’s Soils Run Dry? Projected Impacts of Drought, Climate, and Land Use

Maps showing estimated increases in relative frequency of monthly mean soil moisture less than or equal to a value of 0.074 for nine water-budget scenarios for Maui. A, Drought 3 scenario. B, Drought 3 Conversion 1 scenario. C, Drought 3 Conversion 2 scenario. D, Future Non-Drought scenario. E, Future Non-Drought Conversion 1 scenario.

Maps showing estimated increases in relative frequency of monthly mean soil moisture less than or equal to a value of 0.074 for nine water-budget scenarios for Maui. A, Drought 3 scenario. B, Drought 3 Conversion 1 scenario. C, Drought 3 Conversion 2 scenario. D, Future Non-Drought scenario. E, Future Non-Drought Conversion 1 scenario.

see caption
Baseline Frequency of Critically Low Soil Moisture Under Non-Drought Conditions Across the Hawaiian Islands

Maps showing the relative frequency of monthly mean soil moisture less than or equal to a threshold value of 0.074 during a  Non-Drought scenario for Kauaʻi (A), Oʻahu (B), Molokaʻi (C), Maui (D), and the Island of Hawaiʻi (E).

A model shows the process of cloud-water interception in the island environment.
Water Cycle Image.jpg

This image shows the cloud-water interception process in an island environment like the Hawaiian islands.

This image shows the cloud-water interception process in an island environment like the Hawaiian islands.

Photo of forested area overlooking the ocean in Kahanahāiki, Oʻahu.
Kahanahaiki_Oahu.JPG

Photo of green forested area and blue sky overlooking the ocean in Kahanahāiki, Oʻahu on a sunny day.

Photo of green forested area and blue sky overlooking the ocean in Kahanahāiki, Oʻahu on a sunny day.

Photo of misty clouds in a forested area of Alakaʻi Wilderness Preserve, Kauaʻi.
Alaka'i_cloud_forest2_Kauai.JPG

Photo of misty clouds in a forested area of Alakaʻi Wilderness Preserve, Kauaʻi.

Photo of a lush green forested area around Makamaka‘ole Stream near Kānoa Ridge, Maui.
Makamaka'ole_Stream_Maui_portrait.JPG

Photo of a lush green forested area around Makamaka‘ole Stream near Kānoa Ridge, Maui.

Photo of lush green forested area around Makamaka‘ole Stream near Kānoa Ridge, Maui.
Makamaka'ole_Stream_Maui_landscape.JPG
Lanscape in Nakula, Maui
Nakula_cloud_forest_Maui.JPG

Cloud covered forest landscape in Nakula, Maui with outlines of trees in the distance.

Freshwater waterfall in lush green forest area in Wailua Iki Falls, Maui.
Wailua_Iki_Falls_Maui.JPG

Freshwater waterfall in lush green forested area named Wailua Iki Falls, Maui.

People sitting on a lawn during a ceremony
Celebration for the creation of a new USGS facility

Federal, state, local and University of Hawai´i leaders and students celebrate the creation of a new facility that will monitor volcanoes and support conservation science.

Before and after views of a water fall.  First shows light flow of water over the falls, the second shows heavy flow.
Impact of Hurricane Lane on Wailuku River

Two views from the Rainbow Falls overlook, downstream of the Wailuku River streamgage near Hilo, Hawaii. The image on the left shows a typical base flow of about 35 cubic feet per second (cfs). The image on the right shows the early impact of Hurricane Lane with a flow of about 26,000 cfs taken at 8:35 a.m. HST, August 23, 2018. This U.S.

Two views from the Rainbow Falls overlook, downstream of the Wailuku River streamgage near Hilo, Hawaii. The image on the left shows a typical base flow of about 35 cubic feet per second (cfs). The image on the right shows the early impact of Hurricane Lane with a flow of about 26,000 cfs taken at 8:35 a.m. HST, August 23, 2018. This U.S.

Was this page helpful?