U.S. flag

An official website of the United States government

Images

Pacific Coastal and Marine Science Center images.

Filter Total Items: 1369
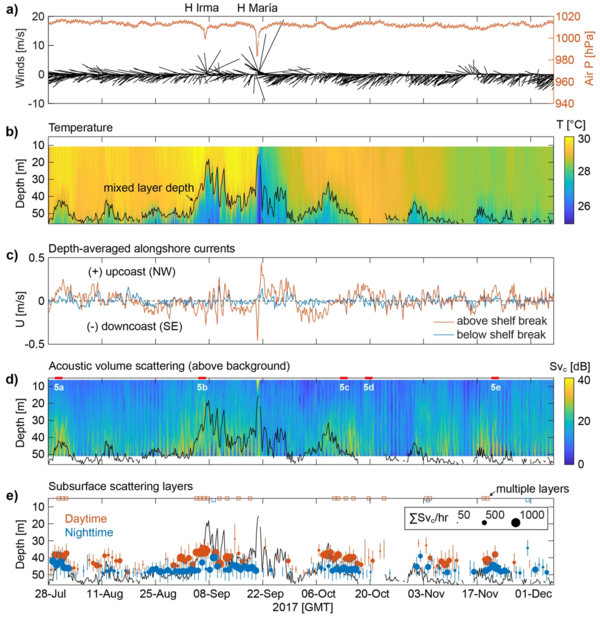
Chart showing time-series from the entire 132-day deployment off the southwest Puerto Rico coast

Time-series from the entire 132-d deployment. a Wind velocity (black vectors, left axis), and barometric pressure (orange line, right axis) measured by the Ponce buoy; the timing of two major tropical cyclones (TC), Irma and Maria, are labeled and correspond to the sharp dips in barometric pressure.

Time-series from the entire 132-d deployment. a Wind velocity (black vectors, left axis), and barometric pressure (orange line, right axis) measured by the Ponce buoy; the timing of two major tropical cyclones (TC), Irma and Maria, are labeled and correspond to the sharp dips in barometric pressure.

Maps of five study sites spread across the conterminous United States, Alaska, and the Island of Puerto Rico
Comparisons of Shoreline Positions from Satellite-Derived and Traditional Field- and Remote-Sensing Techniques

Maps of five study sites spread across the conterminous United States, Alaska, and the Island of Puerto Rico and descriptions of each site’s coastal setting. From the study Comparisons of Shoreline Positions from Satellite-Derived and Traditional Field- and Remote-Sensing Techniques.

Photo showing collection of sediment samples used for grain size analysis
Picture of surveyor equipped with survey equipment during mapping mission
Cover image for Hawai'i Abyssal Nodules Expedition video

In Fall 2025 the Hawaiʻi Abyssal Nodules and Associated Ecosystems Expedition, led by USGS scientists, will investigate the geology, minerals, and environmental setting of the deep seabed offshore Moku o Keawe (Hawaiʻi Island) in the U.S. Exclusive Economic Zone. This work is part of ongoing collaborative efforts with BOEM and NOAA.

In Fall 2025 the Hawaiʻi Abyssal Nodules and Associated Ecosystems Expedition, led by USGS scientists, will investigate the geology, minerals, and environmental setting of the deep seabed offshore Moku o Keawe (Hawaiʻi Island) in the U.S. Exclusive Economic Zone. This work is part of ongoing collaborative efforts with BOEM and NOAA.

Was this page helpful?