Tsunami Generation from the 2004 M=9.1 Sumatra-Andaman Earthquake
The December 26, 2004 magnitude (M) 9.1 Sumatra-Andaman earthquake occurred along a tectonic subduction zone in which the India Plate, an oceanic plate, is being subducted beneath the Burma micro-plate, part of the larger Sunda plate. The boundary between the downgoing and overriding plates of the subduction zone is marked by the Sunda Trench above.
Here we provide a brief overview of the tectonic setting and seismological characteristics of the earthquake, as well as a summary of tsunami generation modeling for this event and the March 28, 2005 M=8.6 northern Sumatra earthquake.
Tectonics of Sumatra-Andaman Islands
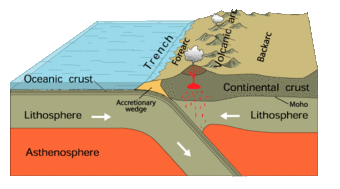
this figure is taken from the online edition of This Dynamic Earth
The December 26, 2004 M=9.1 Sumatra-Andaman earthquake occurred along a tectonic subduction zone in which the India Plate, an oceanic plate, is being subducted beneath the Burma micro-plate, part of the larger Sunda plate.
The interface between the two plates results in a large fault, termed an interplate thrust or megathrust. This fault lies below the southwestern part of Sumatra and the Andaman Islands. Where the interplate thrust intersects the sea floor is marked by the Sunda trench that can traced along an arc from Burma in the north to Java in the south. The map, based on info from the USGS Earthquake Hazards Program, shows:
- the interplate thrust where it interesects the sea floor along the Sunda trench,
- the epicenter of the December 26, 2004 mainshock, and
- major strike slip faults in the overriding plate of the subduction zone.
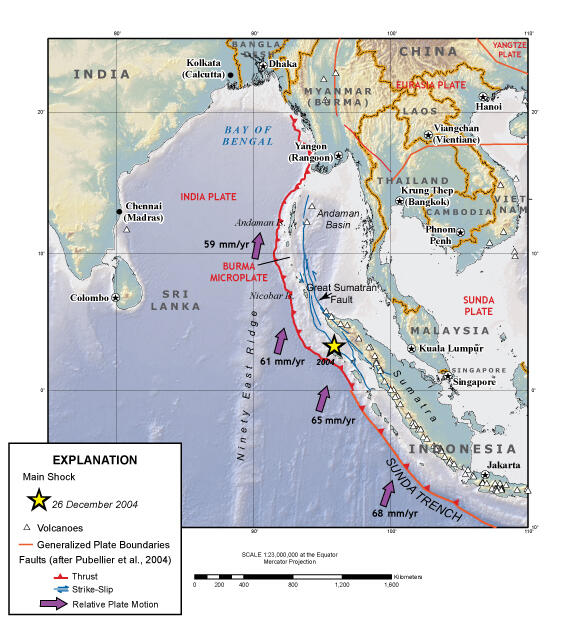
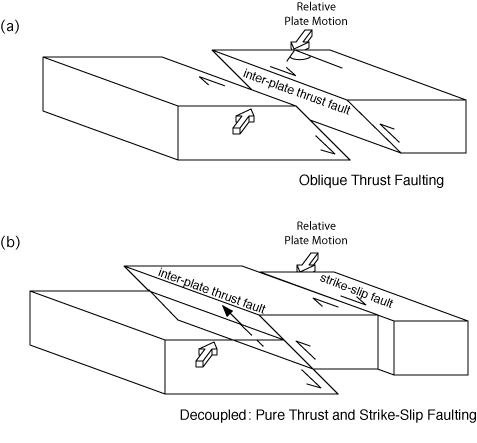
The direction of convergence of the India Plate relative to the Sunda plate (thick arrows on map) is oriented oblique to the orientation of the interplate thrust (i.e., trench axis). For oblique subduction zones such as this, movement between the two plates can be accomodated one of two ways as shown in the block diagram (Michael, 1990).
As described in a classic paper by Fitch (1972), the Sumatra subduction zone is characterized by decoupled faulting, as in (b). In this case, nearly pure thrust faulting occurs along the interplate thrust and strike-slip faulting occurs in the overriding plate, most notably along the Great Sumatran fault.
An example of oblique faulting, as in (a), occurs in the northern Puerto Rico subduction zone.
Seismological Aspects of Tsunami Generation
Several seismological aspects of the 2004 Sumatra-Andaman earthquake are important in explaining the tsunami that was generated:
- Magnitude,
- Mechanism, and
- Centroid.

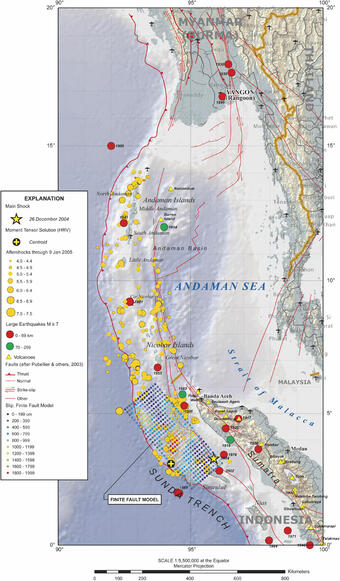
Magnitude
The magnitude (M) of a submarine earthquake is, in most cases, the most important factor that determines the size of a tsunami. Because of the size and complexity of this earthquake, it has been difficult to assign a precise magnitude. A magnitude of M=9.1 seems to be most appropriate for tsunami studies as ascertained from analysis of seismograms and geodetic data (Banerjee et al., 2007; Chlieh et al., 2007).
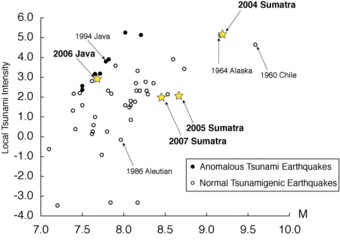
The plot shows local tsunami intensity (a function of maximum tsunami runup) plotted against the moment magnitude of the earthquake (Mw) for a number of tsunamis that occurred in the past century.
Near the earthquake source, local tsunami size increases with the magnitude of the earthquake, although there is significant variability in this relationship. The term tsunami earthquake refers to anomalous earthquakes, in which the tsunami is larger than expected from the magnitude of the earthquake. These earthquakes tend to rupture the interplate thrust near where it approaches the sea floor at the trench. Although the local tsunamis from tsunami earthquakes (solid dots on plot) are larger than would generally be expected from earthquake magnitude alone, local tsunami intensity trends linearly with magnitude. In contrast, the intensity of local tsunamis from normal tsunamigenic earthquakes do not trend exactly with magnitude.
The size of 2004 Indian Ocean local tsunami is consistent with the size of local tsunamis generated by other earthquakes of similar magnitude, for example the 1964 Great Alaska earthquake and tsunami. The Earthquake Research Institute (University of Tokyo) has calculated the tsunami magnitude for the 2004 Indian Ocean tsunami and has shown that it is consistent with such a high magnitude earthquake. Though local tsunami runups are among the highest ever recorded (nearly 32 meters), this earthquake does not appear to be an anomalous tsunami earthquake.
Mechanism
Consistent with the decoupled tectonics of the Sumatra subduction zone described earlier, the focal mechanism for the 2004 Sumatra-Andaman earthquake shows that rupture occurred on the interplate thrust with very little oblique motion.
This focal mechanism is associated with the southern part of fault rupture near the epicenter. However, this was a very long rupture extending from the epicenter northward to the Andaman Islands, as indicated by the analysis of seismic array data. A more complete analysis of the focal mechanicsm by Tsai et al. (2005) indicates that oblique motion occurred on the northern part of the fault rupture.
When nearly all of an earthquake's energy is released in a thrust motion, as in the 2004 Sumatra-Andaman earthquake, a large tsunami is generated. In contrast, large strike-slip earthquakes, involving more horizontal than vertical displacement of the sea floor, are not efficient tsunami generators.
Aftershocks occurred on both the interplate thrust and faults in the overriding plate, including the transcurrent fault.
Centroid
The centroid of an earthquake is the location of the center of energy release. The location of the 2004 Sumatra-Andaman centroid, as determined by Harvard University, is near the trench (black circle with yellow plus sign on map). This centroid location indicates that most of the energy release from the earthquake took place in deep water. This generally results in an initial tsunami with larger potential energy than a tsunami generated by a similar rupture located closer to shore beneath shallower water. This is discussed in our comparison of the tsunamis generated by the 2004 Sumatra-Andaman earthquake and the March 28, 2005 northern Sumatra earthquake.
For additional information regarding the earthquake and tsunami, see Roger Bilham's site at the Cooperative Institute for Research in Environmental Sciences (CIRES).
Details of Tsunami Generation

The tsunami from the 2004 M=9.1 Sumatra-Andaman earthquake was primarily caused by vertical displacement of the seafloor, in response to slip on the inter-plate thrust fault (see Tectonics section above).
During the 2004 Sumatra-Andaman earthquake, the seafloor on the overriding Burma plate deformed vertically, uplifting seaward toward the trench and downdropping (subsiding) landward toward the coastline. The line in map view where offshore uplift gives way to subsidence near the coast is termed the hingeline.
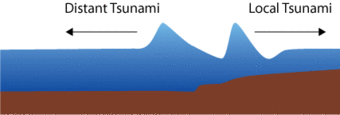
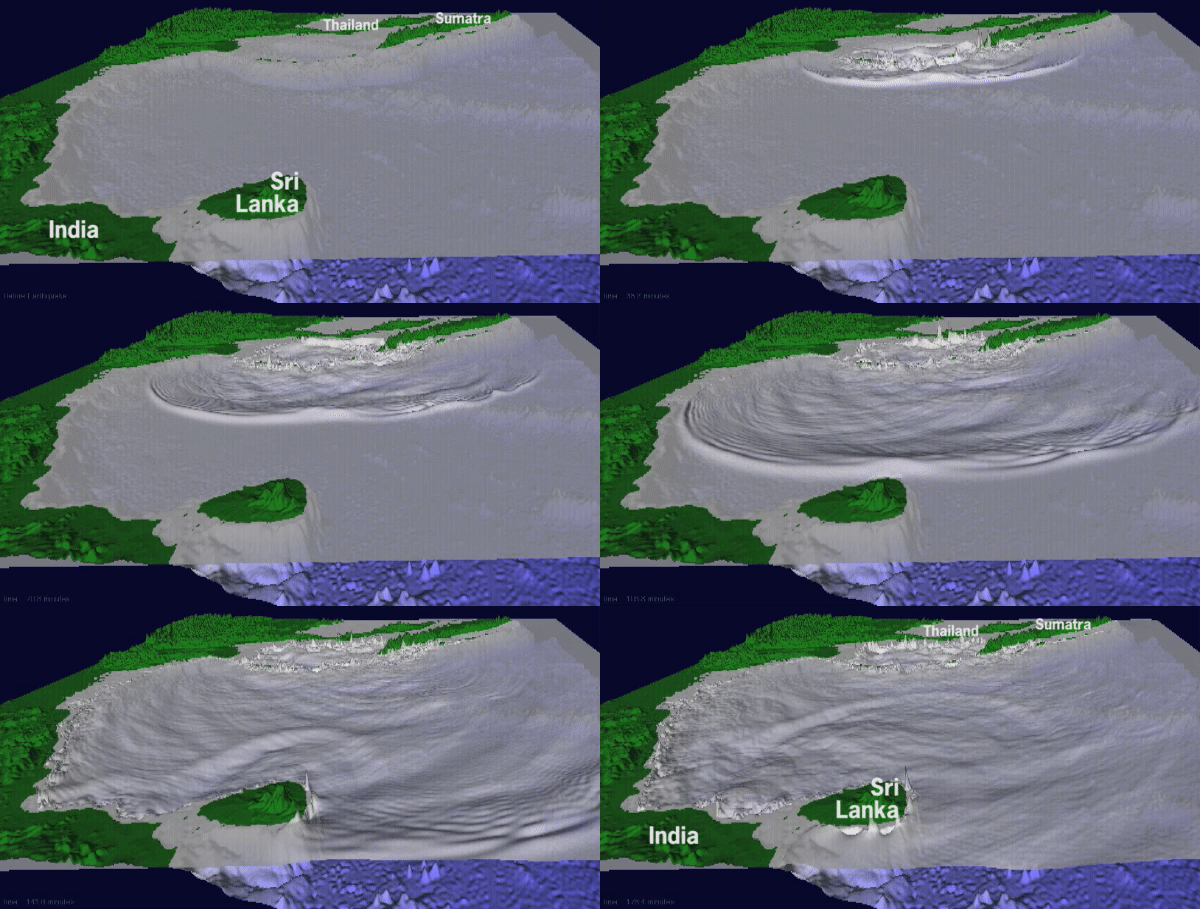
Vertical displacement of the water column approximates that of the seafloor below, resulting in the initial "N-shaped" tsunami wave that is typically generated by subduction earthquakes. This N-wave then splits in two, resulting in a pair of N-waves traveling in opposite directions. One, the distant tsunami, propagates outbound across the Bay of Bengal towards India and Sri Lanka, eventually reaching the Atlantic and Pacific Oceans. The other, the local tsunami, travelled towards Indonesia, Thailand, and nearby islands in less than an hour.
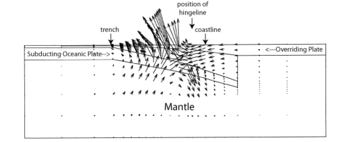
The length of the fault that ruptured during this earthquake was massive, extending from northwest Sumatra north to the Andaman Islands. In tsunami models, because of its size, we have to include the time it takes for the 2004 earthquake to unzip along the fault. Like a propagating crack in a frozen lake, the rupture front for this earthquake moved at a high speed of approximately 2.5 km/s, typical for subduction zone earthquakes. It took approximately 8 minutes for the rupture front to propagte from the hypocenter to the end of its journey 1200 km away (approximately the length of California!). In tsunami models for smaller magnitude earthquakes, the displacement of the seafloor caused by an earthquake is assumed to occur instantaneously, since tsunami waves move more slowly than fault rupture.
Shown below is an animation of both the northward propagation of the rupture front and an exaggeration of the vertical movement of the seafloor. (The water has been removed in this animation.) The seafloor is colored red where it moves upward and colored blue where it moves downward. Islands that straddle the regions of upward and downward movement tilt about the hingeline as shown below. Coral reefs on the up thrown side are permanently exposed, similar to what was observed from field studies after the March 28, 2005 northern Sumatra earthquake.
Animation: Vertical movement of the seafloor over the 2004 Sumatra-Andaman earthquake, view to the northwest, water removed
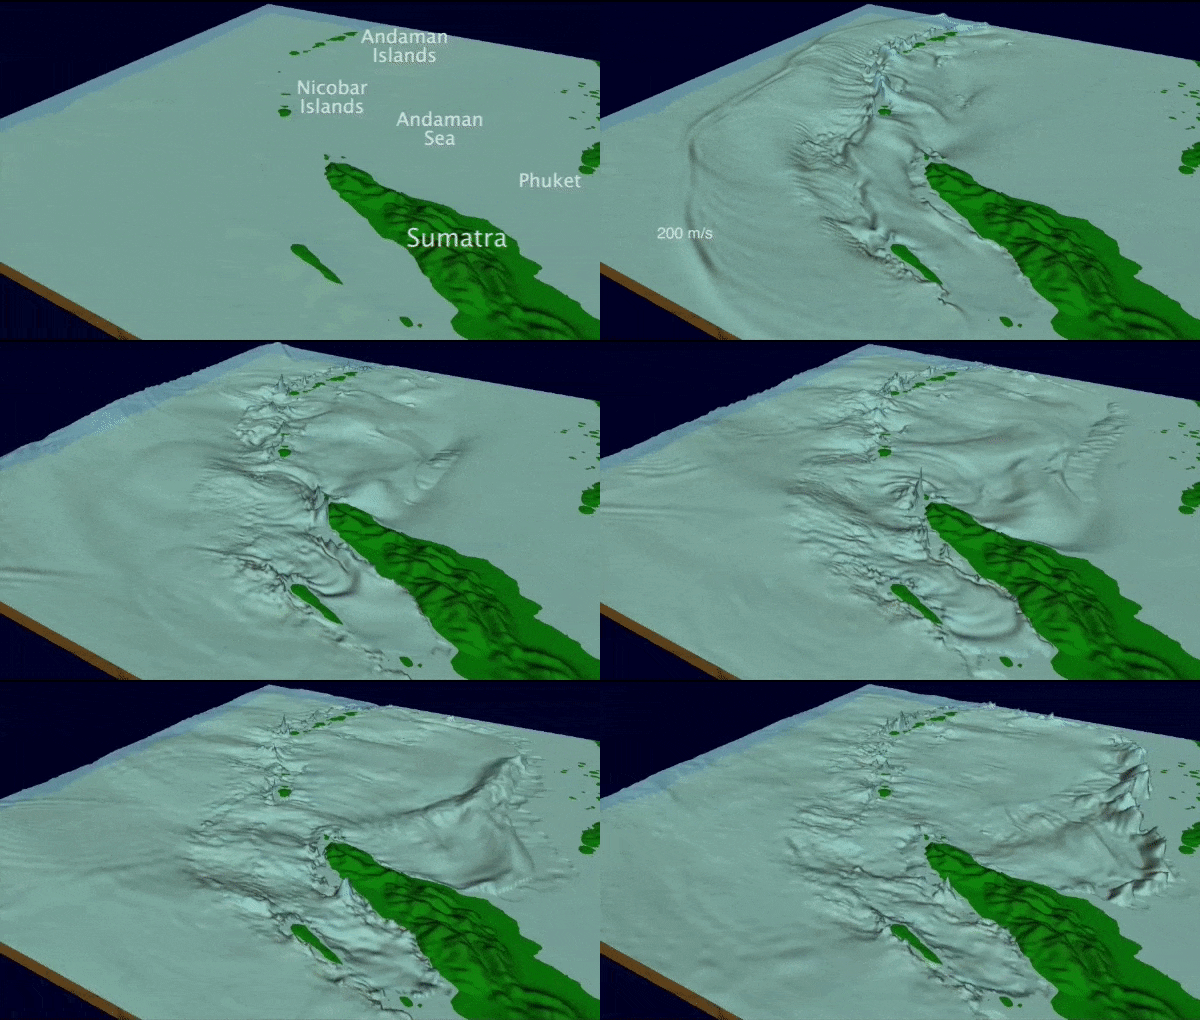
Now we can add water onto the simulation above to see how the tsunami waves move away from earthquake source region. As shown in the animation below, by the time the earthquake rupture reaches the Andaman Islands, the tsunami waves generated at the initiation of rupture have traveled part way into the Bay of Bengal.
Animation: Tsunami waves, view to the northwest
Tsunami Measurements from Space
Most instrumental measurements of tsunamis are from tide gauge stations, and more recently, bottom pressure recorders in the deep ocean. During the 2004 Indian Ocean tsunami was the first time that satellites collected transects of sea-height data using radar altimetry that clearly showed a tsunami signal during its propagation across the Indian Ocean.
It was by coincidence that the satellites passed over the Indian Ocean at the same time that the first part of the tsunami was propagating from the Sumatra-Andaman source region. Jason-1 yielded the best data to shed light on tsunami generation for this event: this satellite collected almost continuous sea-height data just two hours after the earthquake. Five minutes later, the Topex-Poseidon satellite (a tandem mission with Jason-1) collected intermittant sea-height data of the tsunami. The Envisat and GeoSat Follow-On (GFO) satellites captured sea-height data 3:15 and 7:10 hours after the earthquake, respectively.
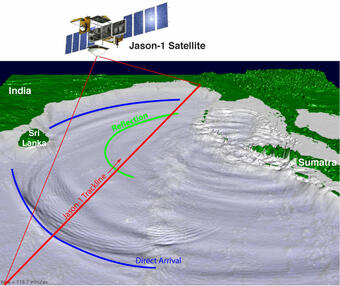
Because the ground speed for the Jason-1 satellite is 5.8 km/s, much faster than tsunami propagation, the data can be thought of as a snapshot of tsunami amplitudes along the Jason-1 trackline (red line). In the computer model of the wavefield shown here, the blue arc represents the wavefront of the distant (far-field) tsunami that emanated directly from the source (i.e., seafloor deformation from movement on the inter-plate thrust). This part of the tsunami wavefield is termed the direct arrival and has almost arrived at India at this time. The smaller amplitude waves that trail behind the blue arc are an effect of dispersion, where shorter wavelength components travel at a slightly slower speed than the wavefront. The green arc represents one of many tsunami refelctions from coastlines and submerged bathymetric features that are also detected and measured by satellite radar altimetry. Jason-1 measured the height of the tsunami wave where its trackline crossed these arcs. To the east, the local tsunami continues to cause major wave action along the Sumatran coast.
Animation: Simulated view of the tsunami waves looking southeast
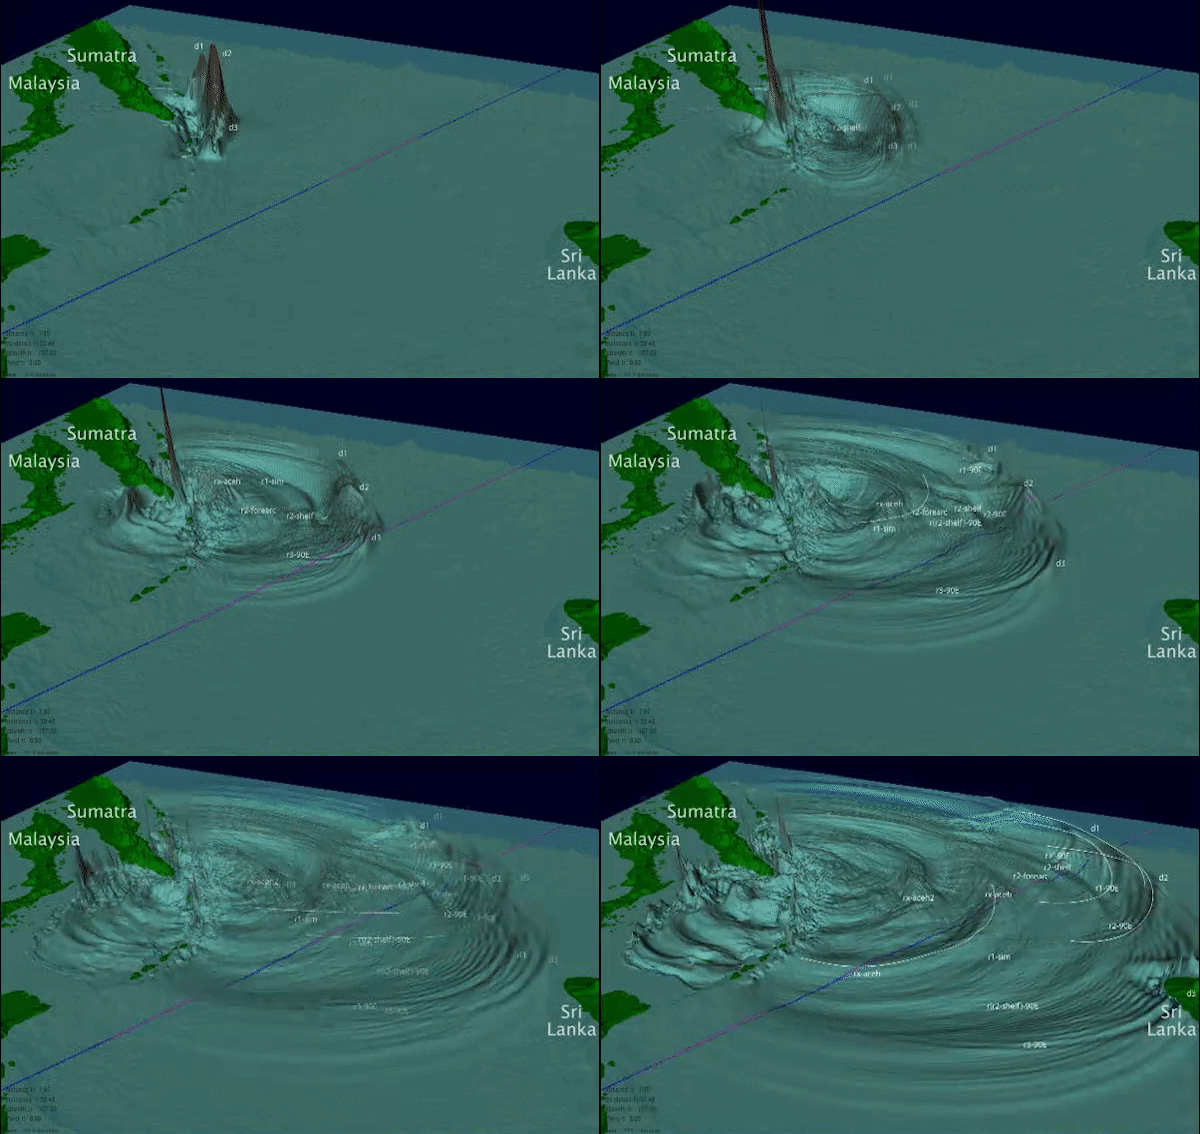
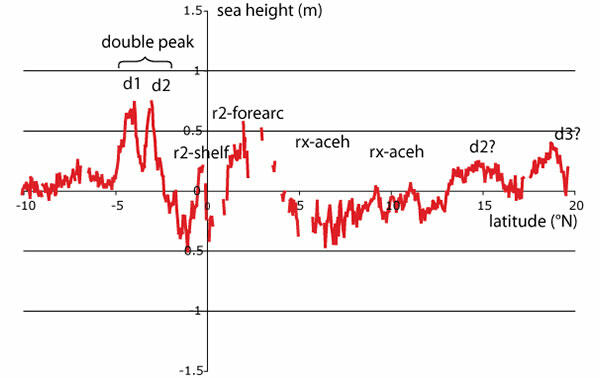
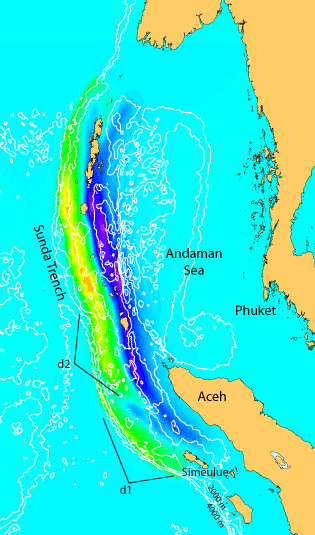
A stochastic slip model can be used to represent many different rupture patterns that are consistent with the frequency content observed on seismograms. Shown in the next figure is the vertical displacement of the seafloor for the slip model that best reproduces the double-peak in the Jason-1 satellite altimetry data. Possible source regions that give rise to tsunami phases d1 and d2 are labeled. Other possible sources such as secondary faulting can also explain the double peak.
Comparison with the March 28, 2005 Tsunami
Three months after the devastating 2004 Indian Ocean tsunami, a M=8.6 earthquake occured offshore northern Sumatra. Although there was intense strong ground shaking and heavy damage associated with this earthquake, the tsunami was much less than expected. We can understand the factors that influence tsunami severity by comparing this event with the 2004 Sumatra-Andaman earthquake and other earthquakes along the Sunda subduction zone.
There are three primary factors influence the variation in local tsunami severity:
- Earthquake magnitude
- Fault slip near trench
- Tsunami beaming
Each of these factors are described in more detail below. Animations of both the 2004 and 2005 events show how these factors combine to produce very different tsunamis.
Earthquake Magnitude

The plot shows local tsunami intensity as a function of earthquake magnitude (M) for a number of tsunamis that have occurred in the past century. Recent tsunamis generated by earthquakes along the Sunda subduction zone are indicated by the yellow stars. In general, tsunami size increases with earthquake magnitude, although there is significant variation in this relationship.
The size of 2004 Indian Ocean local tsunami is consistent with the size of local tsunamis generated by other earthquakes of similar magnitude, for example the 1964 Great Alaska earthquake and tsunami. The 2005 northern Sumatra earthquake and, to some extent, the 2007 southern Sumatra earthquake (M=8.4) are deficient in terms of the local tsunamis produced. In contrast, the 2006 Java earthquake produced a larger than expected tsunami and is among a class of earthquakes called tsunami earthquakes.
Fault Slip Near Trench

If slip during an inter-plate thrust earthquake occurs near the oceanic trench marking where the fault intersects the sea floor, three things happen to increase local tsunami severity: (1) rupture can break through to the trench, increasing slip on the fault; (2) vertical displacement will be greater because of the shallow fault depth below the sea floor; and (3), there will be greater shoaling amplification of the tsunami (see Panel 3 of Life of a Tsunami) because the vertical displacement is beneath deeper water.
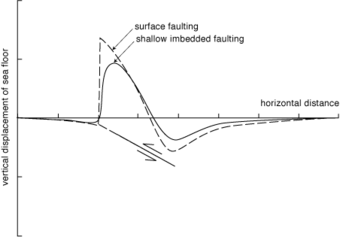
For the 2004 Sumatra-Andaman earthquake, the rupture started at the epicenter and spread throughout the region indicated by the finite fault model of the southern part of the rupture zone derived from global recordings of the earthquake. Analysis of the satellite altimetry data indicates that the southern rupture zone most likely extended to the Sunda Trench and broke through the sea floor as surface faulting. Holding all other parameters of the earthquake constant, a tsunami generated by a sea-floor rupture is greater than one generated by an earthquake that does not rupture the sea floor (i.e., imbedded faulting). The graph shows a comparison of the vertical displacement profiles for the two cases.
In addition, if vertical displacement of the sea floor occurs beneath deep water, then the tsunami become greater as it travels toward shore, owing to shoaling amplification.
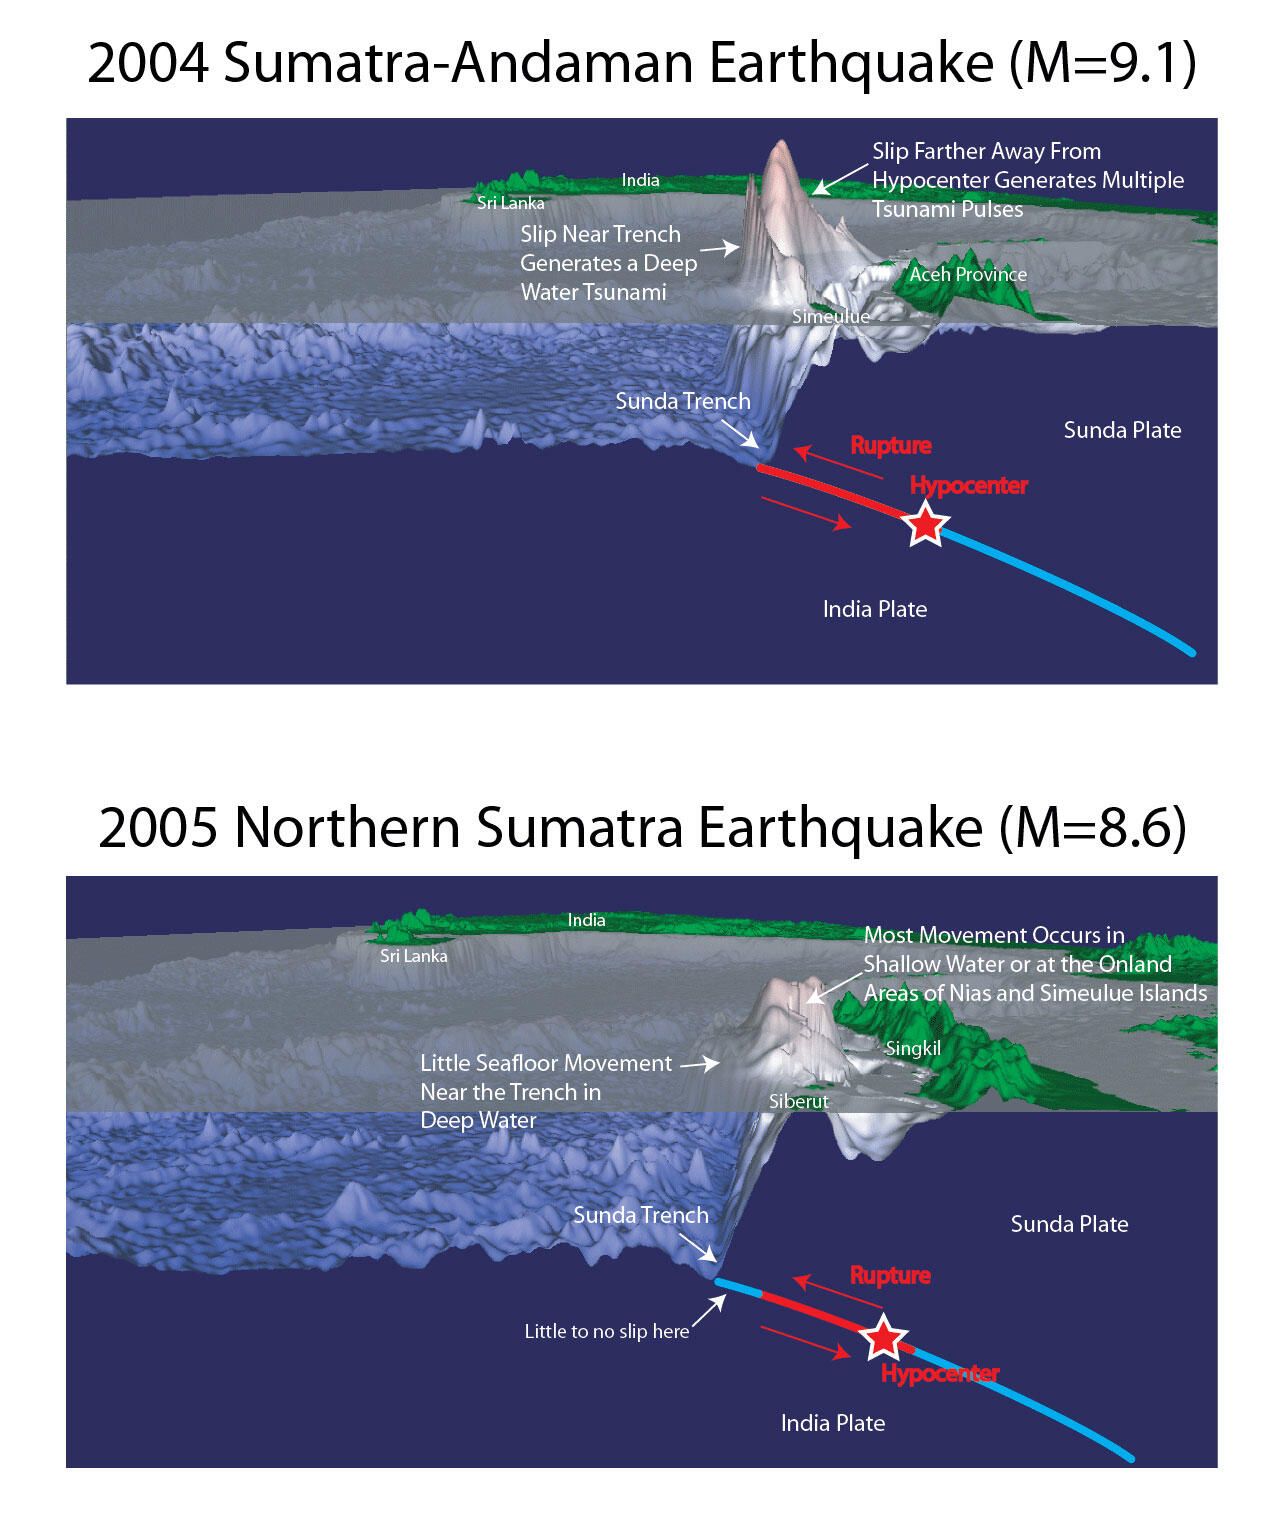
In the figure below, we show the difference between the initial tsunamis generated from the December 2004 (top) and March 2005 (bottom) caused by differences in earthquake magnitude as well as how close to the trench the fault ruptured.
Tsunami Beaming
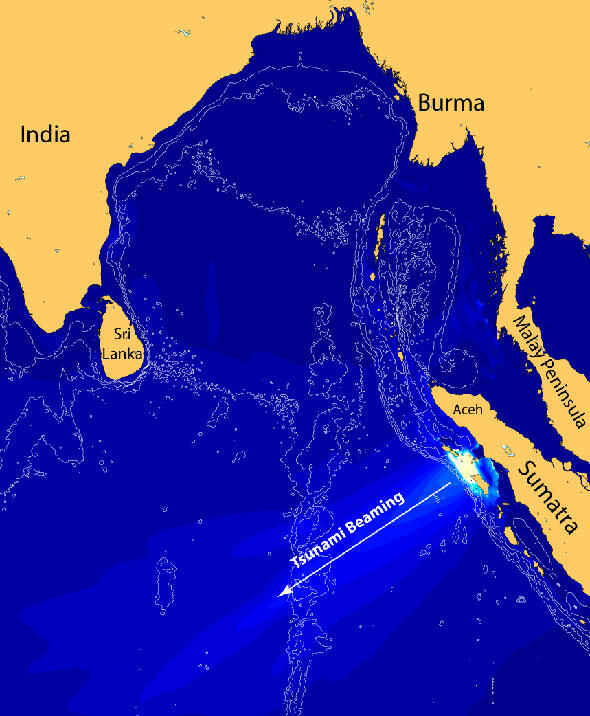
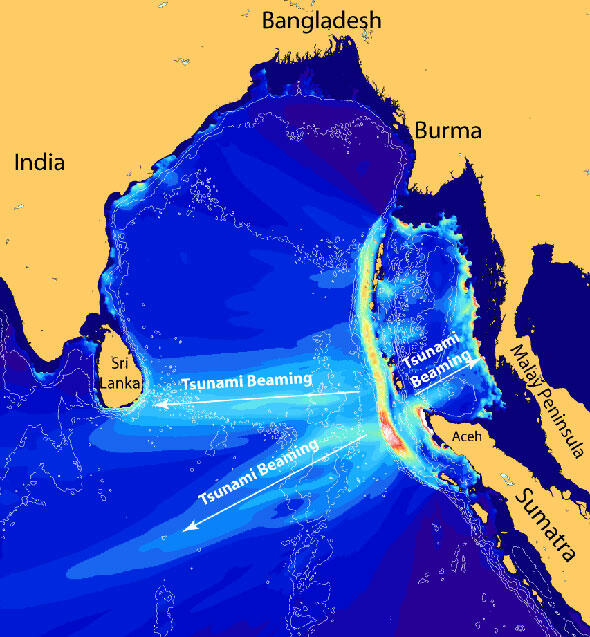
Tsunami beaming refers to the higher tsunami amplitudes in a direction perpendicular to fault orientation during open-ocean propagation. Although tsunami waves are often described as waves spreading out in all directions (like when you throw a pebble into a pond), for long earthquake ruptures, tsunami amplitudes are greater along the azimuth of tsunami beaming. Because the oceanic trench of subduction zones marks the orientation of inter-plate thrust, the tsunami beaming azimuth is also perpendicular to the orientation of the trench. Complexity of the earthquake source and refraction/scattering during propagation will affect the tsunami beaming pattern.
The tsunami beaming plots shown here are constructed by determining the maximum tsunami amplitude over four hours of propagation time. For the 2004 Sumatra-Andaman earthquake, the tsunami beaming pattern is particularly important for explaining high tsunami runup in Sri Lanka and the western coast of the Malay Peninsula.
For the 2005 northern Sumatra earthquake, tsunami beaming is directed south of Sri Lanka and essentially blocked by the island of Sumatra toward the Malay Peninsula.
Animations
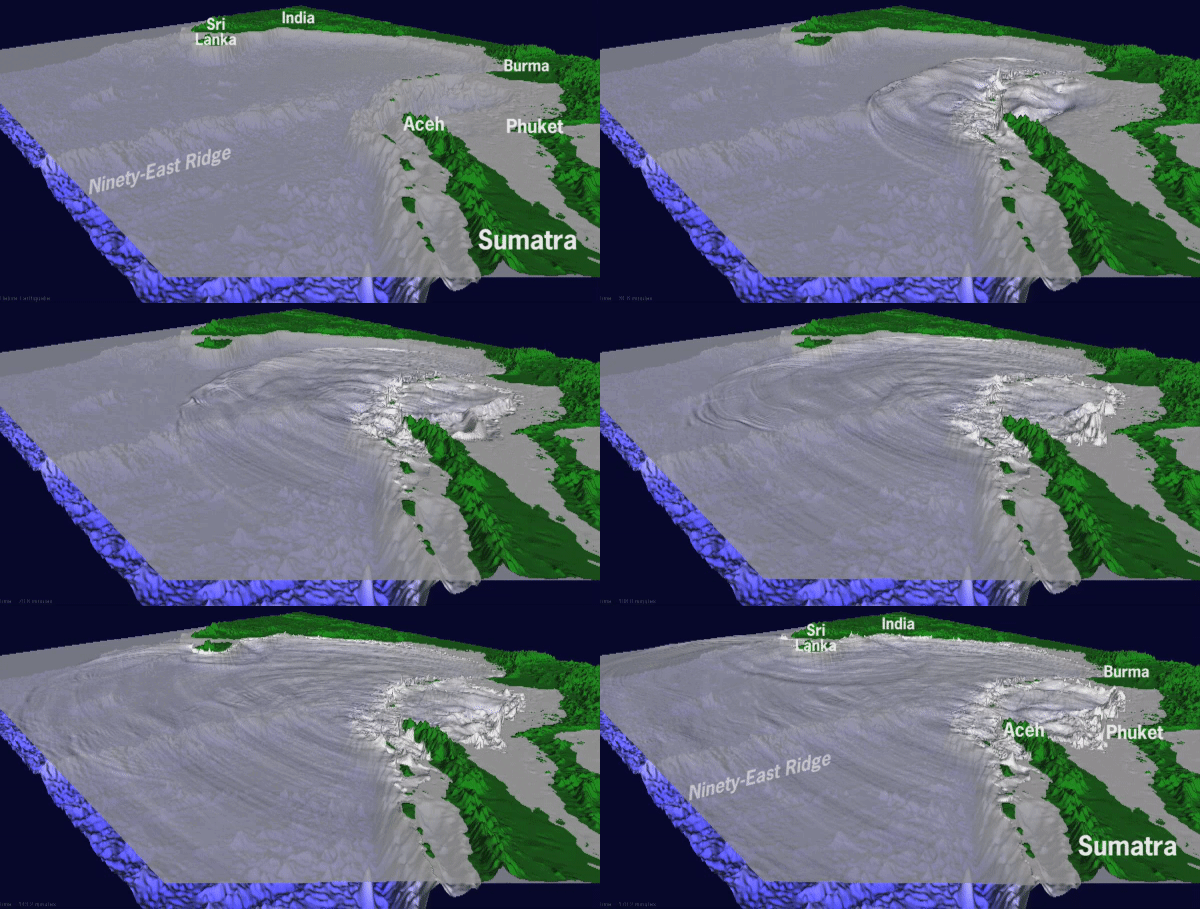
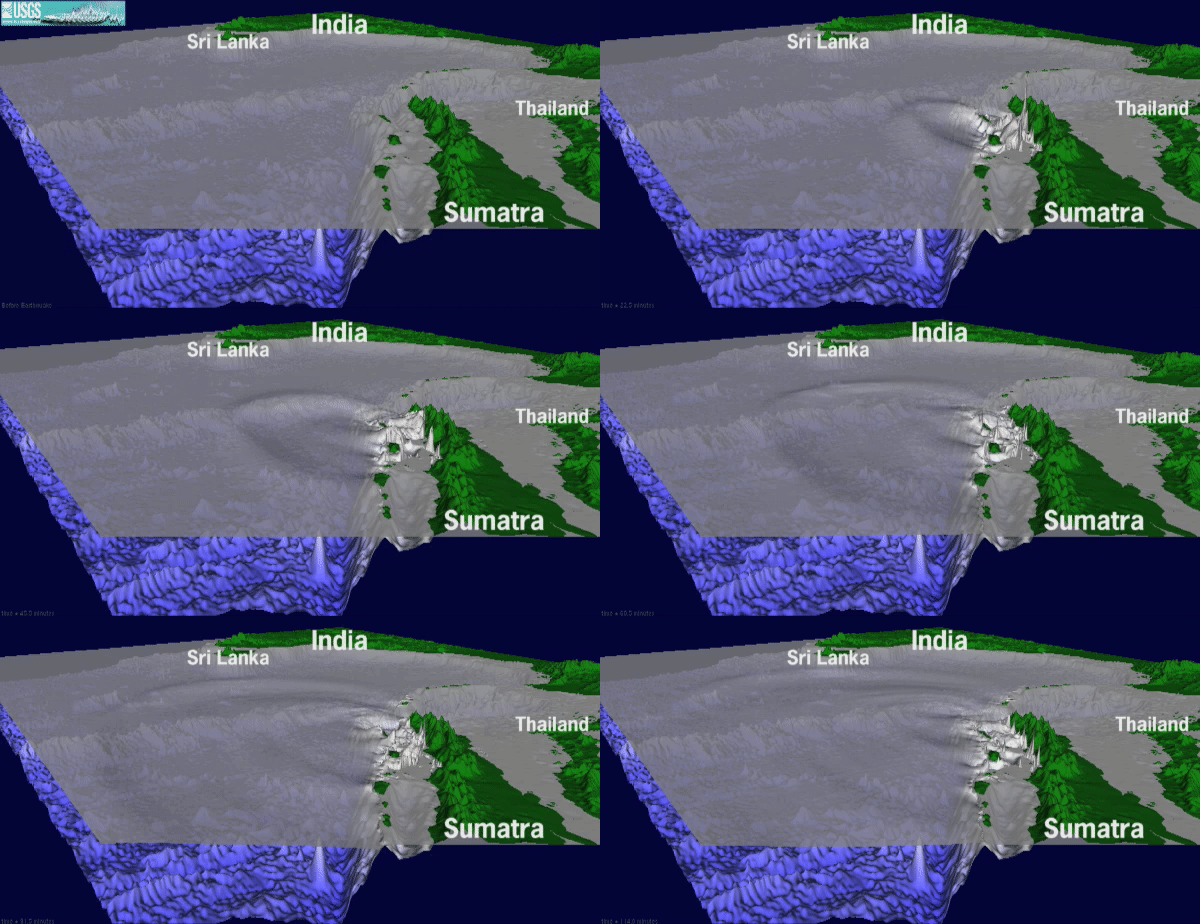
Another way to compare the open-ocean tsunamis between these two earthquakes is to look at the tsunami wavefield for each earthquake, as shown in the snapshots and animations below. In particular, note that the open-ocean wave length for the 2004 tsunami is shorter than for the 2005 tsunami. Because the 2005 tsunami was primarily generated in shallow water, as the wave travels into the deep ocean, it lengthens and decreases in amplitude (the reverse of shoaling amplification).
Tsunami wavefield for the 2004 Sumatra-Andaman earthquake 1 hour after generation, view to the northwest
Tsunami wavefield for the 2005 northern Sumatra earthquake 1 hour after generation, view to the northwest
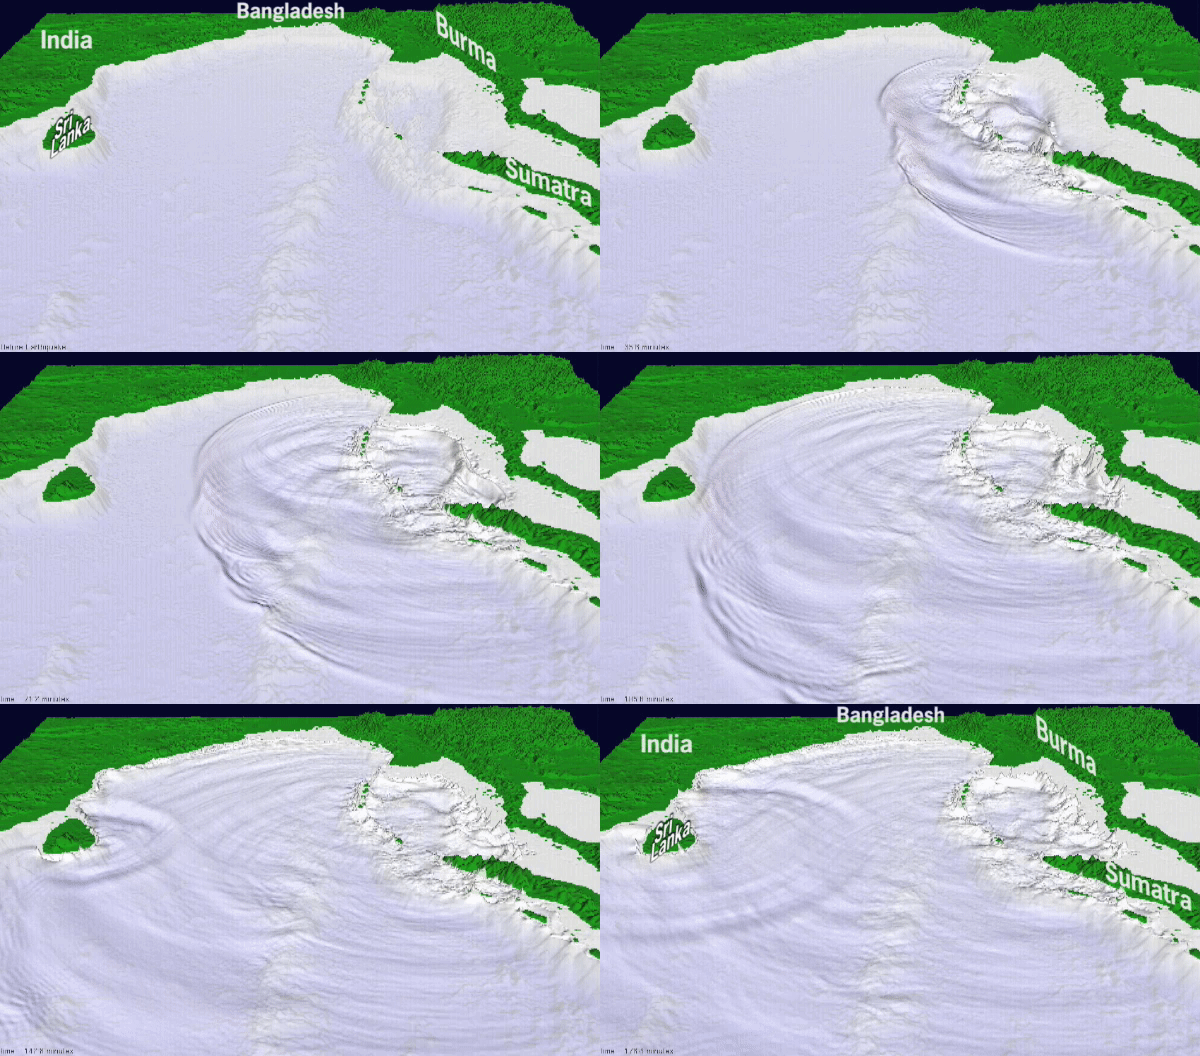
Below are other snapshots and animations of the 2004 tsunami from different view points.
Tsunami wavefield for the 2004 Sumatra-Andaman earthquake 1 hour after generation, view to the north
Tsunami wavefield for the 2004 Sumatra-Andaman earthquake 1 hour after generation, view to the east
Tsunami and Earthquake Research
Preliminary Simulations of Recent Tsunamis
Related publications
Implications of the 26 December 2004 Sumatra-Andaman earthquake on tsunami forecast and assessment models for great subduction-zone earthquakes Implications of the 26 December 2004 Sumatra-Andaman earthquake on tsunami forecast and assessment models for great subduction-zone earthquakes
Tsunami: wave of change Tsunami: wave of change
Differences in tsunami generation between the December 26, 2004 and March 28, 2005 Sumatra earthquakes Differences in tsunami generation between the December 26, 2004 and March 28, 2005 Sumatra earthquakes
The December 26, 2004 magnitude (M) 9.1 Sumatra-Andaman earthquake occurred along a tectonic subduction zone in which the India Plate, an oceanic plate, is being subducted beneath the Burma micro-plate, part of the larger Sunda plate. The boundary between the downgoing and overriding plates of the subduction zone is marked by the Sunda Trench above.
Here we provide a brief overview of the tectonic setting and seismological characteristics of the earthquake, as well as a summary of tsunami generation modeling for this event and the March 28, 2005 M=8.6 northern Sumatra earthquake.
Tectonics of Sumatra-Andaman Islands

this figure is taken from the online edition of This Dynamic Earth
The December 26, 2004 M=9.1 Sumatra-Andaman earthquake occurred along a tectonic subduction zone in which the India Plate, an oceanic plate, is being subducted beneath the Burma micro-plate, part of the larger Sunda plate.
The interface between the two plates results in a large fault, termed an interplate thrust or megathrust. This fault lies below the southwestern part of Sumatra and the Andaman Islands. Where the interplate thrust intersects the sea floor is marked by the Sunda trench that can traced along an arc from Burma in the north to Java in the south. The map, based on info from the USGS Earthquake Hazards Program, shows:
- the interplate thrust where it interesects the sea floor along the Sunda trench,
- the epicenter of the December 26, 2004 mainshock, and
- major strike slip faults in the overriding plate of the subduction zone.


The direction of convergence of the India Plate relative to the Sunda plate (thick arrows on map) is oriented oblique to the orientation of the interplate thrust (i.e., trench axis). For oblique subduction zones such as this, movement between the two plates can be accomodated one of two ways as shown in the block diagram (Michael, 1990).
As described in a classic paper by Fitch (1972), the Sumatra subduction zone is characterized by decoupled faulting, as in (b). In this case, nearly pure thrust faulting occurs along the interplate thrust and strike-slip faulting occurs in the overriding plate, most notably along the Great Sumatran fault.
An example of oblique faulting, as in (a), occurs in the northern Puerto Rico subduction zone.
Seismological Aspects of Tsunami Generation
Several seismological aspects of the 2004 Sumatra-Andaman earthquake are important in explaining the tsunami that was generated:
- Magnitude,
- Mechanism, and
- Centroid.


Magnitude
The magnitude (M) of a submarine earthquake is, in most cases, the most important factor that determines the size of a tsunami. Because of the size and complexity of this earthquake, it has been difficult to assign a precise magnitude. A magnitude of M=9.1 seems to be most appropriate for tsunami studies as ascertained from analysis of seismograms and geodetic data (Banerjee et al., 2007; Chlieh et al., 2007).
The plot shows local tsunami intensity (a function of maximum tsunami runup) plotted against the moment magnitude of the earthquake (Mw) for a number of tsunamis that occurred in the past century.
Near the earthquake source, local tsunami size increases with the magnitude of the earthquake, although there is significant variability in this relationship. The term tsunami earthquake refers to anomalous earthquakes, in which the tsunami is larger than expected from the magnitude of the earthquake. These earthquakes tend to rupture the interplate thrust near where it approaches the sea floor at the trench. Although the local tsunamis from tsunami earthquakes (solid dots on plot) are larger than would generally be expected from earthquake magnitude alone, local tsunami intensity trends linearly with magnitude. In contrast, the intensity of local tsunamis from normal tsunamigenic earthquakes do not trend exactly with magnitude.
The size of 2004 Indian Ocean local tsunami is consistent with the size of local tsunamis generated by other earthquakes of similar magnitude, for example the 1964 Great Alaska earthquake and tsunami. The Earthquake Research Institute (University of Tokyo) has calculated the tsunami magnitude for the 2004 Indian Ocean tsunami and has shown that it is consistent with such a high magnitude earthquake. Though local tsunami runups are among the highest ever recorded (nearly 32 meters), this earthquake does not appear to be an anomalous tsunami earthquake.
Mechanism
Consistent with the decoupled tectonics of the Sumatra subduction zone described earlier, the focal mechanism for the 2004 Sumatra-Andaman earthquake shows that rupture occurred on the interplate thrust with very little oblique motion.
This focal mechanism is associated with the southern part of fault rupture near the epicenter. However, this was a very long rupture extending from the epicenter northward to the Andaman Islands, as indicated by the analysis of seismic array data. A more complete analysis of the focal mechanicsm by Tsai et al. (2005) indicates that oblique motion occurred on the northern part of the fault rupture.
When nearly all of an earthquake's energy is released in a thrust motion, as in the 2004 Sumatra-Andaman earthquake, a large tsunami is generated. In contrast, large strike-slip earthquakes, involving more horizontal than vertical displacement of the sea floor, are not efficient tsunami generators.
Aftershocks occurred on both the interplate thrust and faults in the overriding plate, including the transcurrent fault.
Centroid
The centroid of an earthquake is the location of the center of energy release. The location of the 2004 Sumatra-Andaman centroid, as determined by Harvard University, is near the trench (black circle with yellow plus sign on map). This centroid location indicates that most of the energy release from the earthquake took place in deep water. This generally results in an initial tsunami with larger potential energy than a tsunami generated by a similar rupture located closer to shore beneath shallower water. This is discussed in our comparison of the tsunamis generated by the 2004 Sumatra-Andaman earthquake and the March 28, 2005 northern Sumatra earthquake.
For additional information regarding the earthquake and tsunami, see Roger Bilham's site at the Cooperative Institute for Research in Environmental Sciences (CIRES).
Details of Tsunami Generation

The tsunami from the 2004 M=9.1 Sumatra-Andaman earthquake was primarily caused by vertical displacement of the seafloor, in response to slip on the inter-plate thrust fault (see Tectonics section above).
During the 2004 Sumatra-Andaman earthquake, the seafloor on the overriding Burma plate deformed vertically, uplifting seaward toward the trench and downdropping (subsiding) landward toward the coastline. The line in map view where offshore uplift gives way to subsidence near the coast is termed the hingeline.

Vertical displacement of the water column approximates that of the seafloor below, resulting in the initial "N-shaped" tsunami wave that is typically generated by subduction earthquakes. This N-wave then splits in two, resulting in a pair of N-waves traveling in opposite directions. One, the distant tsunami, propagates outbound across the Bay of Bengal towards India and Sri Lanka, eventually reaching the Atlantic and Pacific Oceans. The other, the local tsunami, travelled towards Indonesia, Thailand, and nearby islands in less than an hour.

The length of the fault that ruptured during this earthquake was massive, extending from northwest Sumatra north to the Andaman Islands. In tsunami models, because of its size, we have to include the time it takes for the 2004 earthquake to unzip along the fault. Like a propagating crack in a frozen lake, the rupture front for this earthquake moved at a high speed of approximately 2.5 km/s, typical for subduction zone earthquakes. It took approximately 8 minutes for the rupture front to propagte from the hypocenter to the end of its journey 1200 km away (approximately the length of California!). In tsunami models for smaller magnitude earthquakes, the displacement of the seafloor caused by an earthquake is assumed to occur instantaneously, since tsunami waves move more slowly than fault rupture.
Shown below is an animation of both the northward propagation of the rupture front and an exaggeration of the vertical movement of the seafloor. (The water has been removed in this animation.) The seafloor is colored red where it moves upward and colored blue where it moves downward. Islands that straddle the regions of upward and downward movement tilt about the hingeline as shown below. Coral reefs on the up thrown side are permanently exposed, similar to what was observed from field studies after the March 28, 2005 northern Sumatra earthquake.
Animation: Vertical movement of the seafloor over the 2004 Sumatra-Andaman earthquake, view to the northwest, water removed

Now we can add water onto the simulation above to see how the tsunami waves move away from earthquake source region. As shown in the animation below, by the time the earthquake rupture reaches the Andaman Islands, the tsunami waves generated at the initiation of rupture have traveled part way into the Bay of Bengal.
Animation: Tsunami waves, view to the northwest

Tsunami Measurements from Space

Most instrumental measurements of tsunamis are from tide gauge stations, and more recently, bottom pressure recorders in the deep ocean. During the 2004 Indian Ocean tsunami was the first time that satellites collected transects of sea-height data using radar altimetry that clearly showed a tsunami signal during its propagation across the Indian Ocean.
It was by coincidence that the satellites passed over the Indian Ocean at the same time that the first part of the tsunami was propagating from the Sumatra-Andaman source region. Jason-1 yielded the best data to shed light on tsunami generation for this event: this satellite collected almost continuous sea-height data just two hours after the earthquake. Five minutes later, the Topex-Poseidon satellite (a tandem mission with Jason-1) collected intermittant sea-height data of the tsunami. The Envisat and GeoSat Follow-On (GFO) satellites captured sea-height data 3:15 and 7:10 hours after the earthquake, respectively.
Because the ground speed for the Jason-1 satellite is 5.8 km/s, much faster than tsunami propagation, the data can be thought of as a snapshot of tsunami amplitudes along the Jason-1 trackline (red line). In the computer model of the wavefield shown here, the blue arc represents the wavefront of the distant (far-field) tsunami that emanated directly from the source (i.e., seafloor deformation from movement on the inter-plate thrust). This part of the tsunami wavefield is termed the direct arrival and has almost arrived at India at this time. The smaller amplitude waves that trail behind the blue arc are an effect of dispersion, where shorter wavelength components travel at a slightly slower speed than the wavefront. The green arc represents one of many tsunami refelctions from coastlines and submerged bathymetric features that are also detected and measured by satellite radar altimetry. Jason-1 measured the height of the tsunami wave where its trackline crossed these arcs. To the east, the local tsunami continues to cause major wave action along the Sumatran coast.
Animation: Simulated view of the tsunami waves looking southeast


A stochastic slip model can be used to represent many different rupture patterns that are consistent with the frequency content observed on seismograms. Shown in the next figure is the vertical displacement of the seafloor for the slip model that best reproduces the double-peak in the Jason-1 satellite altimetry data. Possible source regions that give rise to tsunami phases d1 and d2 are labeled. Other possible sources such as secondary faulting can also explain the double peak.

Comparison with the March 28, 2005 Tsunami
Three months after the devastating 2004 Indian Ocean tsunami, a M=8.6 earthquake occured offshore northern Sumatra. Although there was intense strong ground shaking and heavy damage associated with this earthquake, the tsunami was much less than expected. We can understand the factors that influence tsunami severity by comparing this event with the 2004 Sumatra-Andaman earthquake and other earthquakes along the Sunda subduction zone.
There are three primary factors influence the variation in local tsunami severity:
- Earthquake magnitude
- Fault slip near trench
- Tsunami beaming
Each of these factors are described in more detail below. Animations of both the 2004 and 2005 events show how these factors combine to produce very different tsunamis.
Earthquake Magnitude

The plot shows local tsunami intensity as a function of earthquake magnitude (M) for a number of tsunamis that have occurred in the past century. Recent tsunamis generated by earthquakes along the Sunda subduction zone are indicated by the yellow stars. In general, tsunami size increases with earthquake magnitude, although there is significant variation in this relationship.
The size of 2004 Indian Ocean local tsunami is consistent with the size of local tsunamis generated by other earthquakes of similar magnitude, for example the 1964 Great Alaska earthquake and tsunami. The 2005 northern Sumatra earthquake and, to some extent, the 2007 southern Sumatra earthquake (M=8.4) are deficient in terms of the local tsunamis produced. In contrast, the 2006 Java earthquake produced a larger than expected tsunami and is among a class of earthquakes called tsunami earthquakes.
Fault Slip Near Trench

If slip during an inter-plate thrust earthquake occurs near the oceanic trench marking where the fault intersects the sea floor, three things happen to increase local tsunami severity: (1) rupture can break through to the trench, increasing slip on the fault; (2) vertical displacement will be greater because of the shallow fault depth below the sea floor; and (3), there will be greater shoaling amplification of the tsunami (see Panel 3 of Life of a Tsunami) because the vertical displacement is beneath deeper water.

For the 2004 Sumatra-Andaman earthquake, the rupture started at the epicenter and spread throughout the region indicated by the finite fault model of the southern part of the rupture zone derived from global recordings of the earthquake. Analysis of the satellite altimetry data indicates that the southern rupture zone most likely extended to the Sunda Trench and broke through the sea floor as surface faulting. Holding all other parameters of the earthquake constant, a tsunami generated by a sea-floor rupture is greater than one generated by an earthquake that does not rupture the sea floor (i.e., imbedded faulting). The graph shows a comparison of the vertical displacement profiles for the two cases.
In addition, if vertical displacement of the sea floor occurs beneath deep water, then the tsunami become greater as it travels toward shore, owing to shoaling amplification.
In the figure below, we show the difference between the initial tsunamis generated from the December 2004 (top) and March 2005 (bottom) caused by differences in earthquake magnitude as well as how close to the trench the fault ruptured.

Tsunami Beaming
Tsunami beaming refers to the higher tsunami amplitudes in a direction perpendicular to fault orientation during open-ocean propagation. Although tsunami waves are often described as waves spreading out in all directions (like when you throw a pebble into a pond), for long earthquake ruptures, tsunami amplitudes are greater along the azimuth of tsunami beaming. Because the oceanic trench of subduction zones marks the orientation of inter-plate thrust, the tsunami beaming azimuth is also perpendicular to the orientation of the trench. Complexity of the earthquake source and refraction/scattering during propagation will affect the tsunami beaming pattern.
The tsunami beaming plots shown here are constructed by determining the maximum tsunami amplitude over four hours of propagation time. For the 2004 Sumatra-Andaman earthquake, the tsunami beaming pattern is particularly important for explaining high tsunami runup in Sri Lanka and the western coast of the Malay Peninsula.
For the 2005 northern Sumatra earthquake, tsunami beaming is directed south of Sri Lanka and essentially blocked by the island of Sumatra toward the Malay Peninsula.


Animations
Another way to compare the open-ocean tsunamis between these two earthquakes is to look at the tsunami wavefield for each earthquake, as shown in the snapshots and animations below. In particular, note that the open-ocean wave length for the 2004 tsunami is shorter than for the 2005 tsunami. Because the 2005 tsunami was primarily generated in shallow water, as the wave travels into the deep ocean, it lengthens and decreases in amplitude (the reverse of shoaling amplification).
Tsunami wavefield for the 2004 Sumatra-Andaman earthquake 1 hour after generation, view to the northwest

Tsunami wavefield for the 2005 northern Sumatra earthquake 1 hour after generation, view to the northwest

Below are other snapshots and animations of the 2004 tsunami from different view points.
Tsunami wavefield for the 2004 Sumatra-Andaman earthquake 1 hour after generation, view to the north

Tsunami wavefield for the 2004 Sumatra-Andaman earthquake 1 hour after generation, view to the east

Tsunami and Earthquake Research
Preliminary Simulations of Recent Tsunamis
Related publications


