
Floods, Droughts, and Hurricanes
Floods, Droughts, and Hurricanes
South Atlantic Water Science Center Flood Resources
USGS tools, websites, publications and other resources for monitoring, studying and communicating flood information.
USGS tools, websites, publications and other resources for monitoring, studying and communicating flood information.
South Atlantic Water Science Center Drought Resources
USGS tools, websites, publications, and other resources for monitoring, studying, and communicating drought information.
USGS tools, websites, publications, and other resources for monitoring, studying, and communicating drought information.
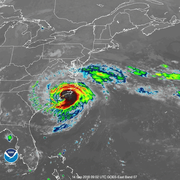
Hurricanes
USGS tools, websites, publications, and other resources for monitoring, studying, and communicating hurricane information.
USGS tools, websites, publications, and other resources for monitoring, studying, and communicating hurricane information.
Flood, Drought and Hurricanes
Information Links
Information Links
Filter Total Items: 25

Hurricane Dorian 2019
The South Atlantic Water Science Center prepares for Hurricane Dorian.

South Carolina Flood Frequency Q&A
In 2015, Dr. Robert Holmes, USGS National Flood Hazard Coordinator, took time to discuss some issues related to the flooding in South Carolina following the Appalachian Floods and Hurricane Joaquin (early October 2015).
Hurricane Florence 2018
The South Atlantic Water Science Center prepares for Hurricane Florence to make landfall along the Carolina coast.

SAWSC Monitoring of Hydrologic Hazards
A major element of the USGS mission is the documentation of the extent and magnitude of extreme hydrologic events, like floods and droughts. The South Atlantic Water Science Center is a leader in monitoring extreme water conditions, from droughts and falling groundwater levels to floods and storm-tide surges to water-quality problems.

Collection of High-Water Mark Data at Selected Roadway Crossings To Document October 2016 Flooding in the Pee Dee and Waccamaw River Basins of South Carolina
Hurricane Matthew generated large amounts of rainfall in South and North Carolina during September/October 2016. The South Atlantic Water Science Center, in cooperation with the South Carolina Department of Transportation, recorded High-Water Marks along selected road crossings, within the Pee Dee and Waccamaw River Basins of South Carolina.

The Streamgaging Program in the South Atlantic Water Science Center
The U.S. Geological Survey (USGS) South Atlantic Water Science Center streamgage program is part of the nationwide program that provides streamflow information for a variety of purposes—including the protection of life and property, infrastructure design, recreational usage, and long-term trend assessment. This information is critical to resource managers, farmers, fishermen, kayakers, land-use...

Hurricane Matthew Information Portal
As Hurricane Matthew moved up the Atlantic coast of the U.S., the USGS South Atlantic Water Science Center (SAWSC) deployed most of the USGS Storm-Tide Network along the Atlantic coast to monitor the timing, extent, and magnitude of the storm tide during the passage of Hurricane Matthew.

Catawba-Wateree Groundwater Network
The multiyear drought in North and South Carolina (summer 1998-fall 2002) brought wide recognition of the vulnerability of the water resources in these two States to climatic conditions. To prepare for drought conditions in the future, water managers and State and Federal water-resource agencies sought to develop tools to assess hydrologic conditions in both a predictive and responsive manner...

Epic September 2009 Flooding - Georgia
Many days of continuous heavy rain in mid-September 2009 resulted in flooding in many parts of Georgia, especially in north Georgia and the Atlanta region. The rains produced streamflows of record proportions. rivers and streams had magnitudes so great that the odds of it happening were less than 0.2 percent in any given year. In other words, there was less than a 1 in 500 chance that parts of...

Current and Historical Peak Stage Bar Graphs for North Carolina
Current and Historical Peak Stage Bar Graphs for North Carolina The Peak Stage Bar Graphs section for North Carolina allows you to compare current stream stage with historic peaks at water-monitoring sites throughout North Carolina.

Selected Roadway High-Water Mark Data from Hurricane Joaquin Flooding, October 2015
As part of the statewide response to the flooding, the USGS and S.C. Department of Transportation (SCDOT) conducted a cooperative study to collect high-water mark (HWM) data at 50 selected road crossings. The HWM elevations and descriptive data have been posted on the USGS Short-Term Network (STN). The STN is a national-scale application and database designed to support USGS event-based sensor...

Urban and Small, Rural Streams Flood Frequency Information
Reliable estimates of the magnitude and frequency of floods are essential for such things as the design of transportation and water-conveyance structures, flood insurance studies, and flood-plain management. Flood-frequency estimates are particularly important in densely populated urban areas. The U.S. Geological Survey (USGS) is using a multistate approach to update methods for determining the...