
Hurricane Sandy - Forecast and Documentation of Coastal Change
Hurricane Sandy coastal change forecast and pre- and post-storm photos documenting coastal change.
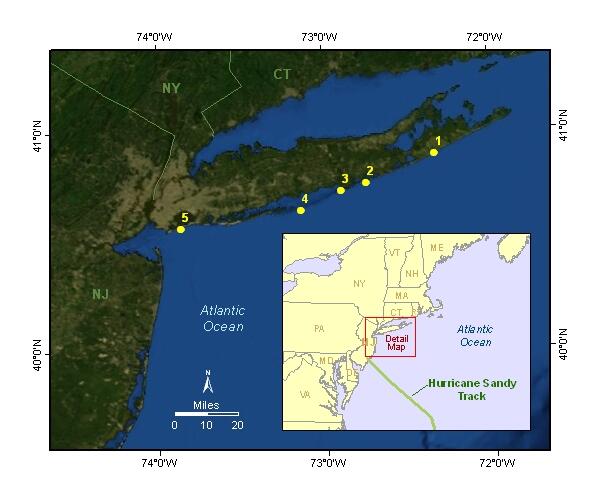
Hurricane Sandy made landfall on October 30, 2012, and impacted a long swath of the Mid-Atlantic coastline. Many areas that had been hit by Hurricane Irene in August 2011 were again battered by strong waves and surge. The barrier islands were breached in a number of places and erosion of the beach and dunes occurred all along the Mid-Atlantic coast.
Response Activities
Forecast of Potential Coastal Change
As Hurricane Sandy moved northward along the U.S. Atlantic coast in October 2012, U.S. Geological Survey scientists worked to determine where and how the storm's waves and surge might dramatically reshape the beaches and dunes that stand between the storm and coastal developments. Through a complex modeling process that uses coastal elevations, wave forecasts, and potential storm surge, they predicted coastal change hazards, such as shoreline and dune erosion, that might be expected during a Sandy landfall.
The coastal change forecast model predicts the probability of where and how sand dunes along the coast will be impacted by water levels during a storm. This includes the combined effect of surge and wave runup. The color band closest to the shoreline is the probability of dune erosion, the middle color band is the probability that sand dunes will be overtopped by waves during the storm, and the outer color band is the probability that the sand dunes will be completely inundated/flooded. The model forecast is available on the Coastal Change Hazards Portal and more information about the model can be found here: https://www.usgs.gov/centers/spcmsc/science/scenario-based-assessments-used-coastal-change-hazard-forecasts.

Pre-and Post-Storm Photo Comparisons and Lidar Elevation Maps
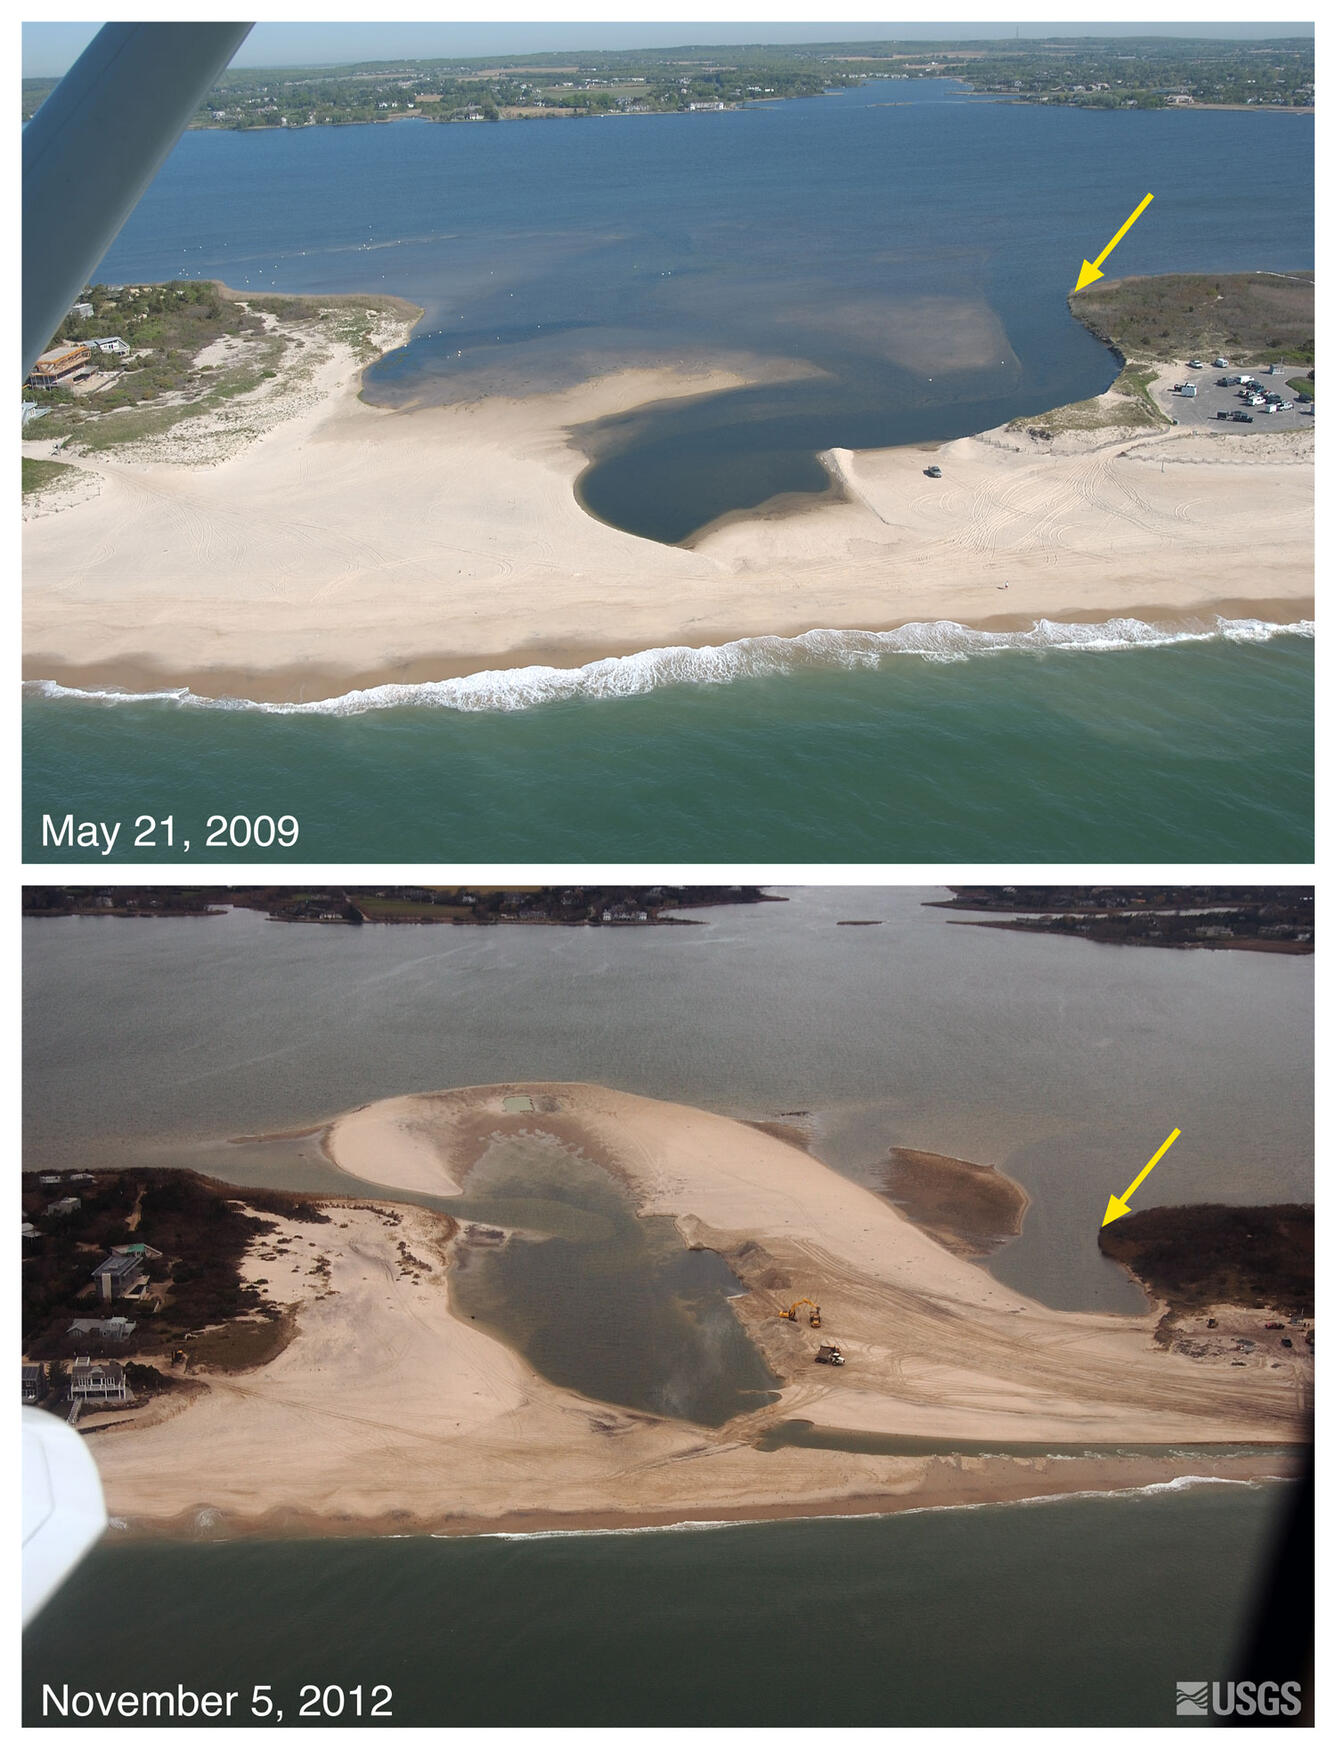
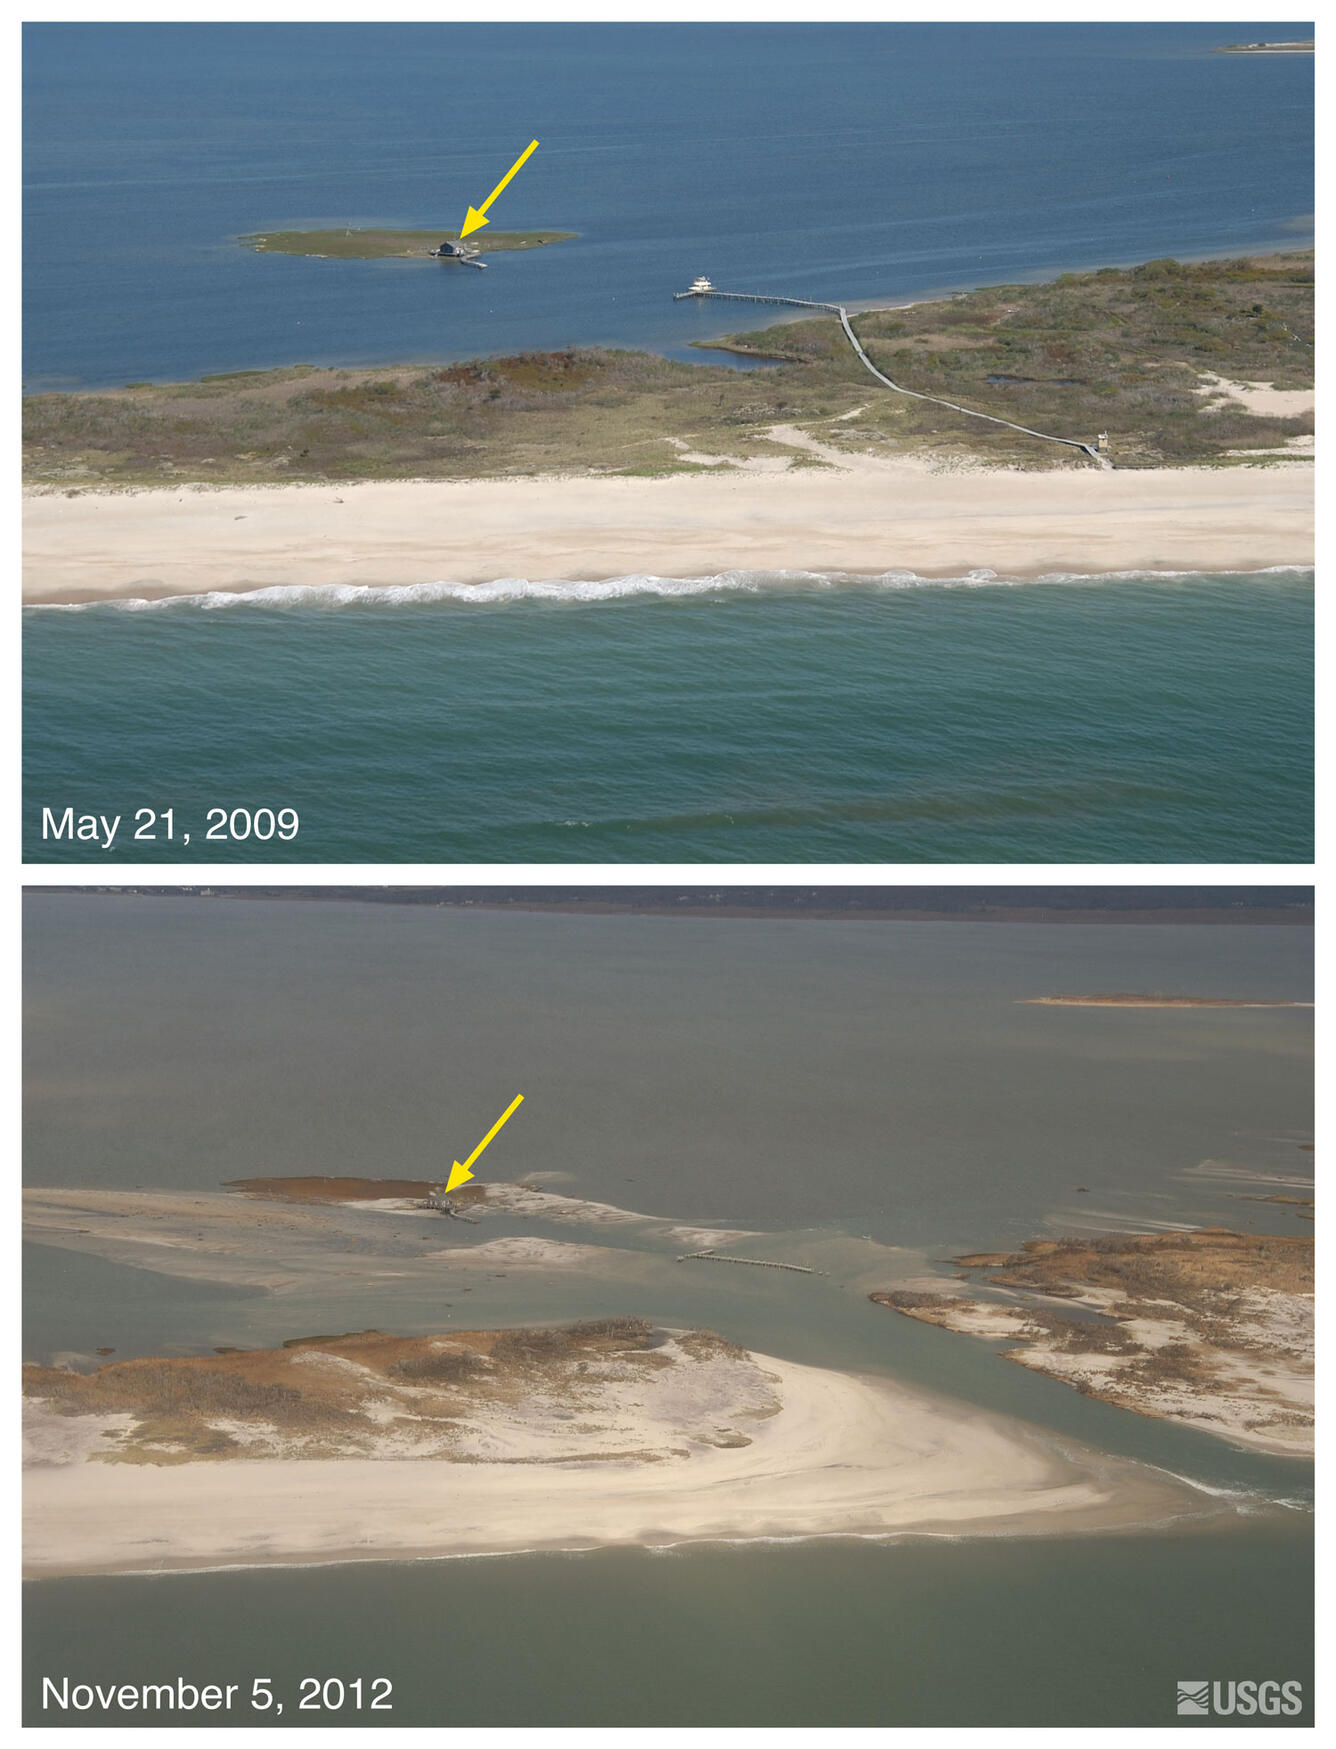
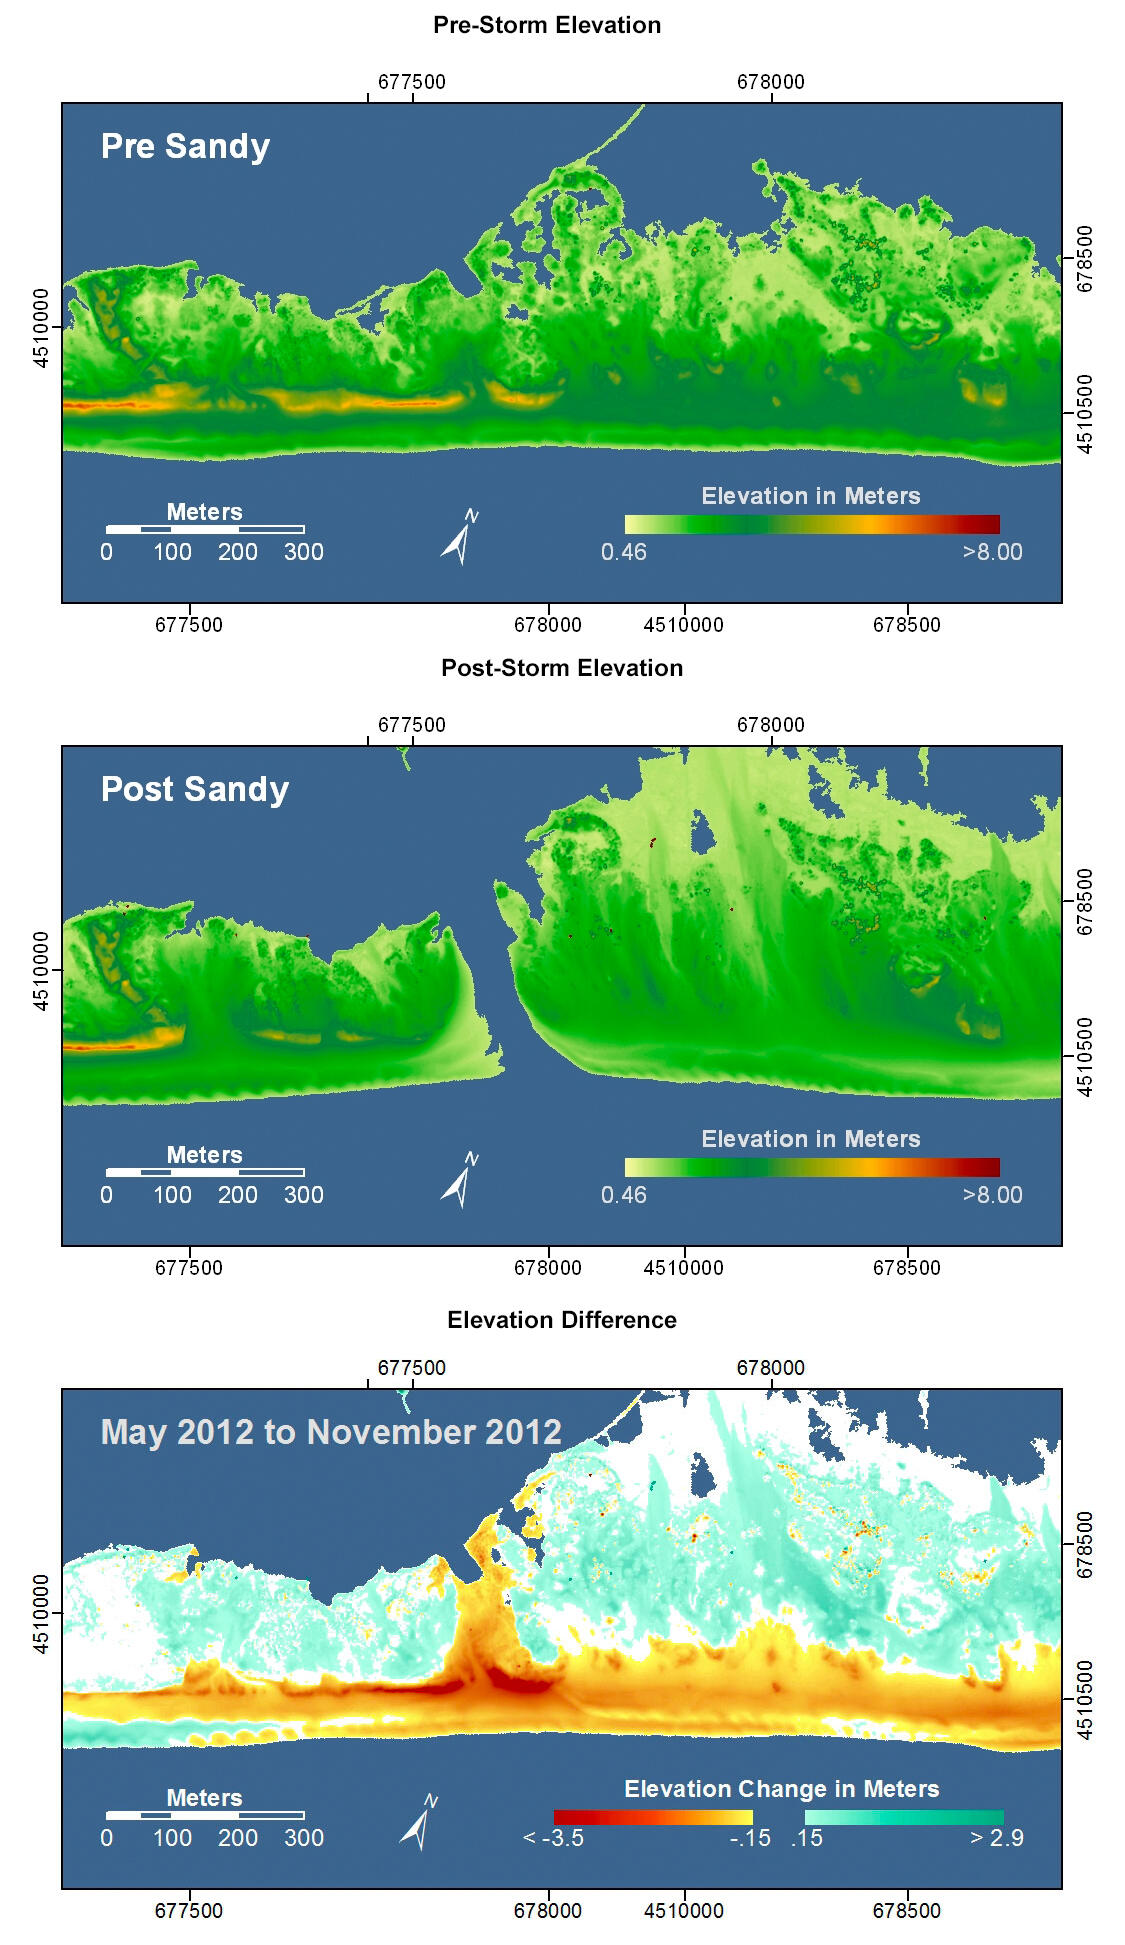
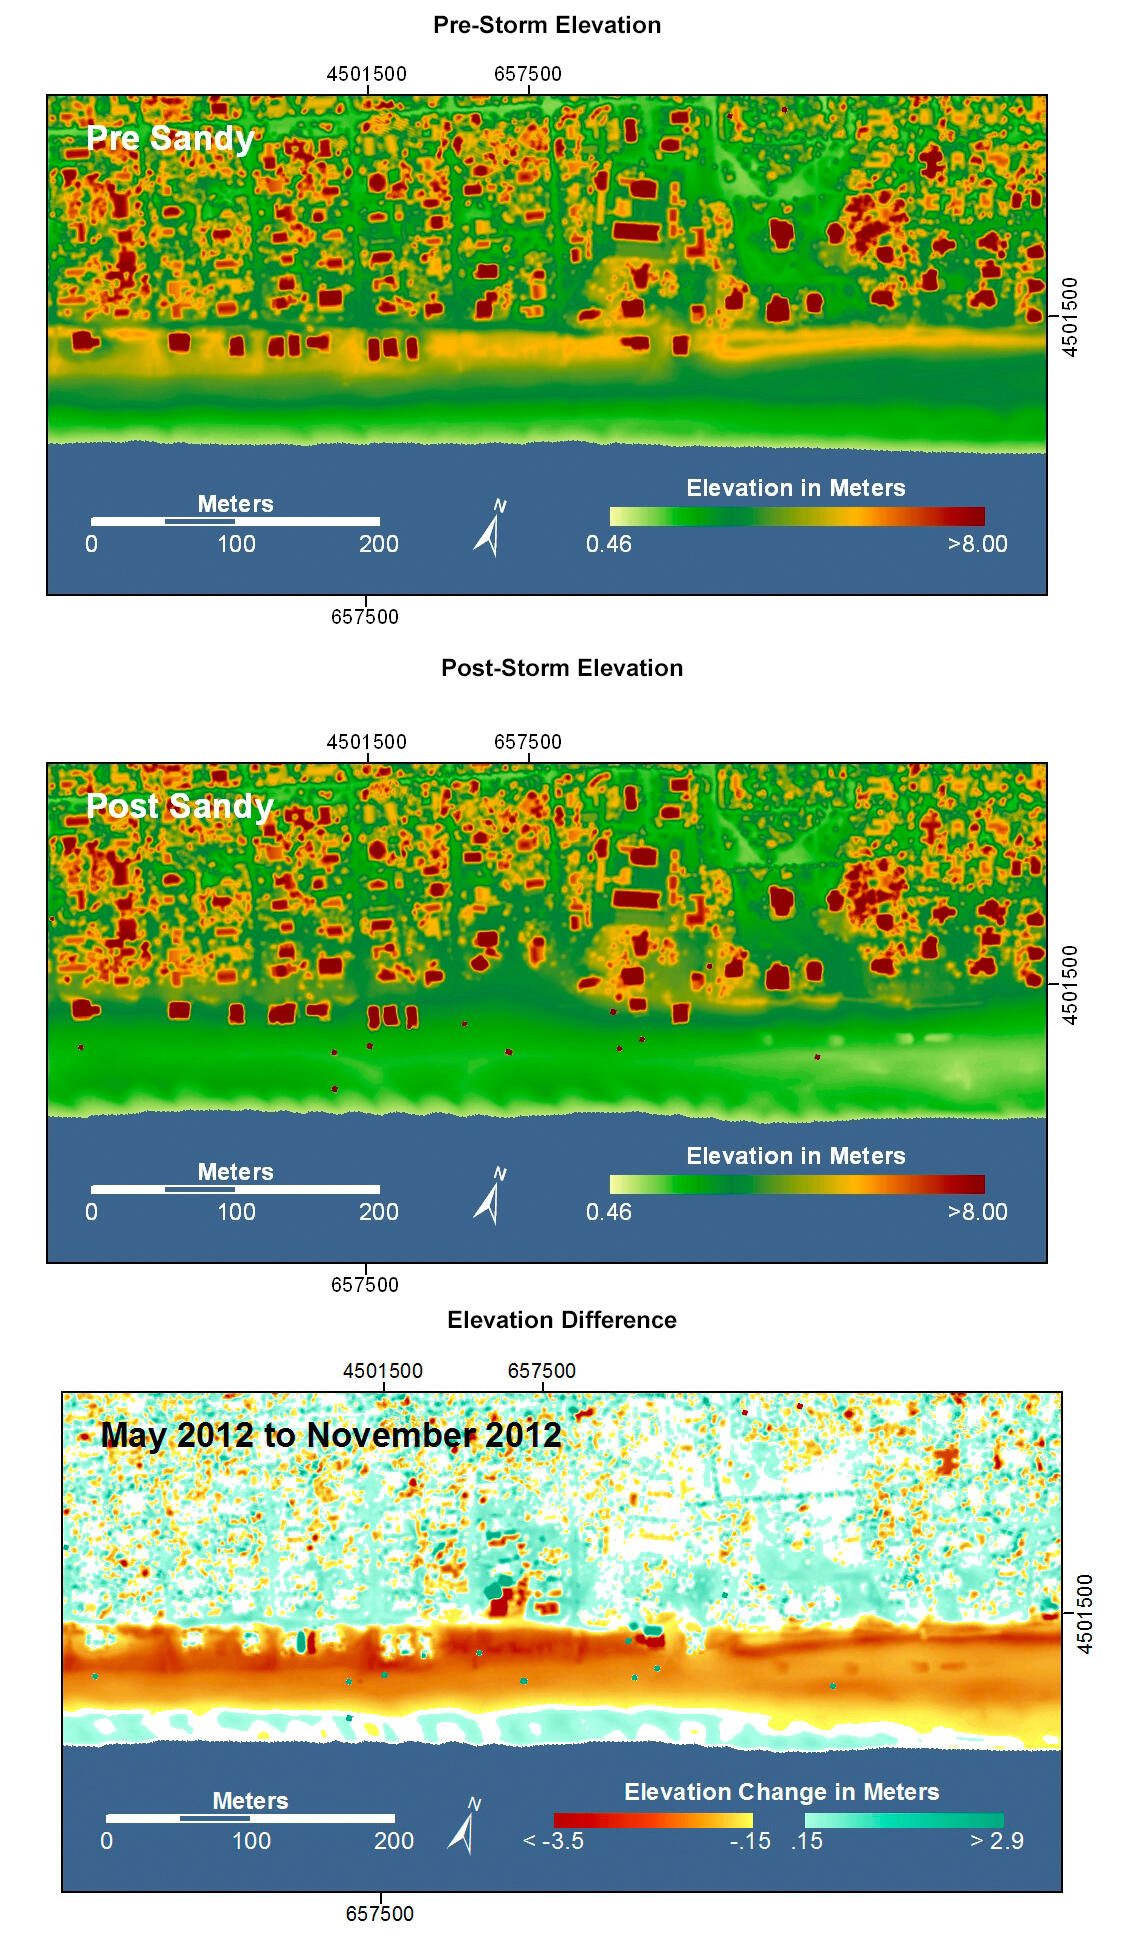
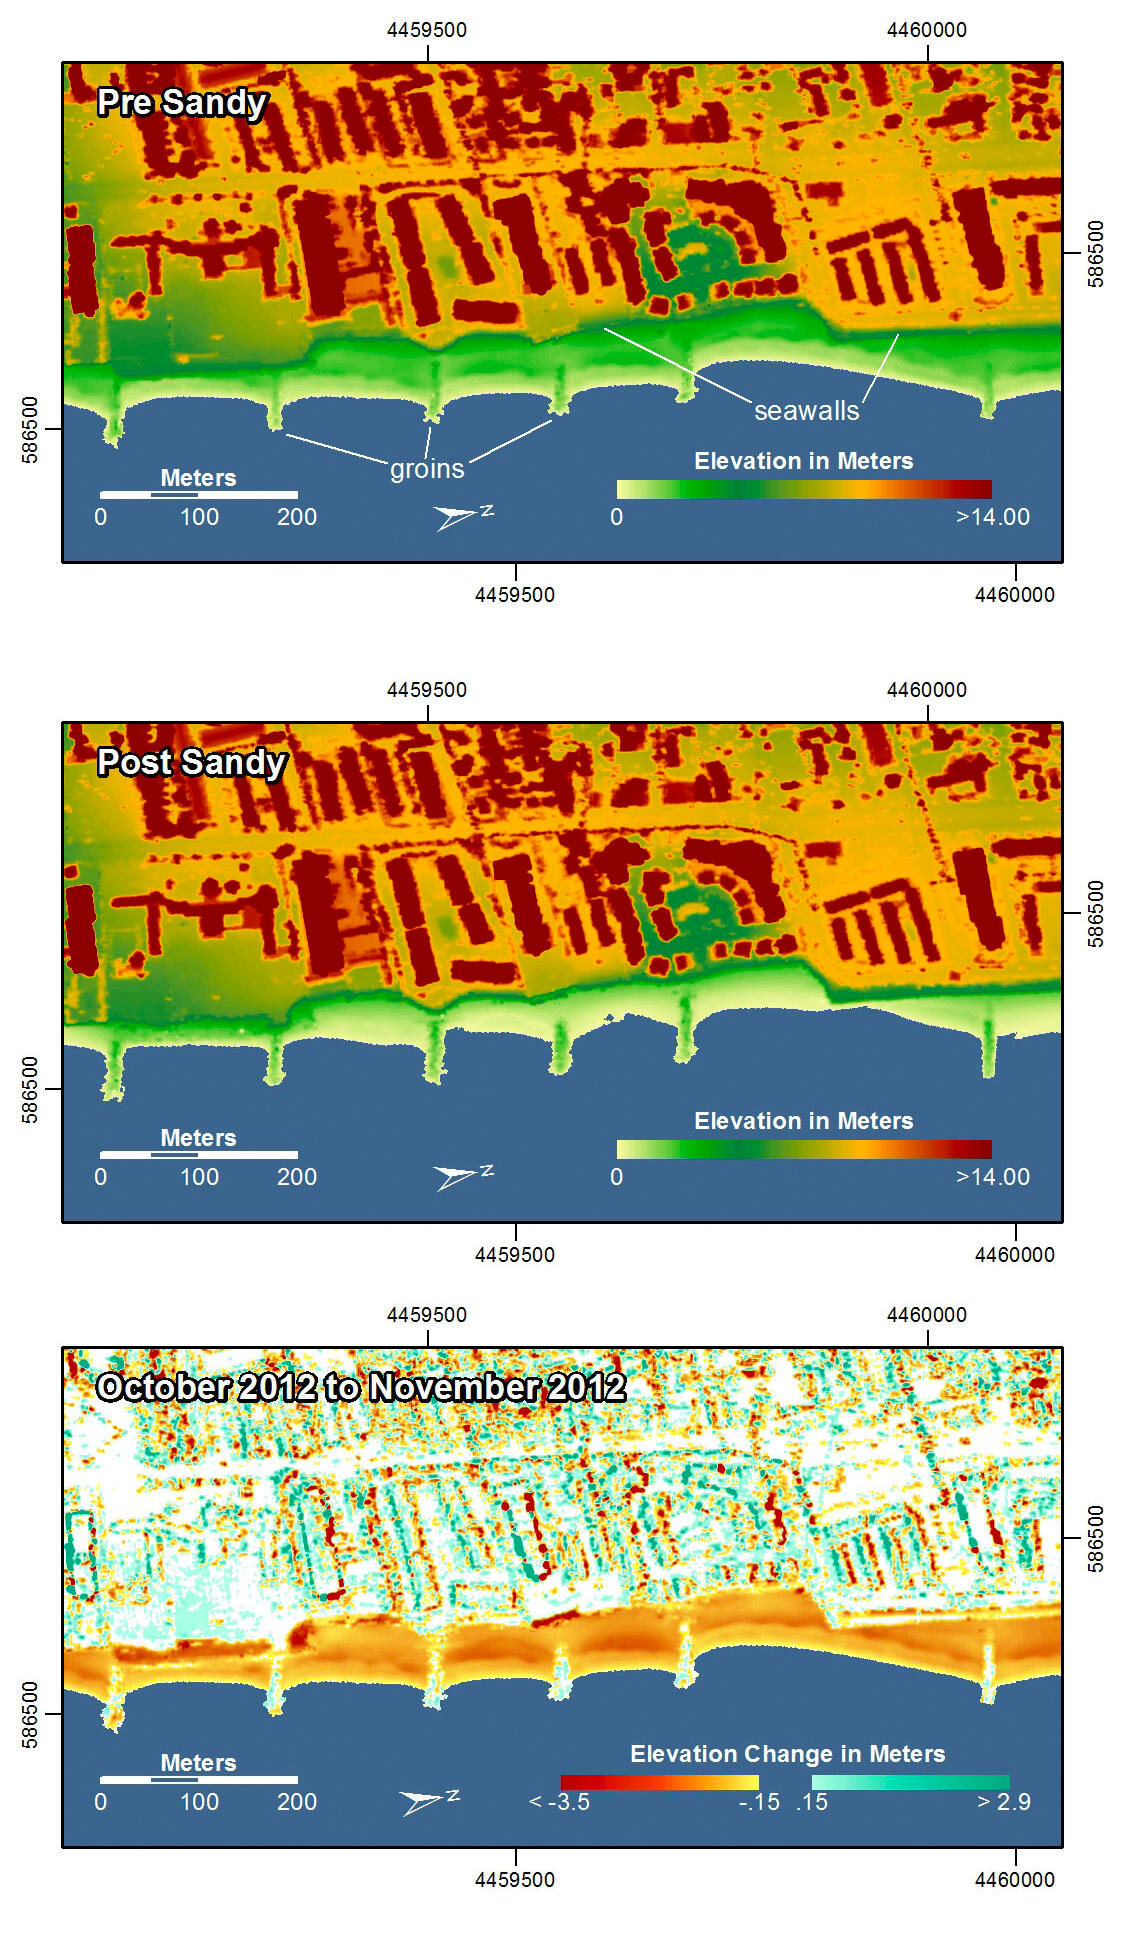
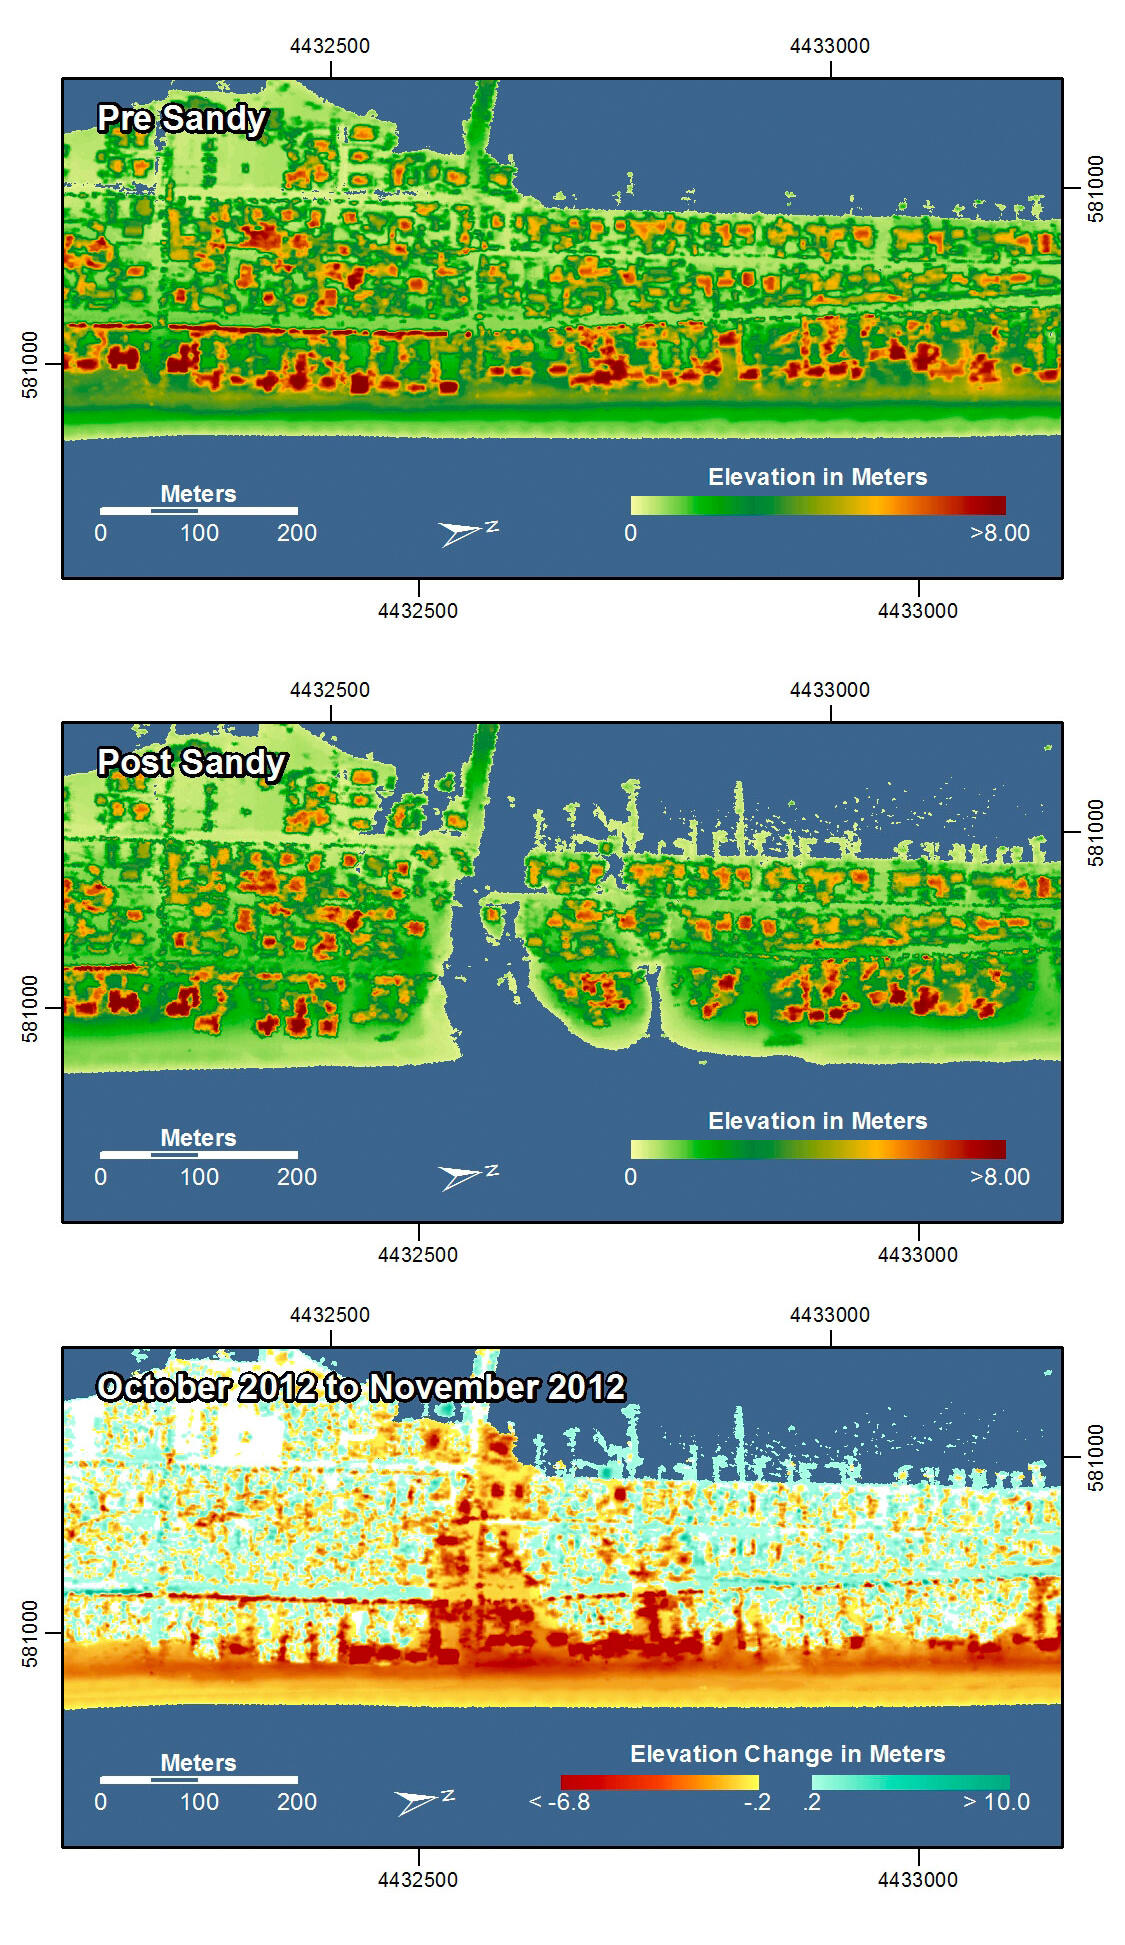
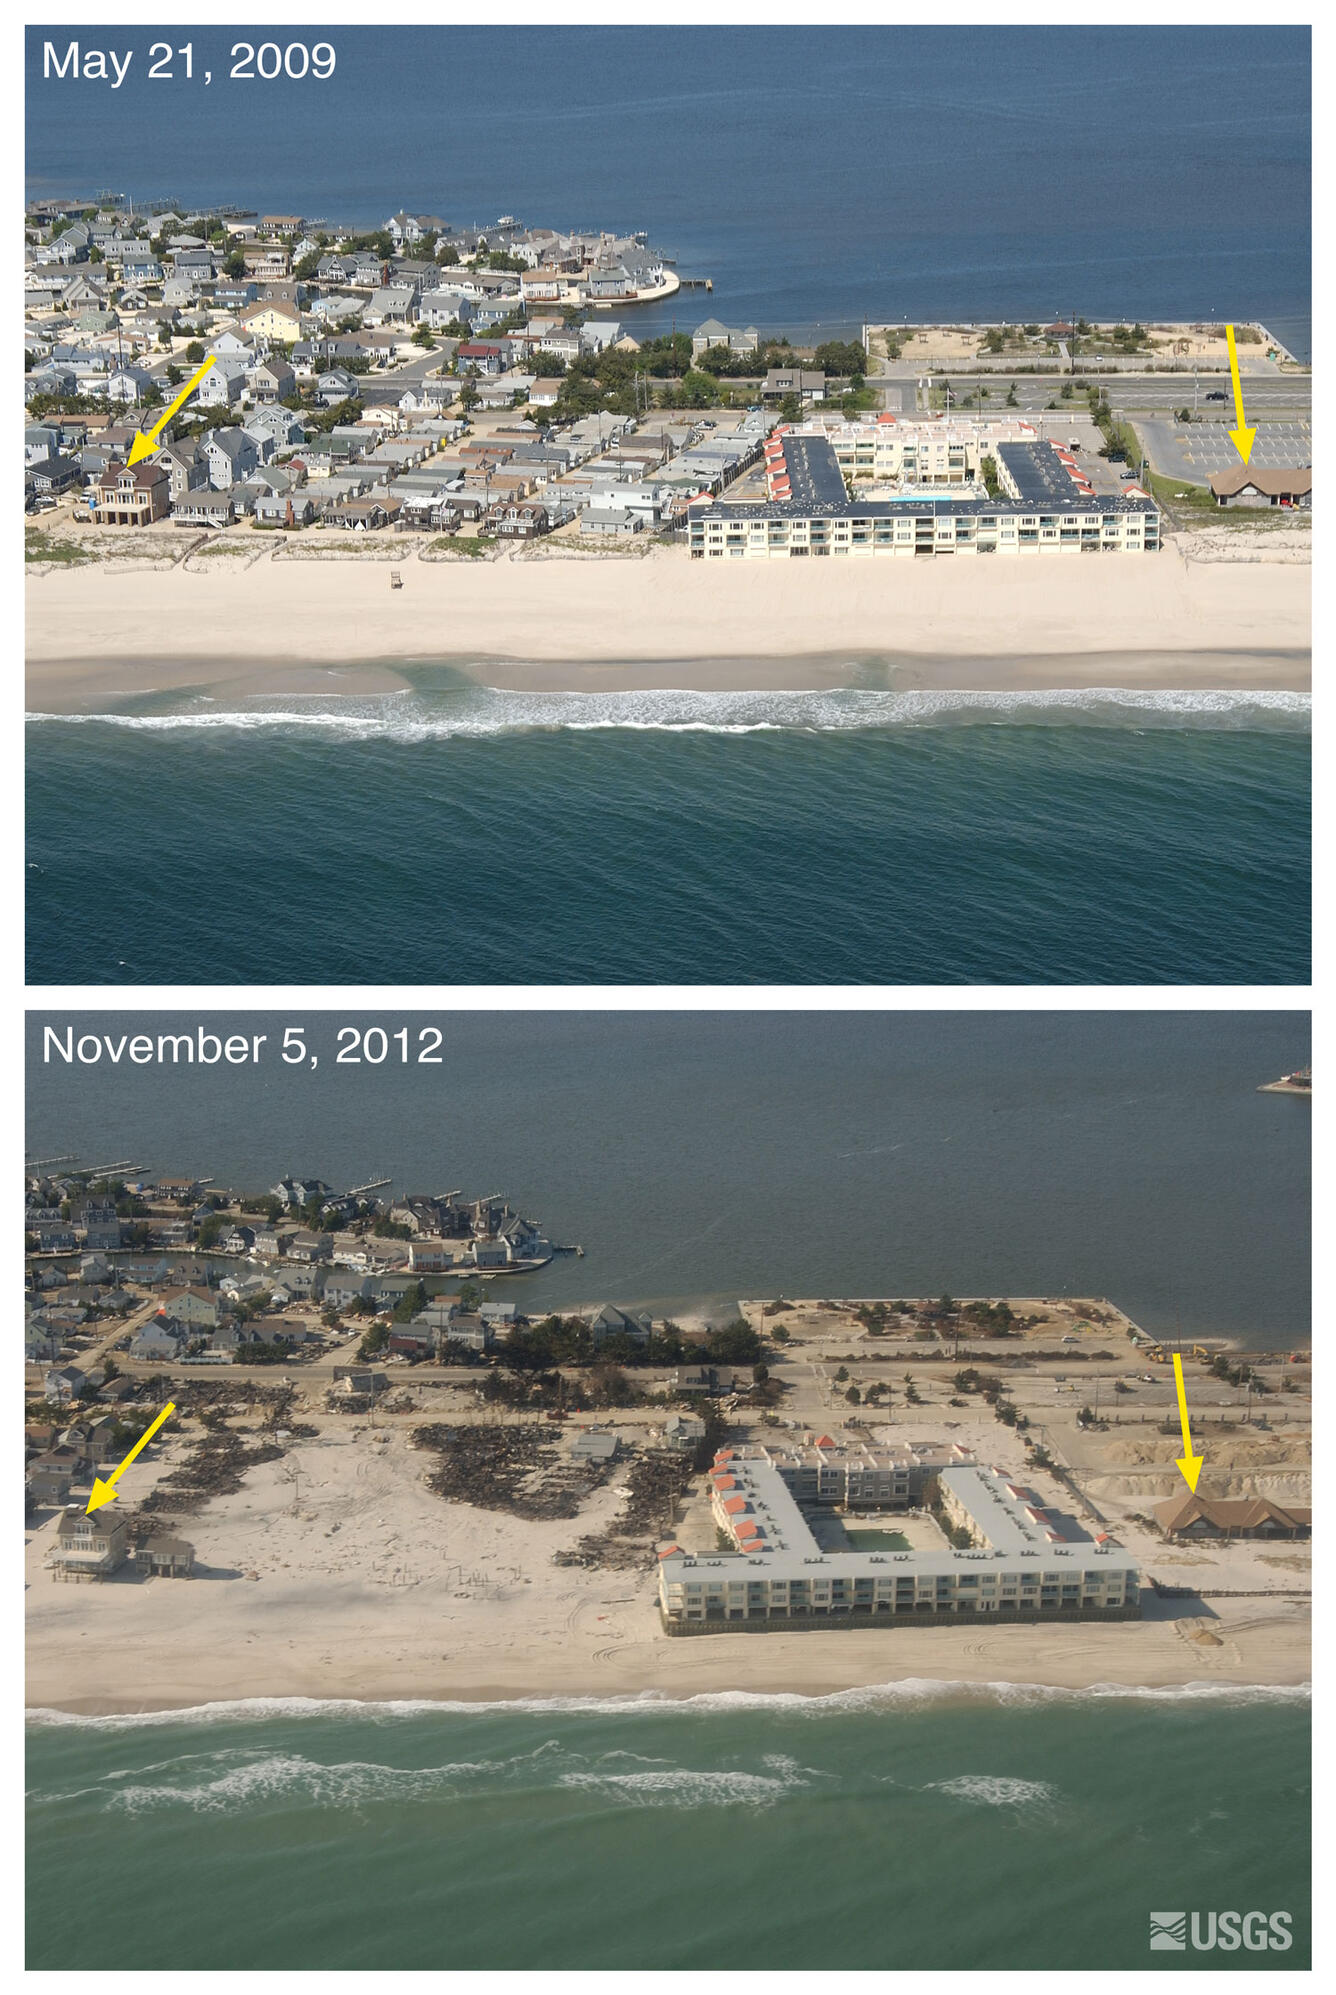
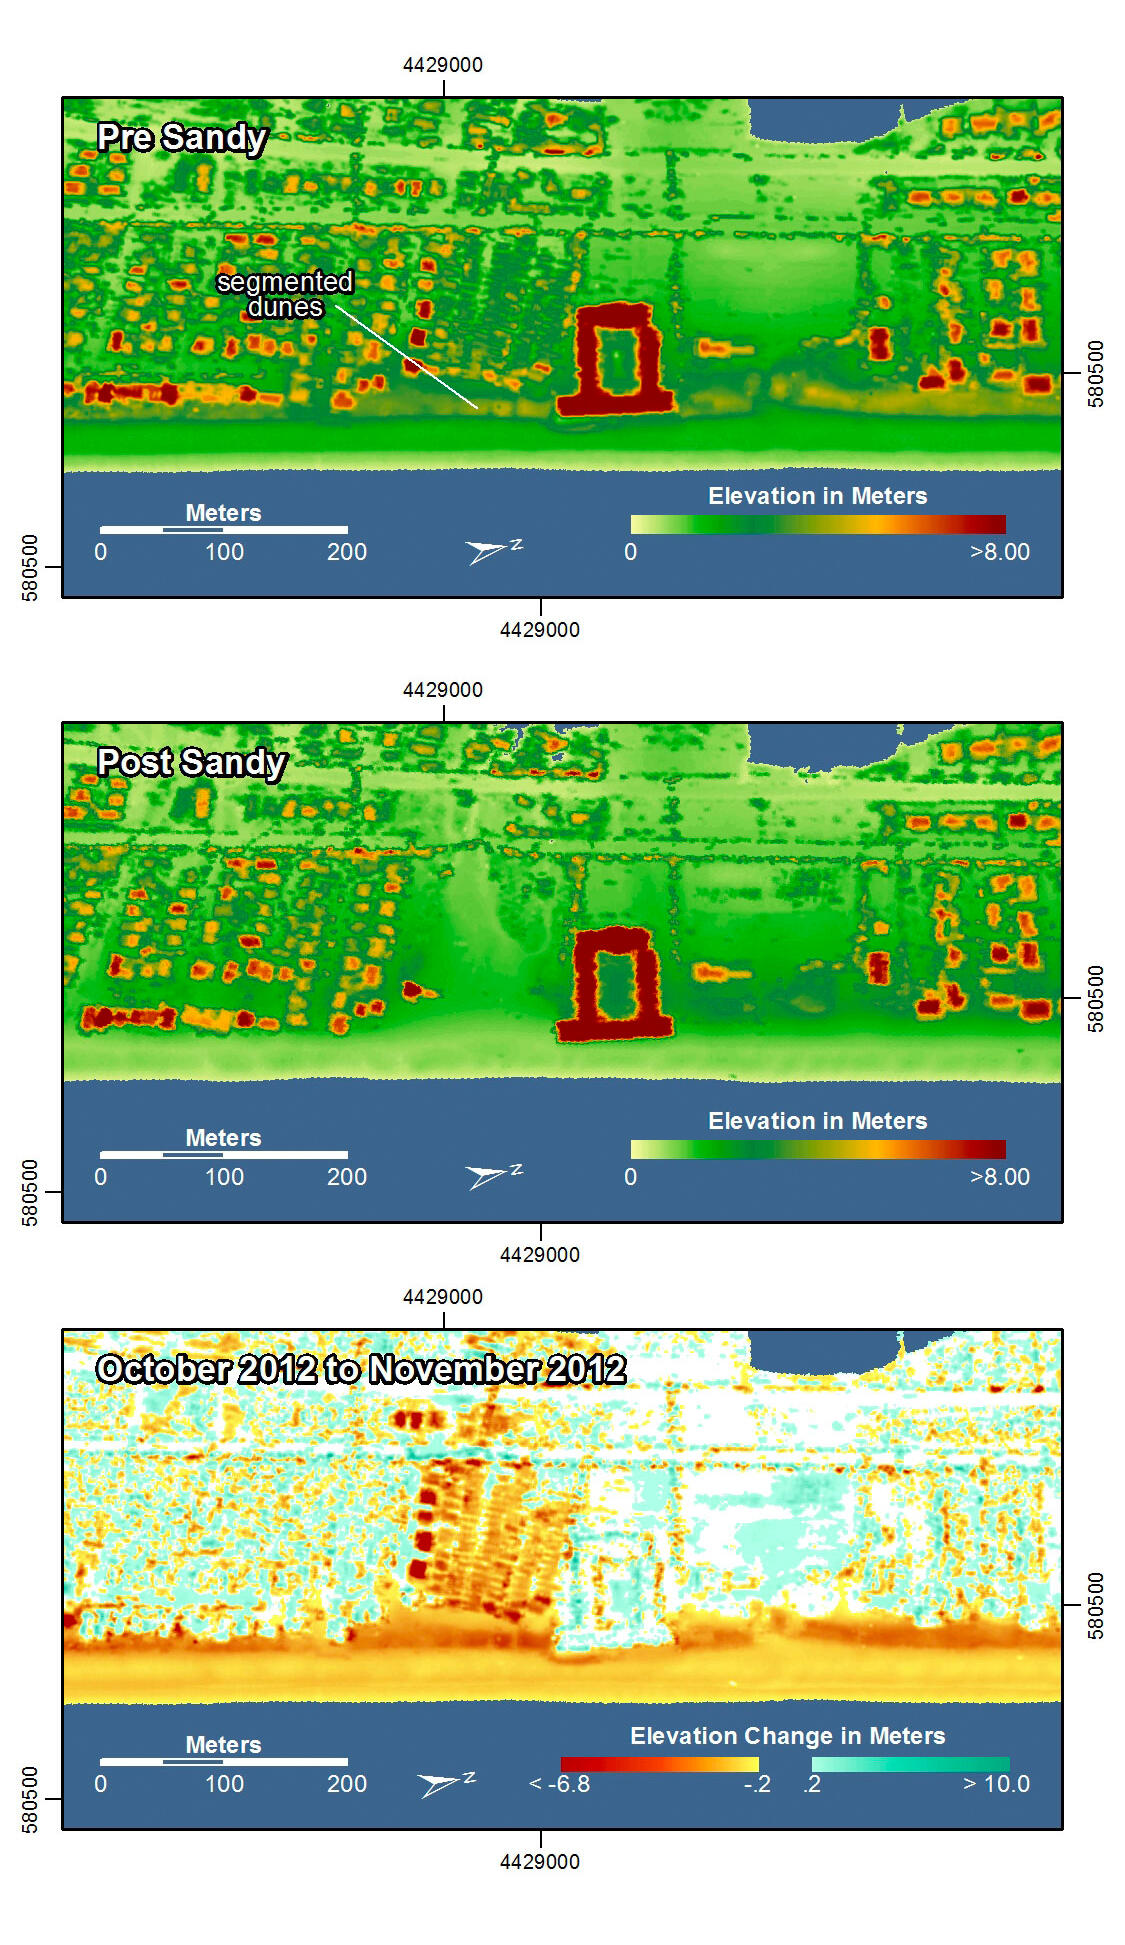
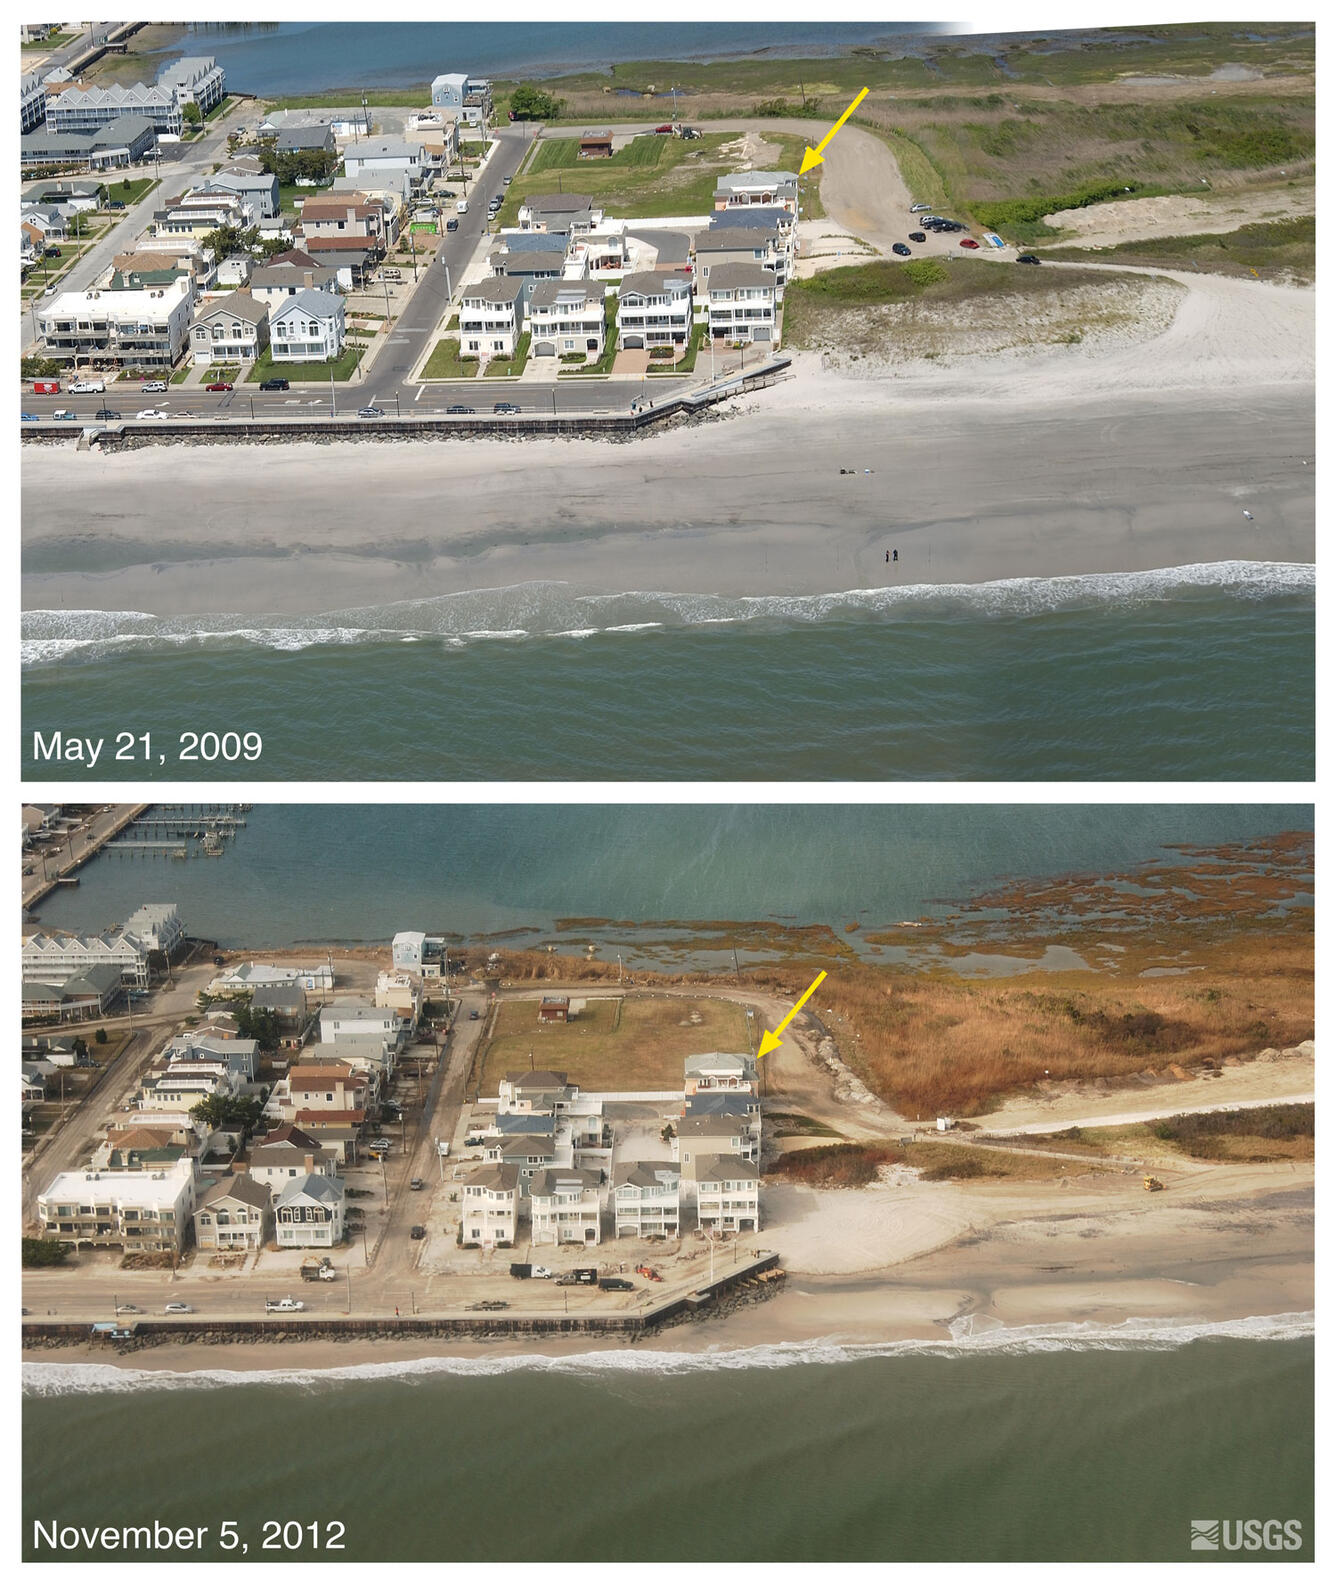
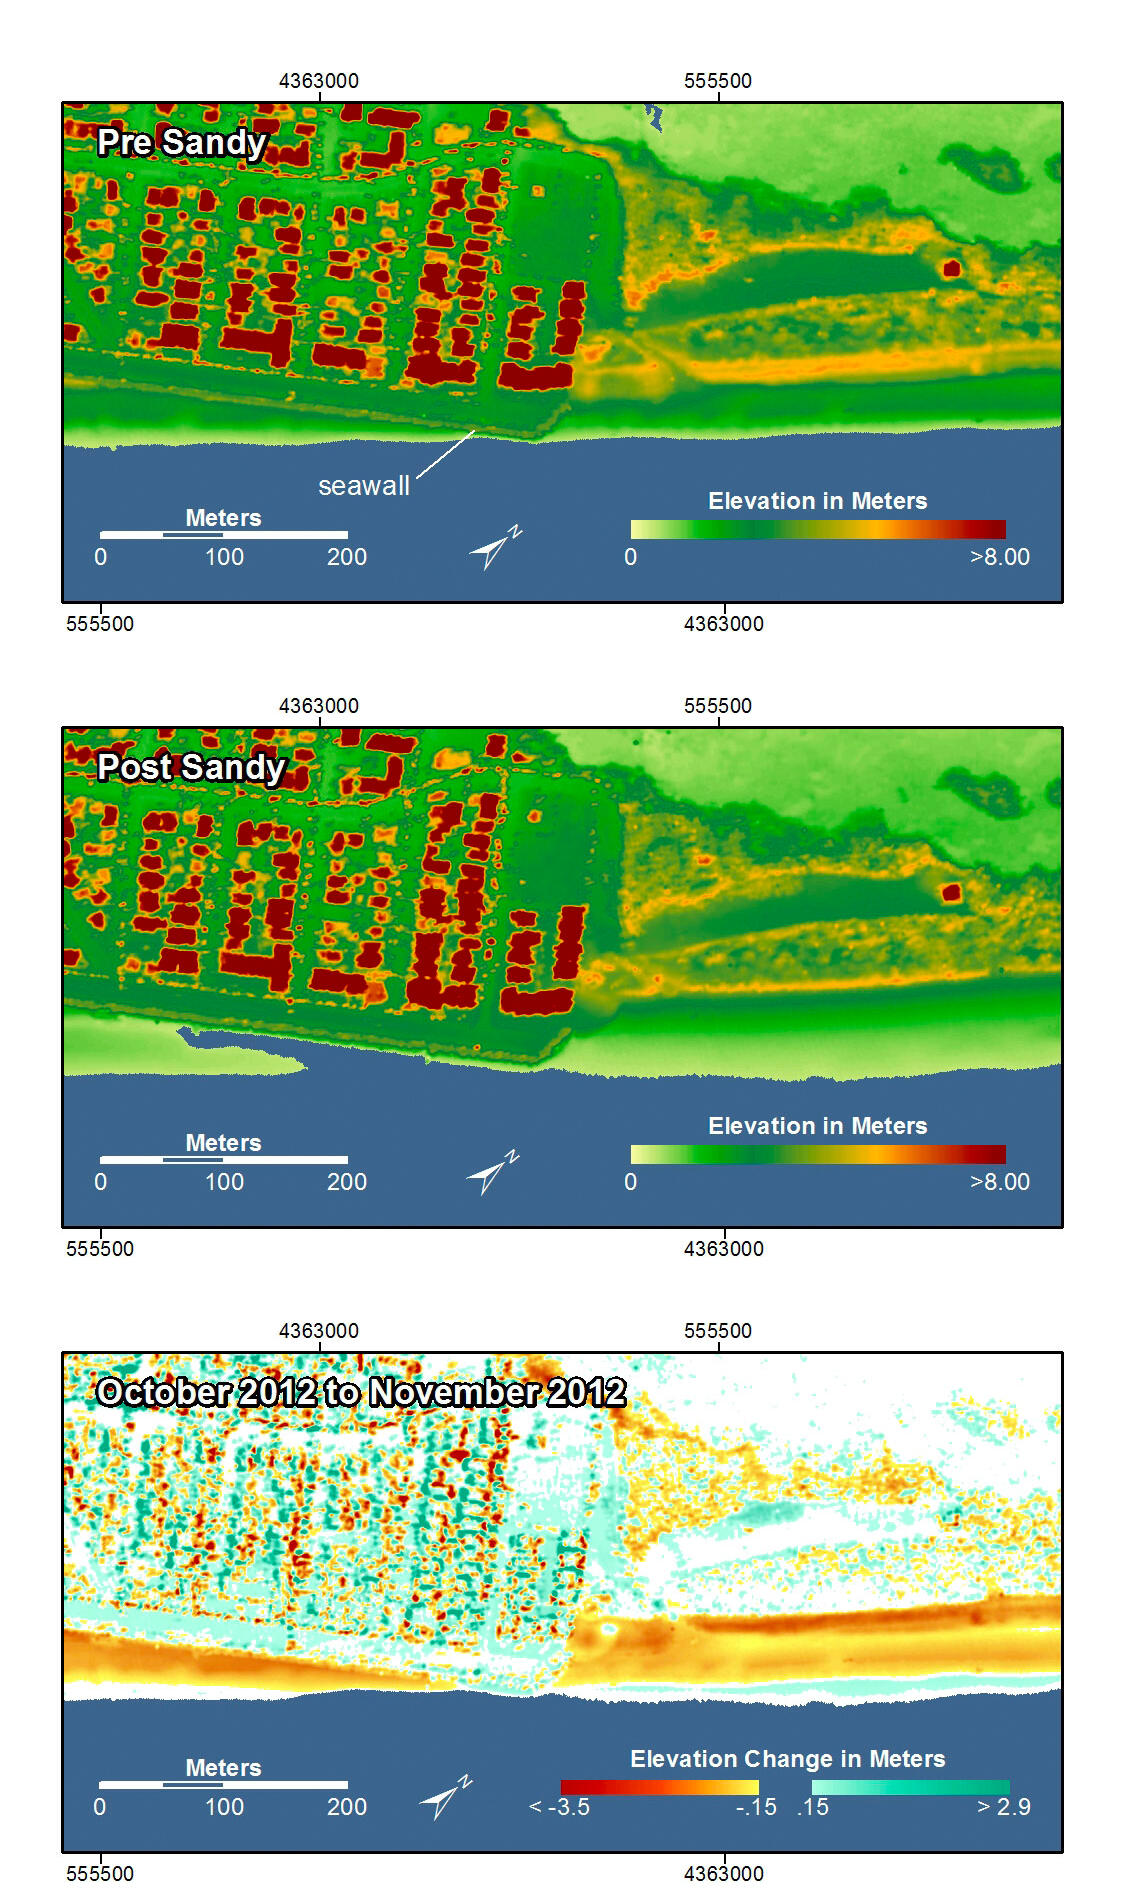
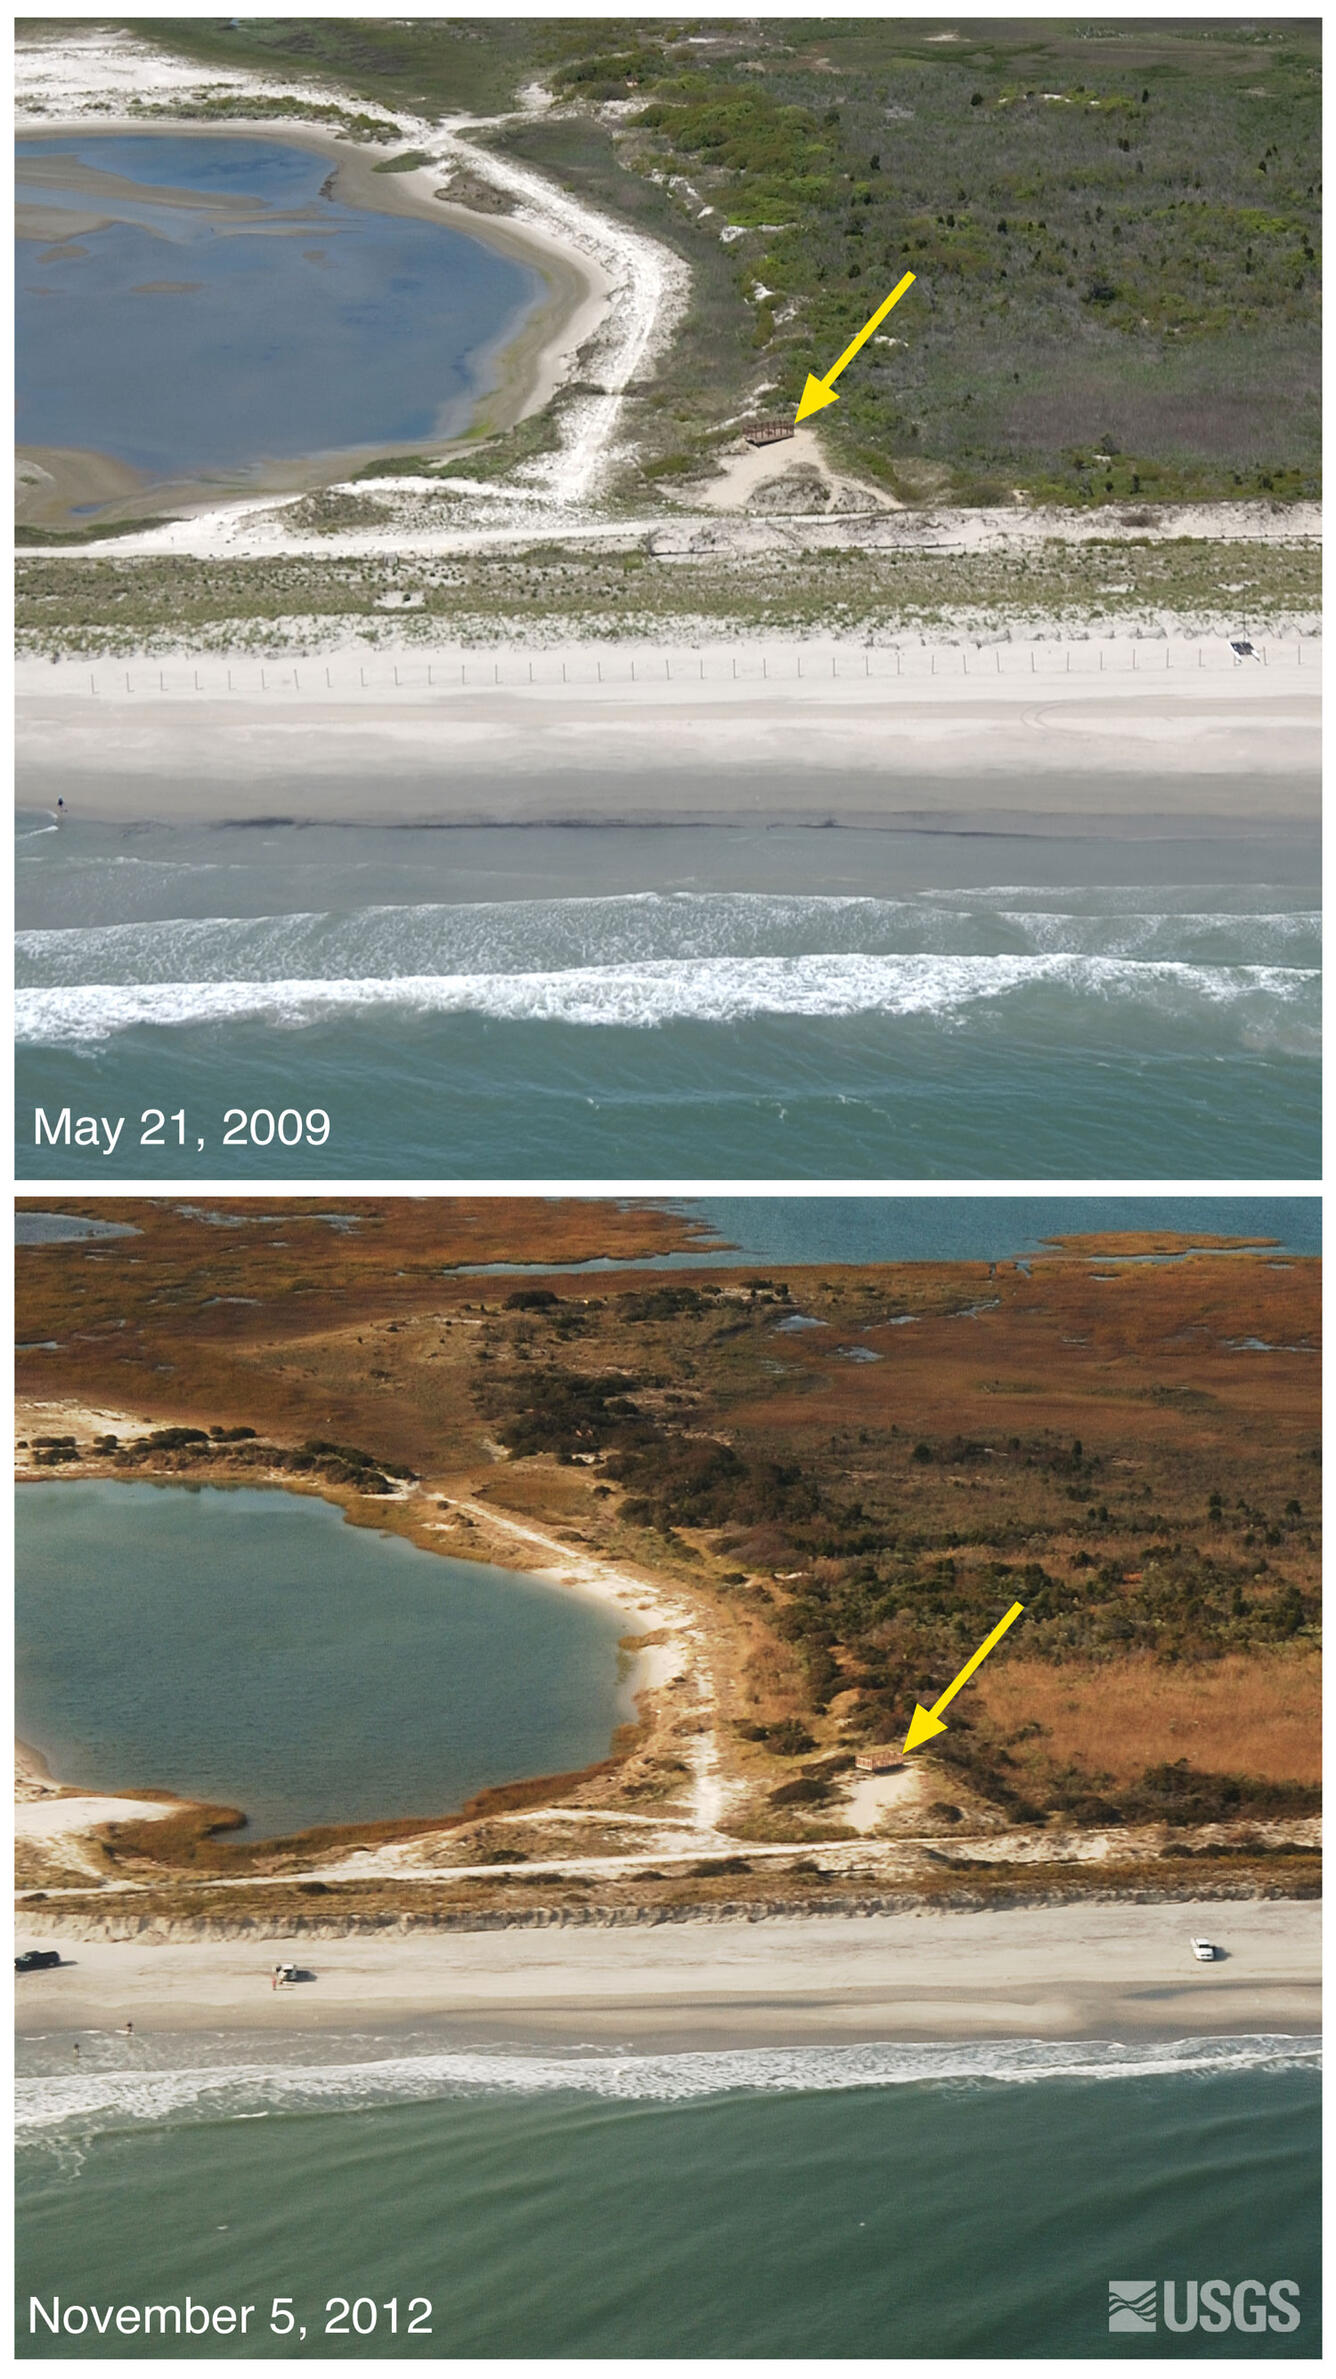
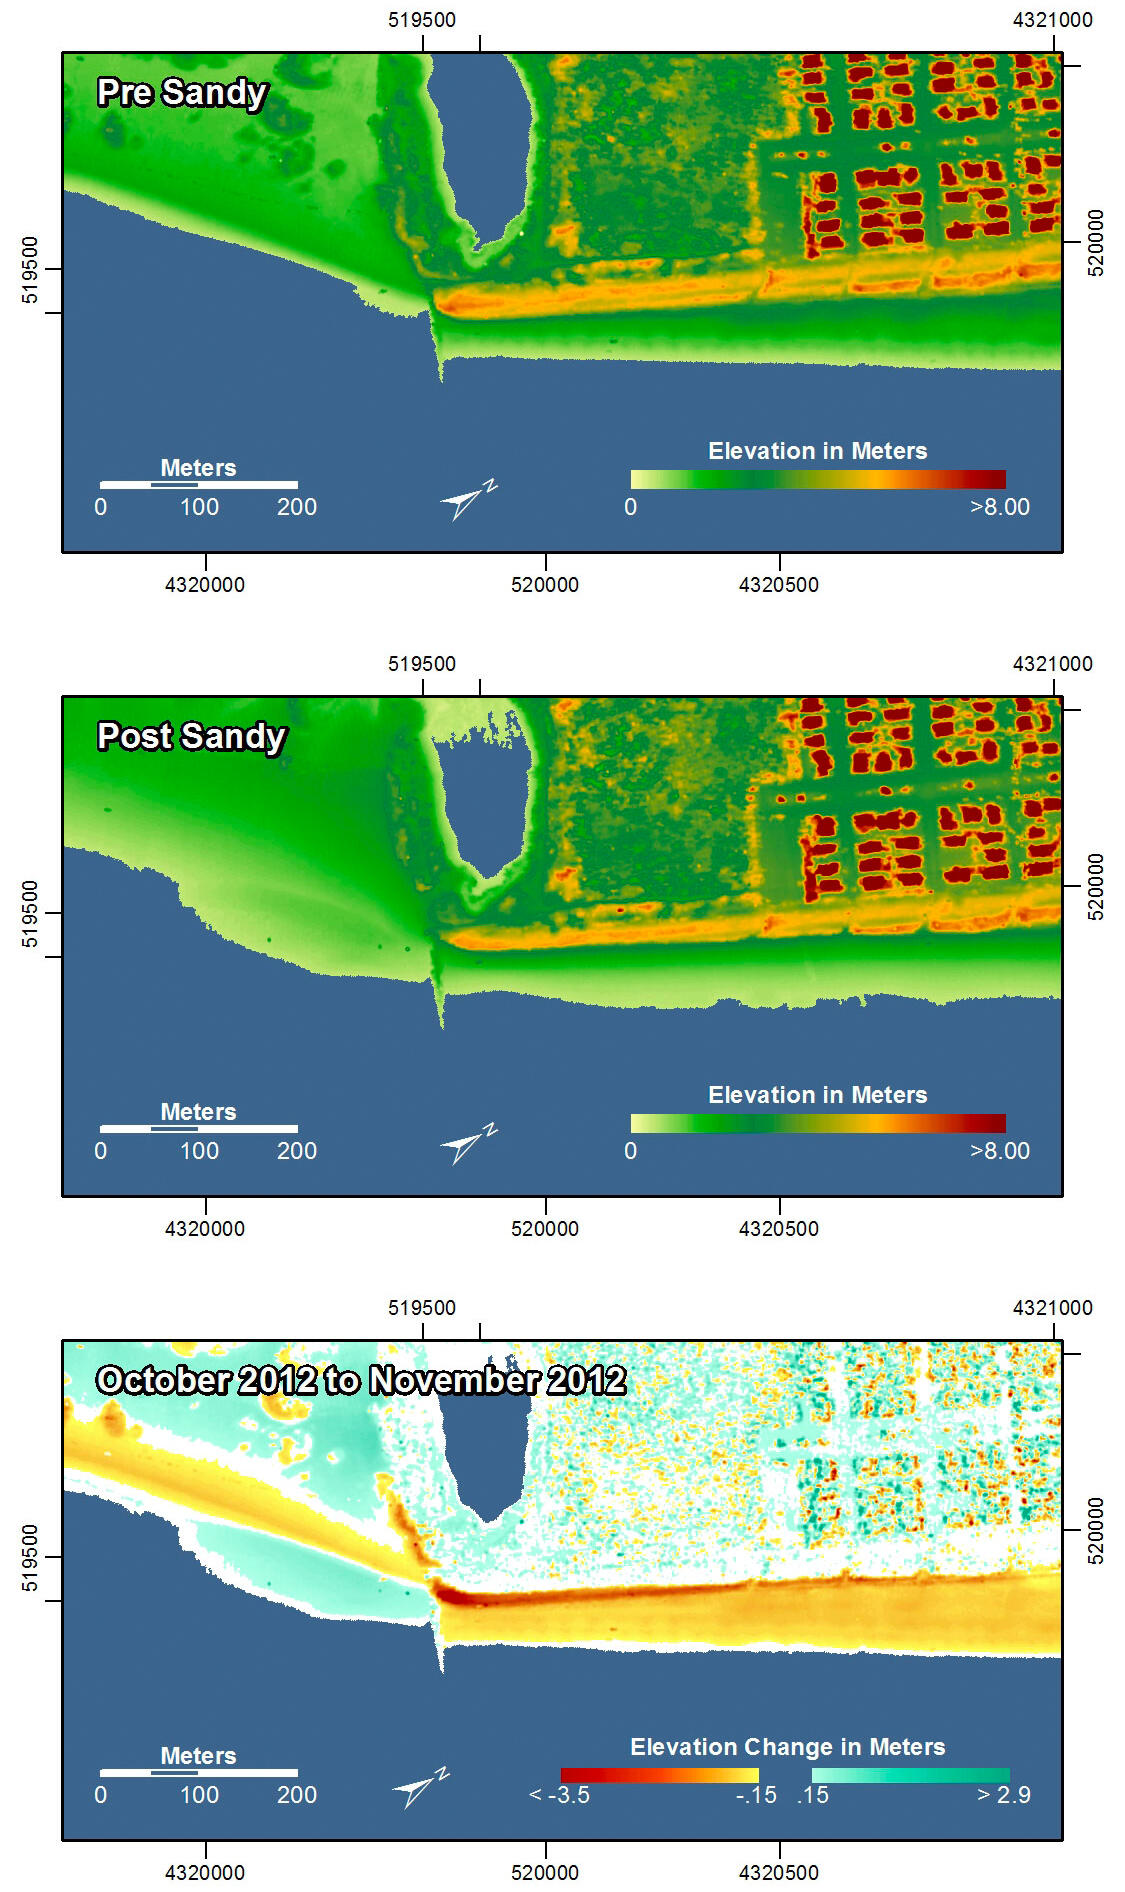
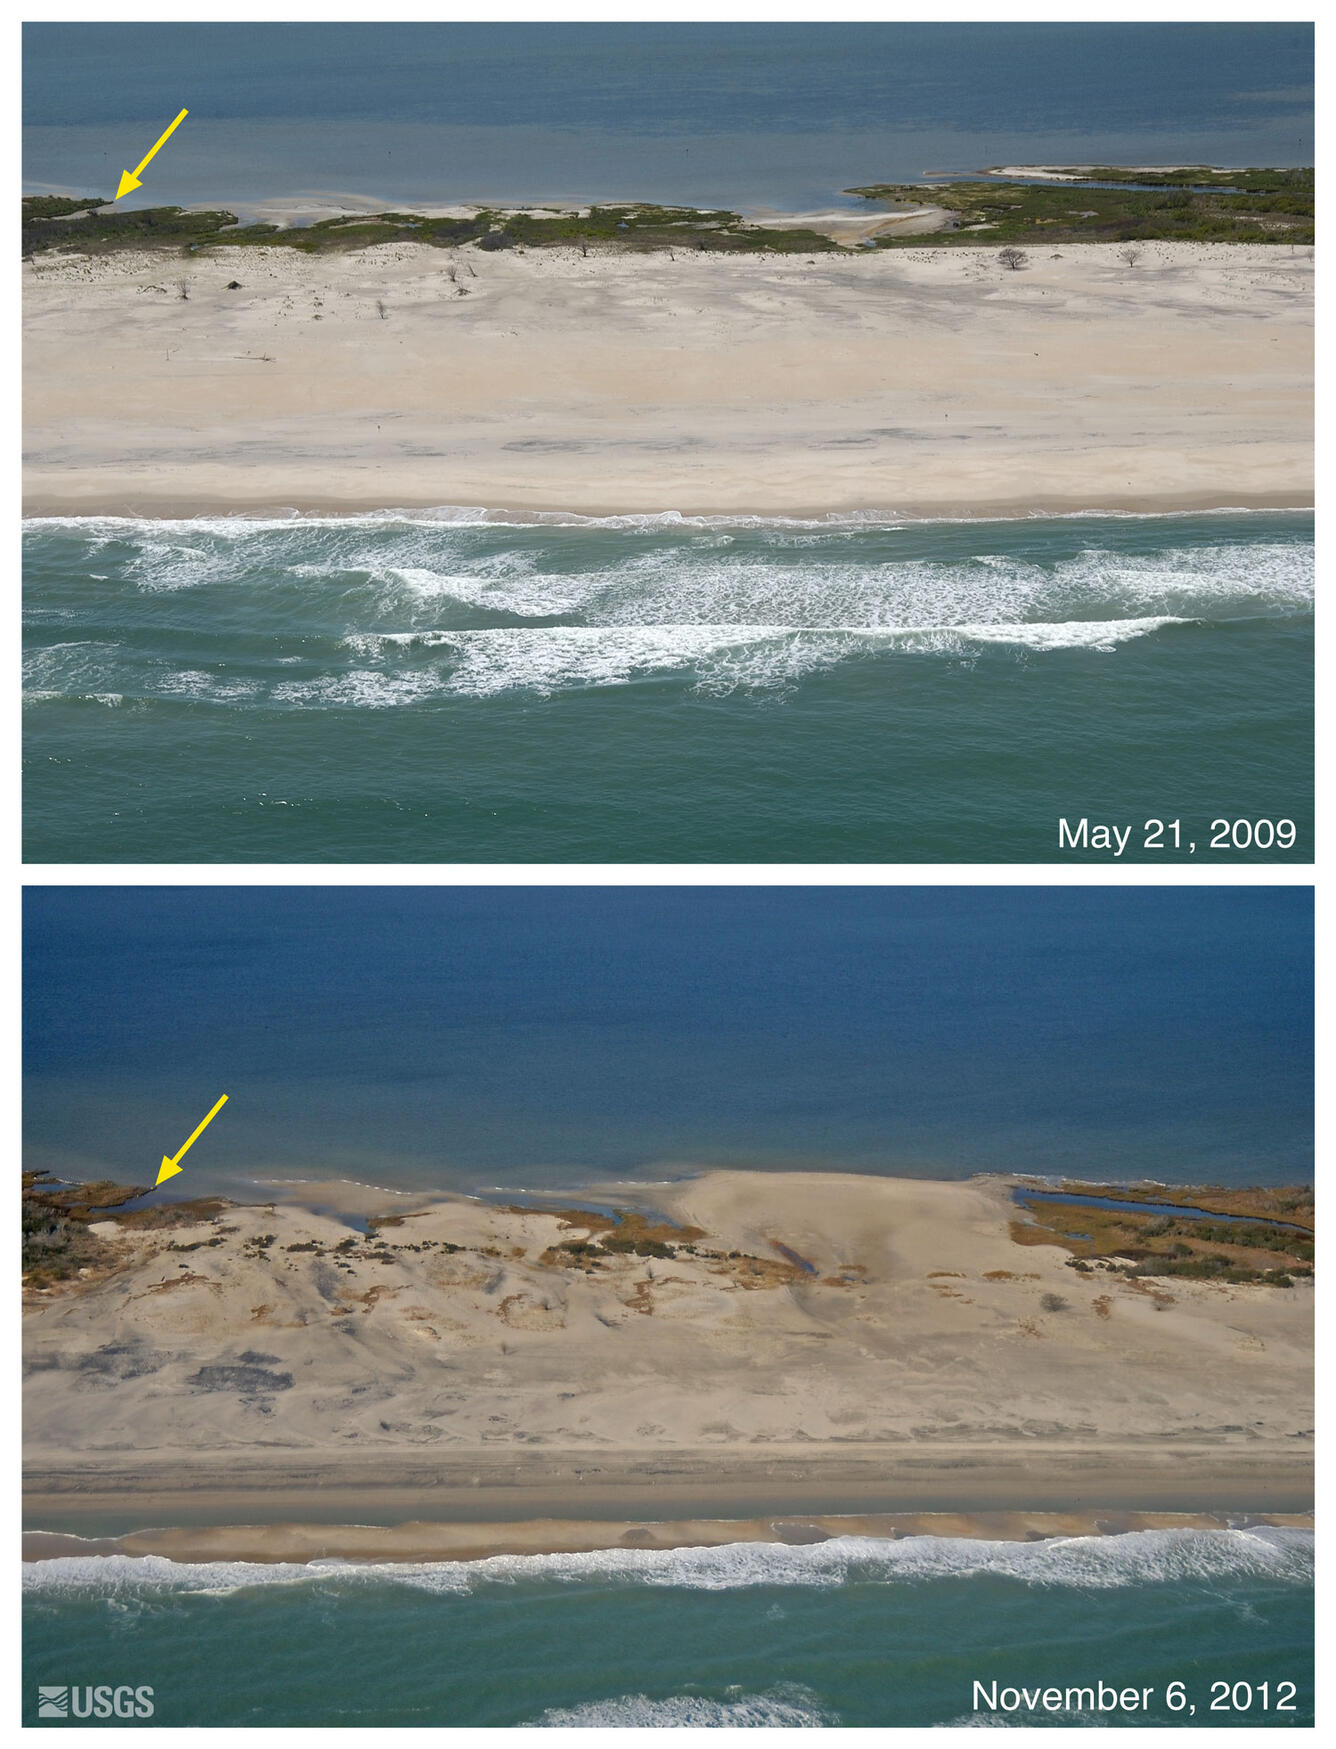
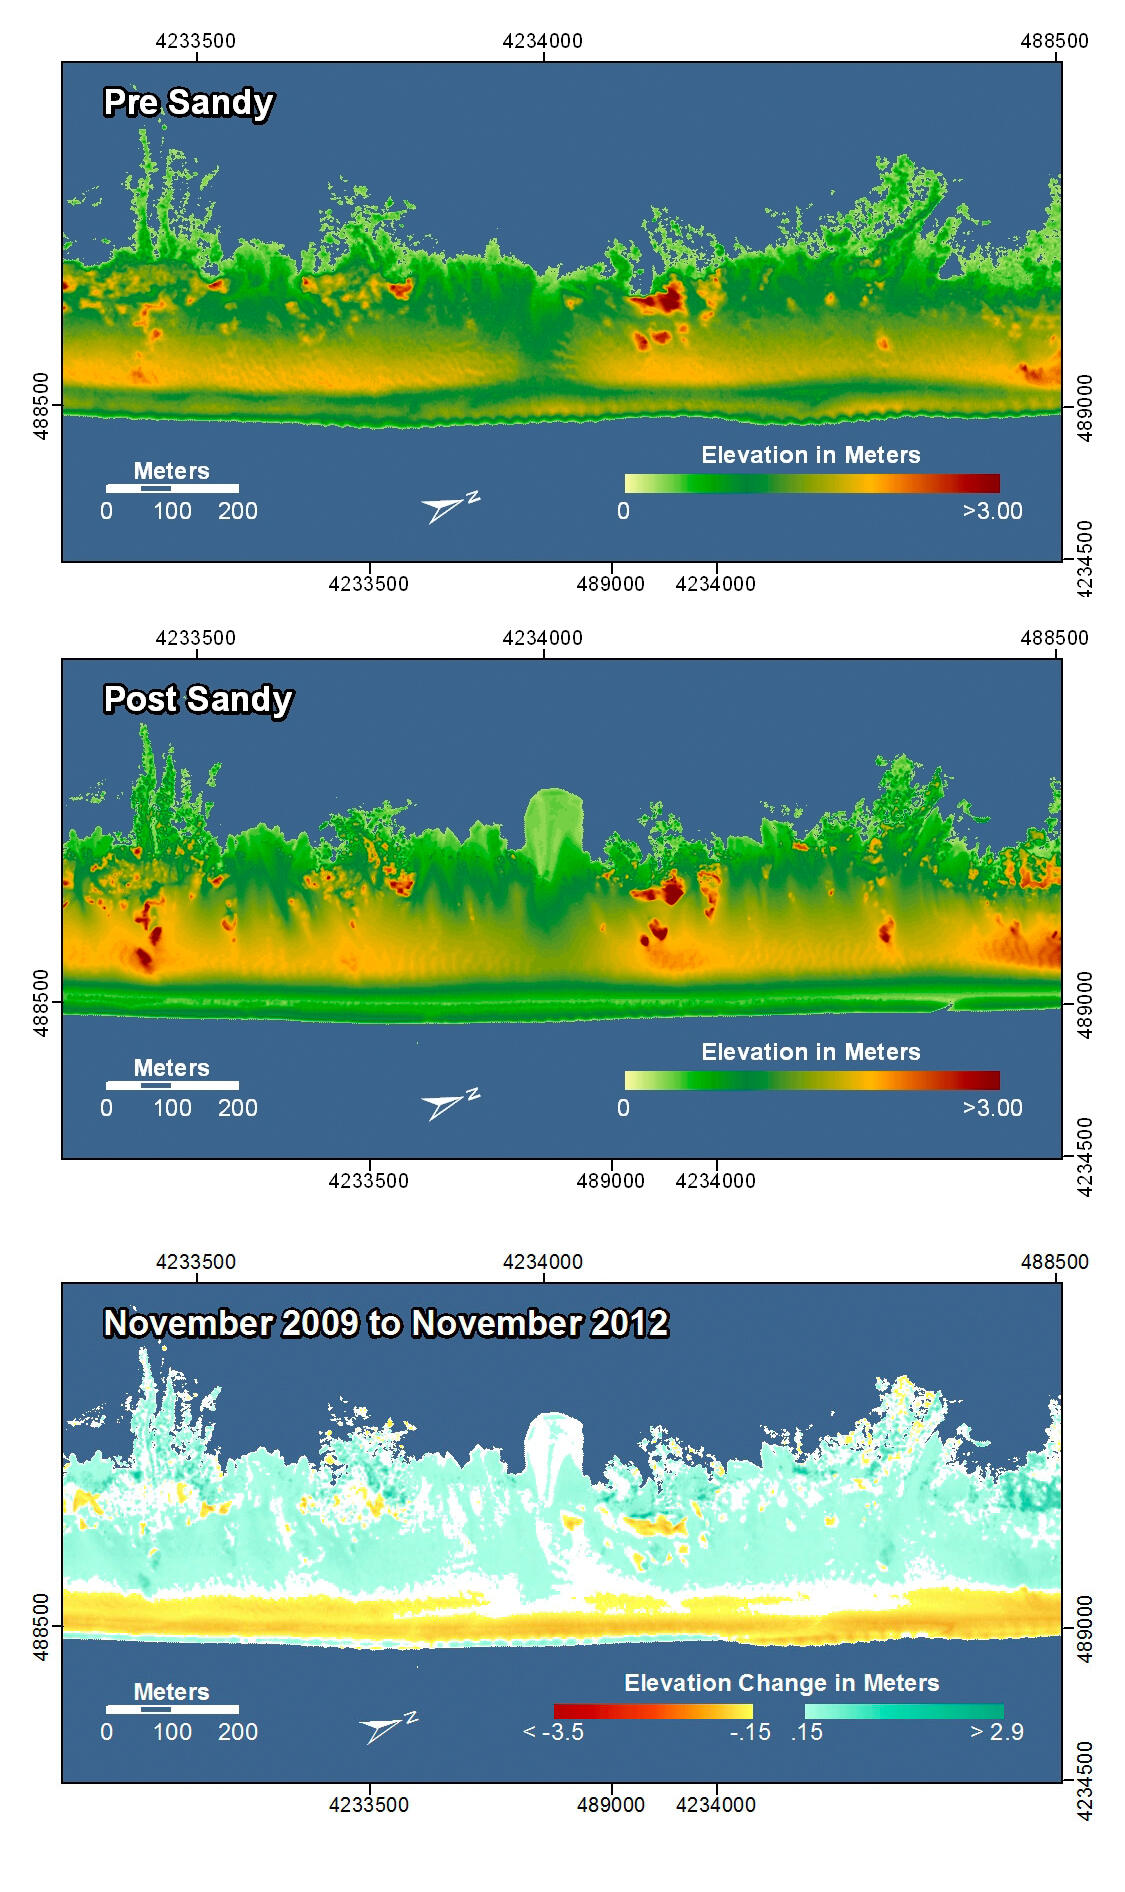
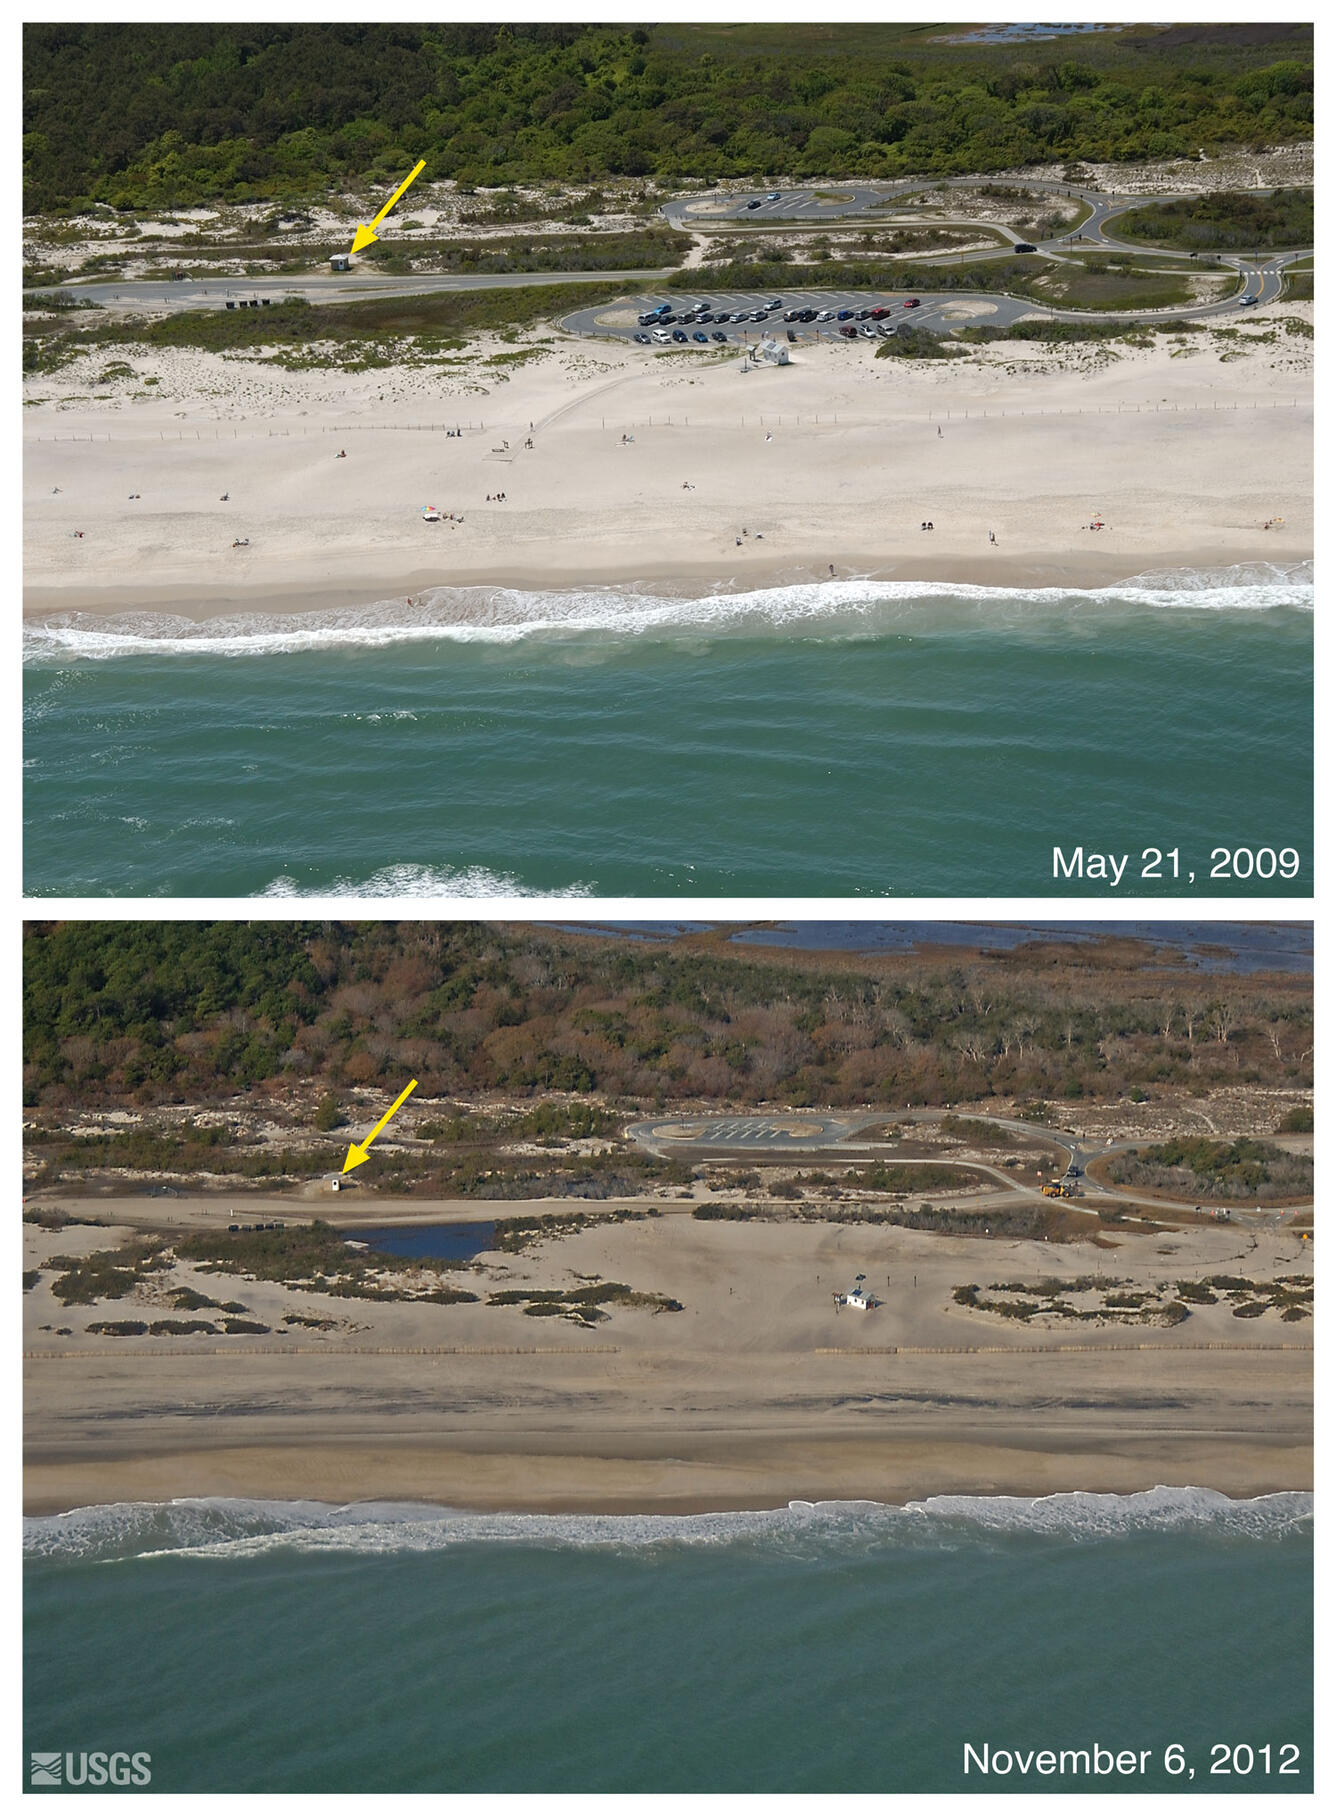
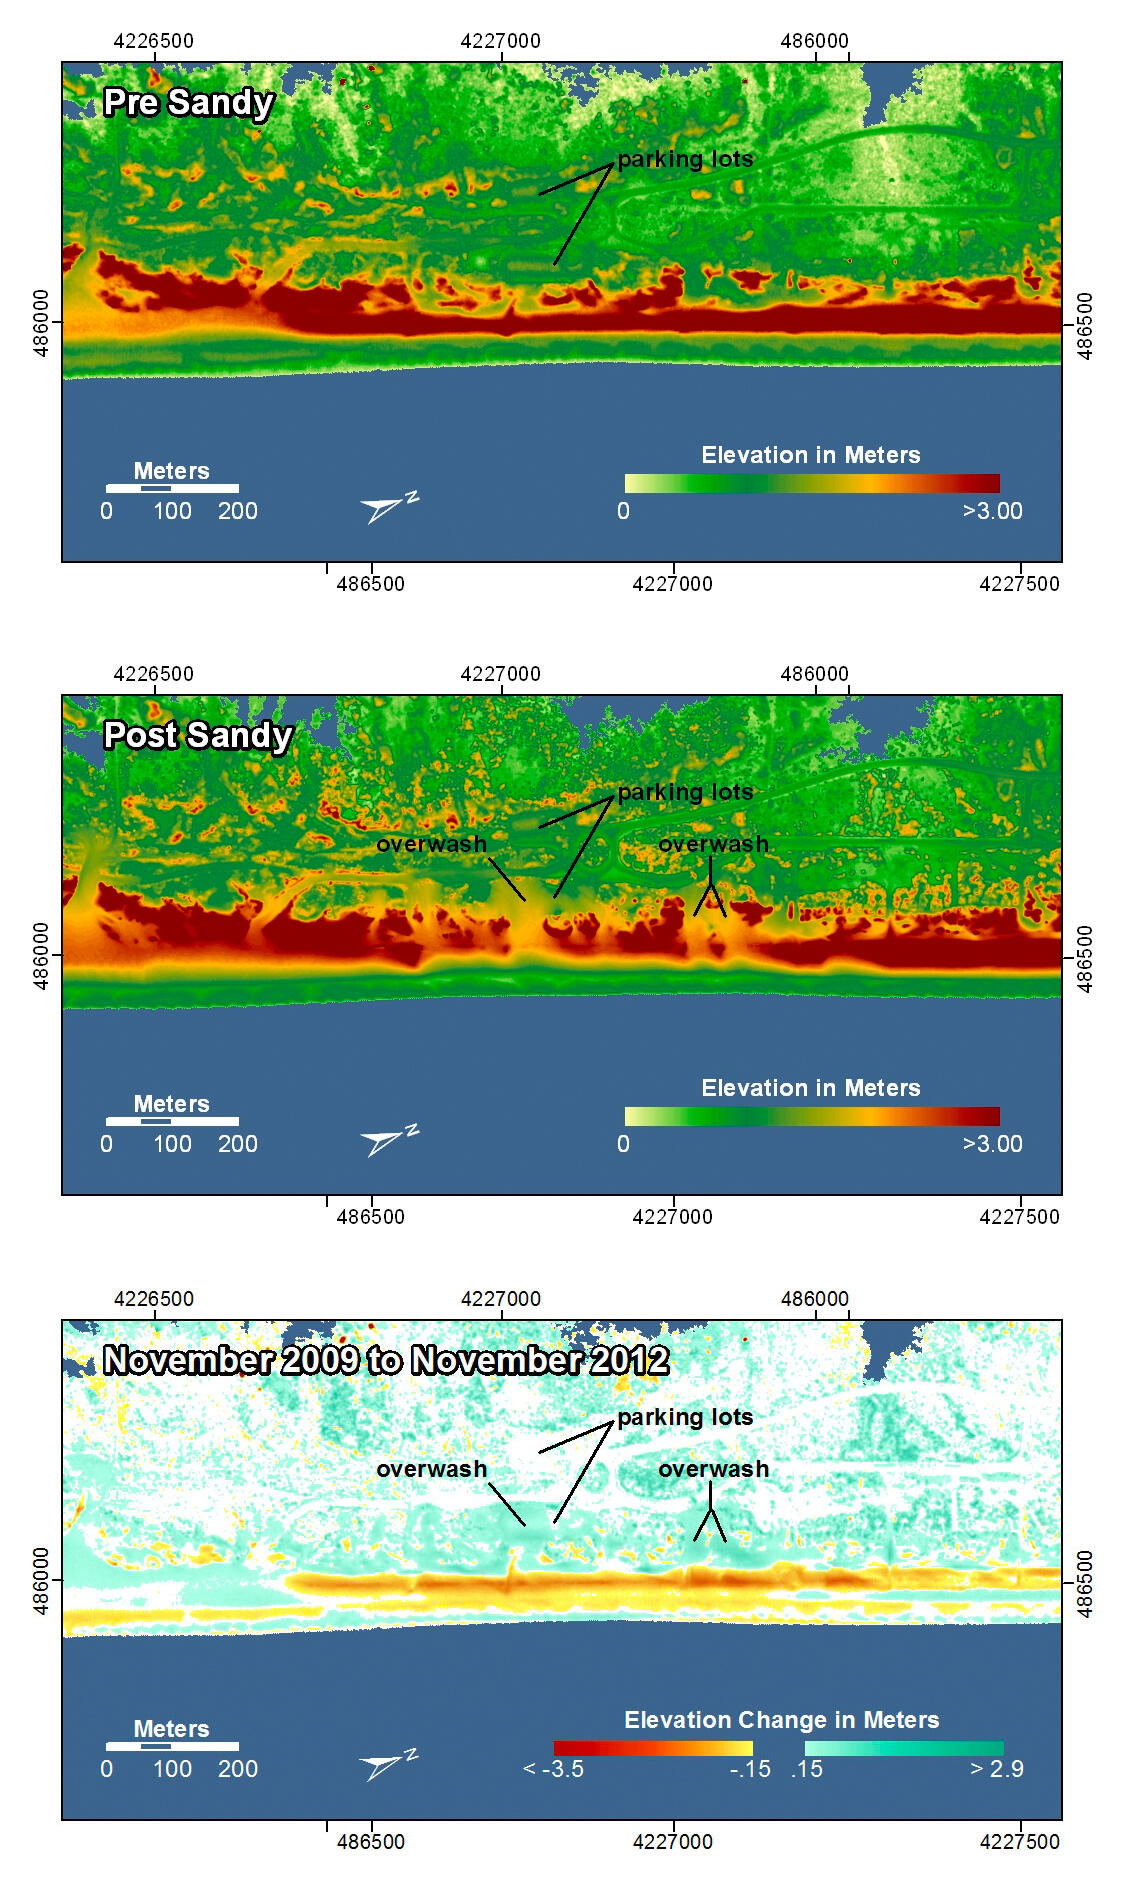
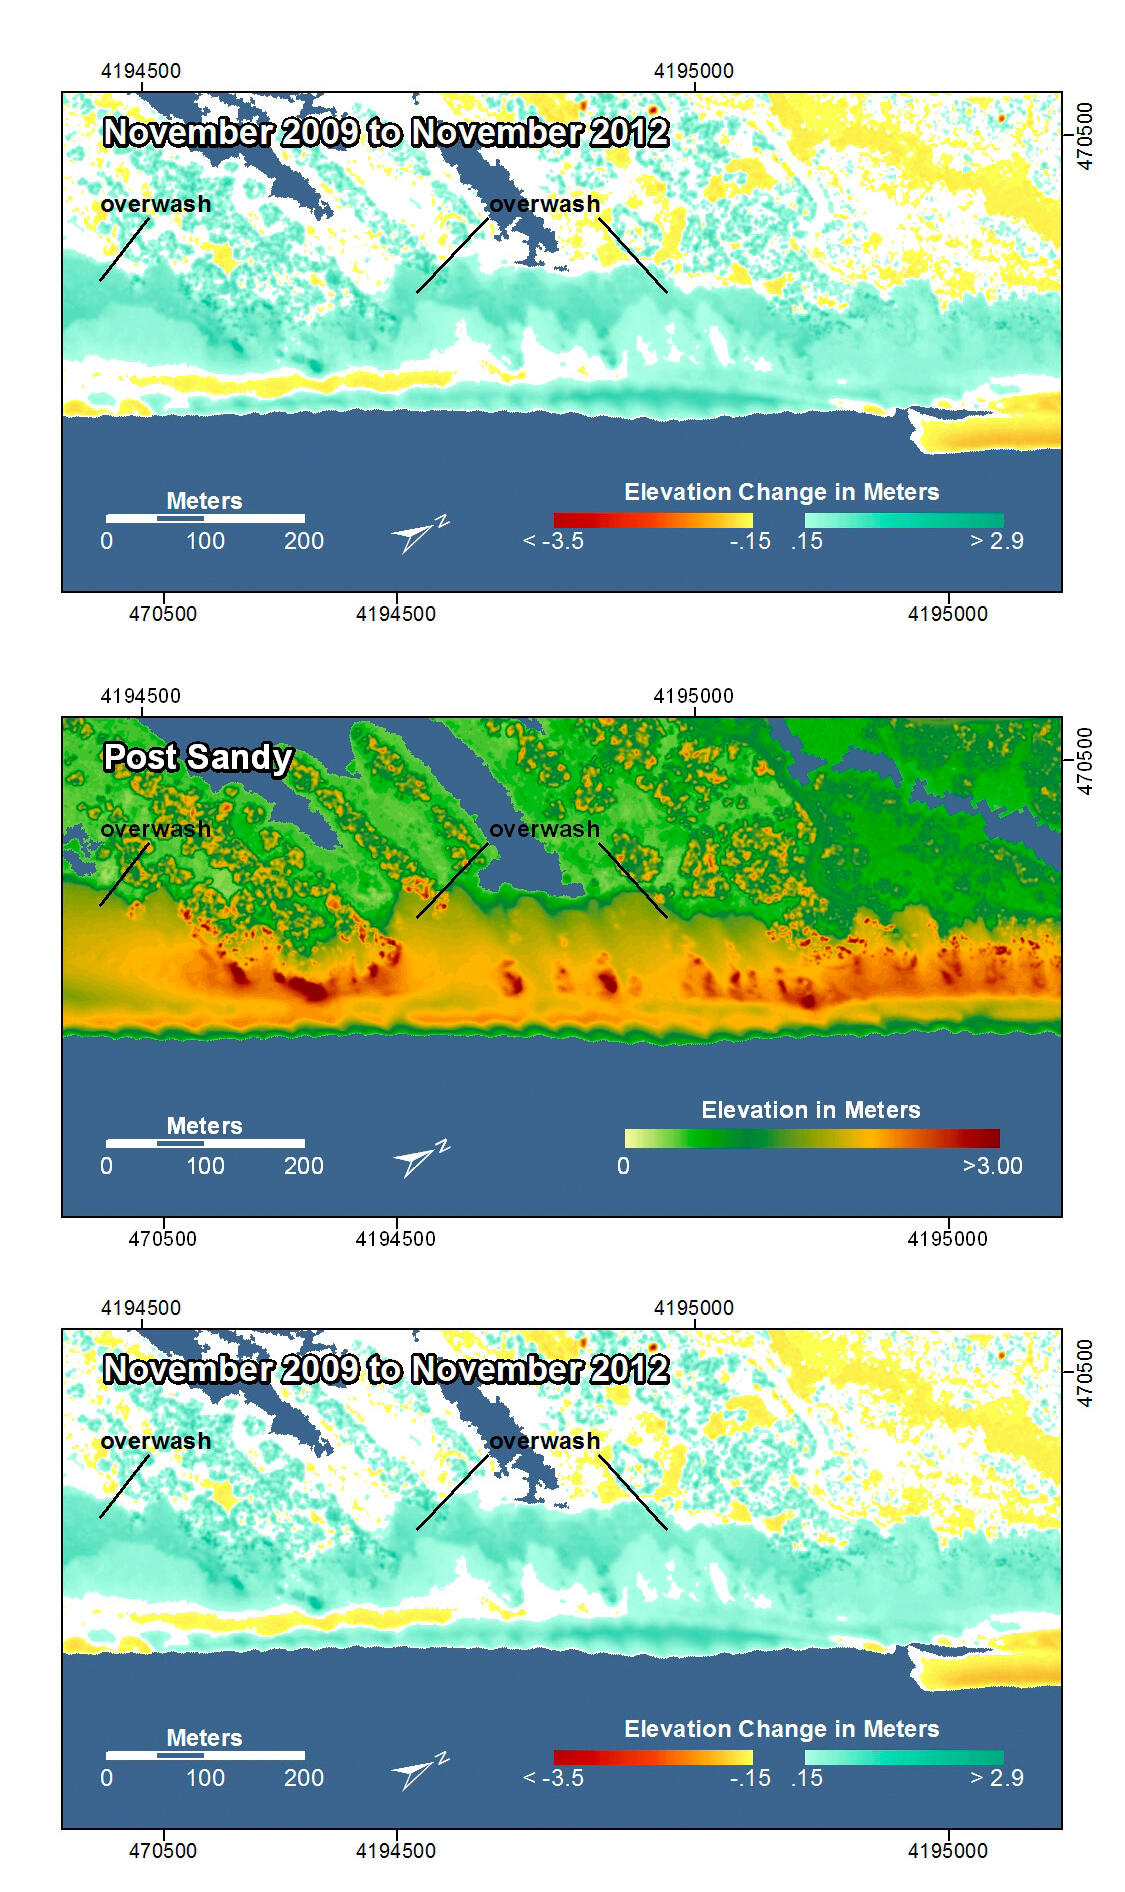
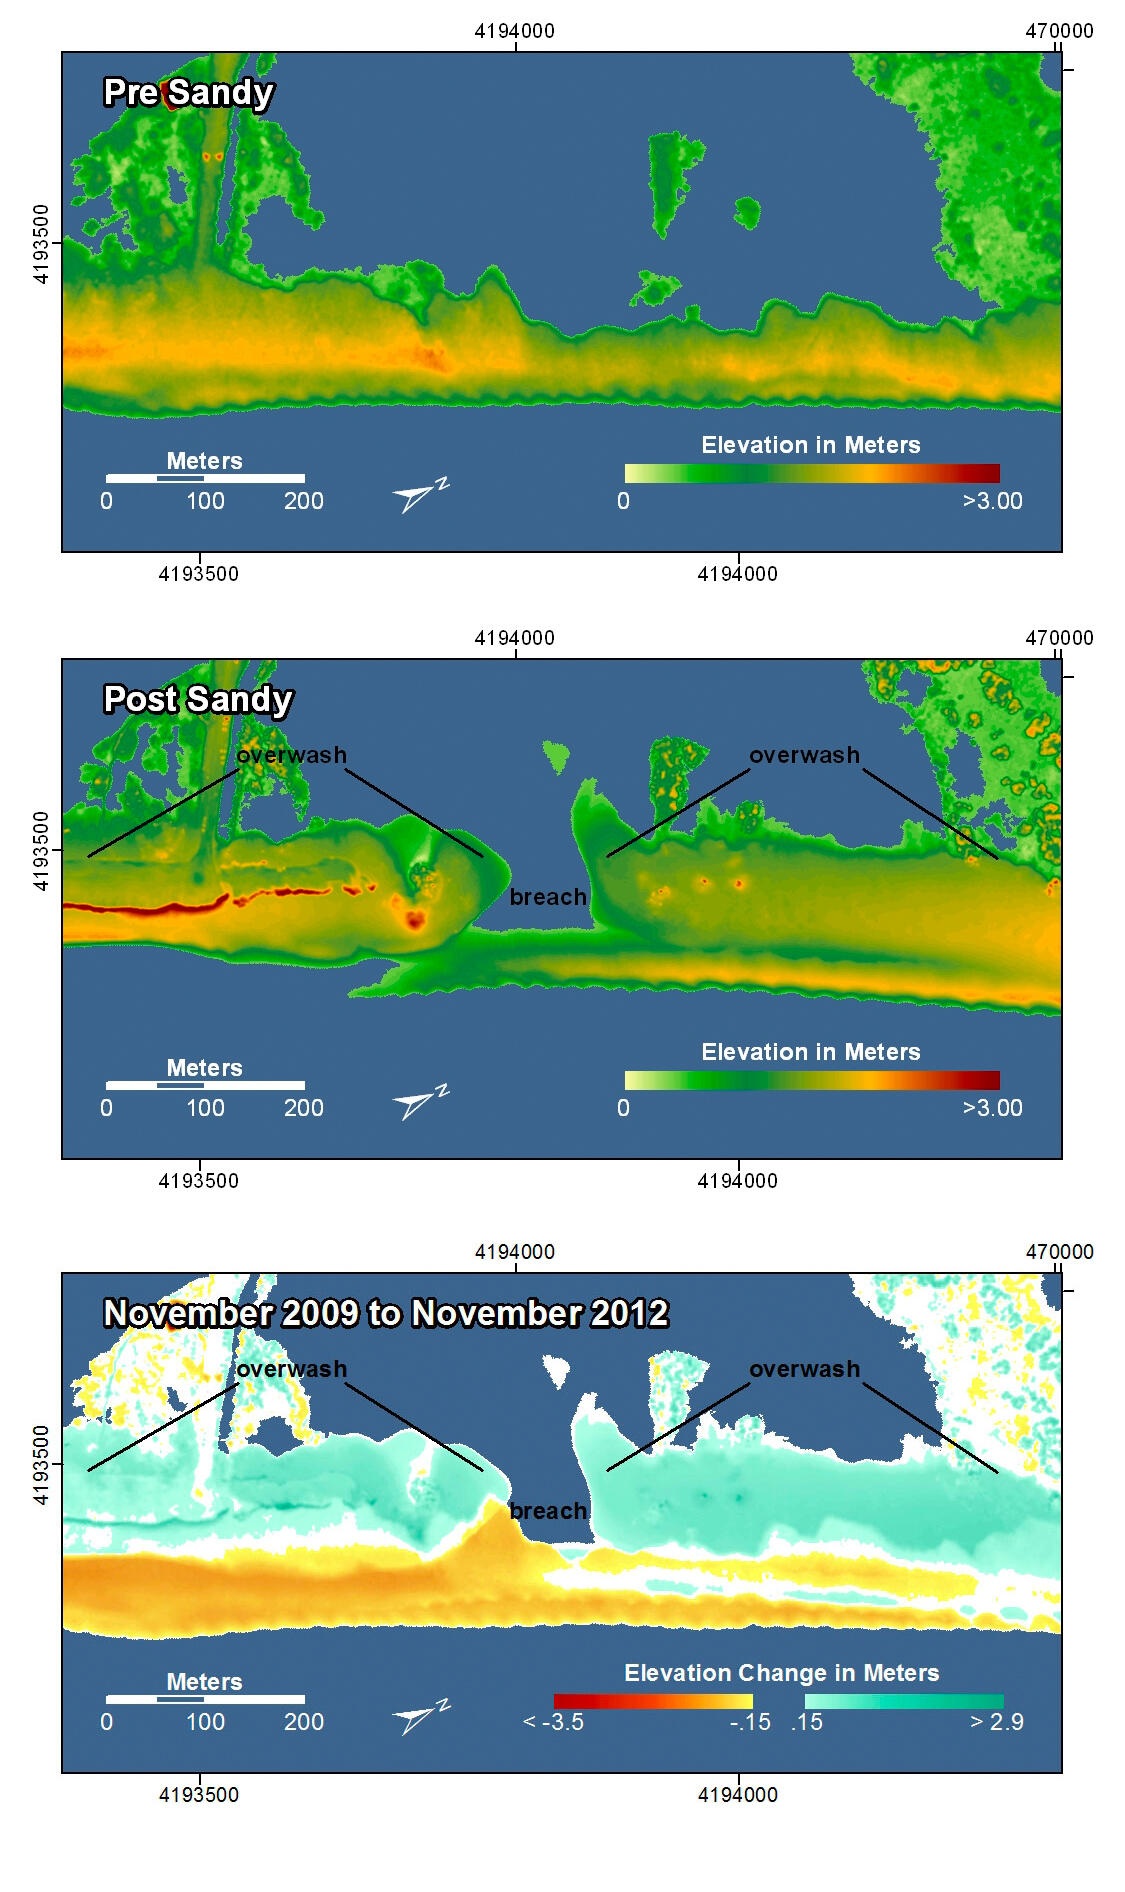
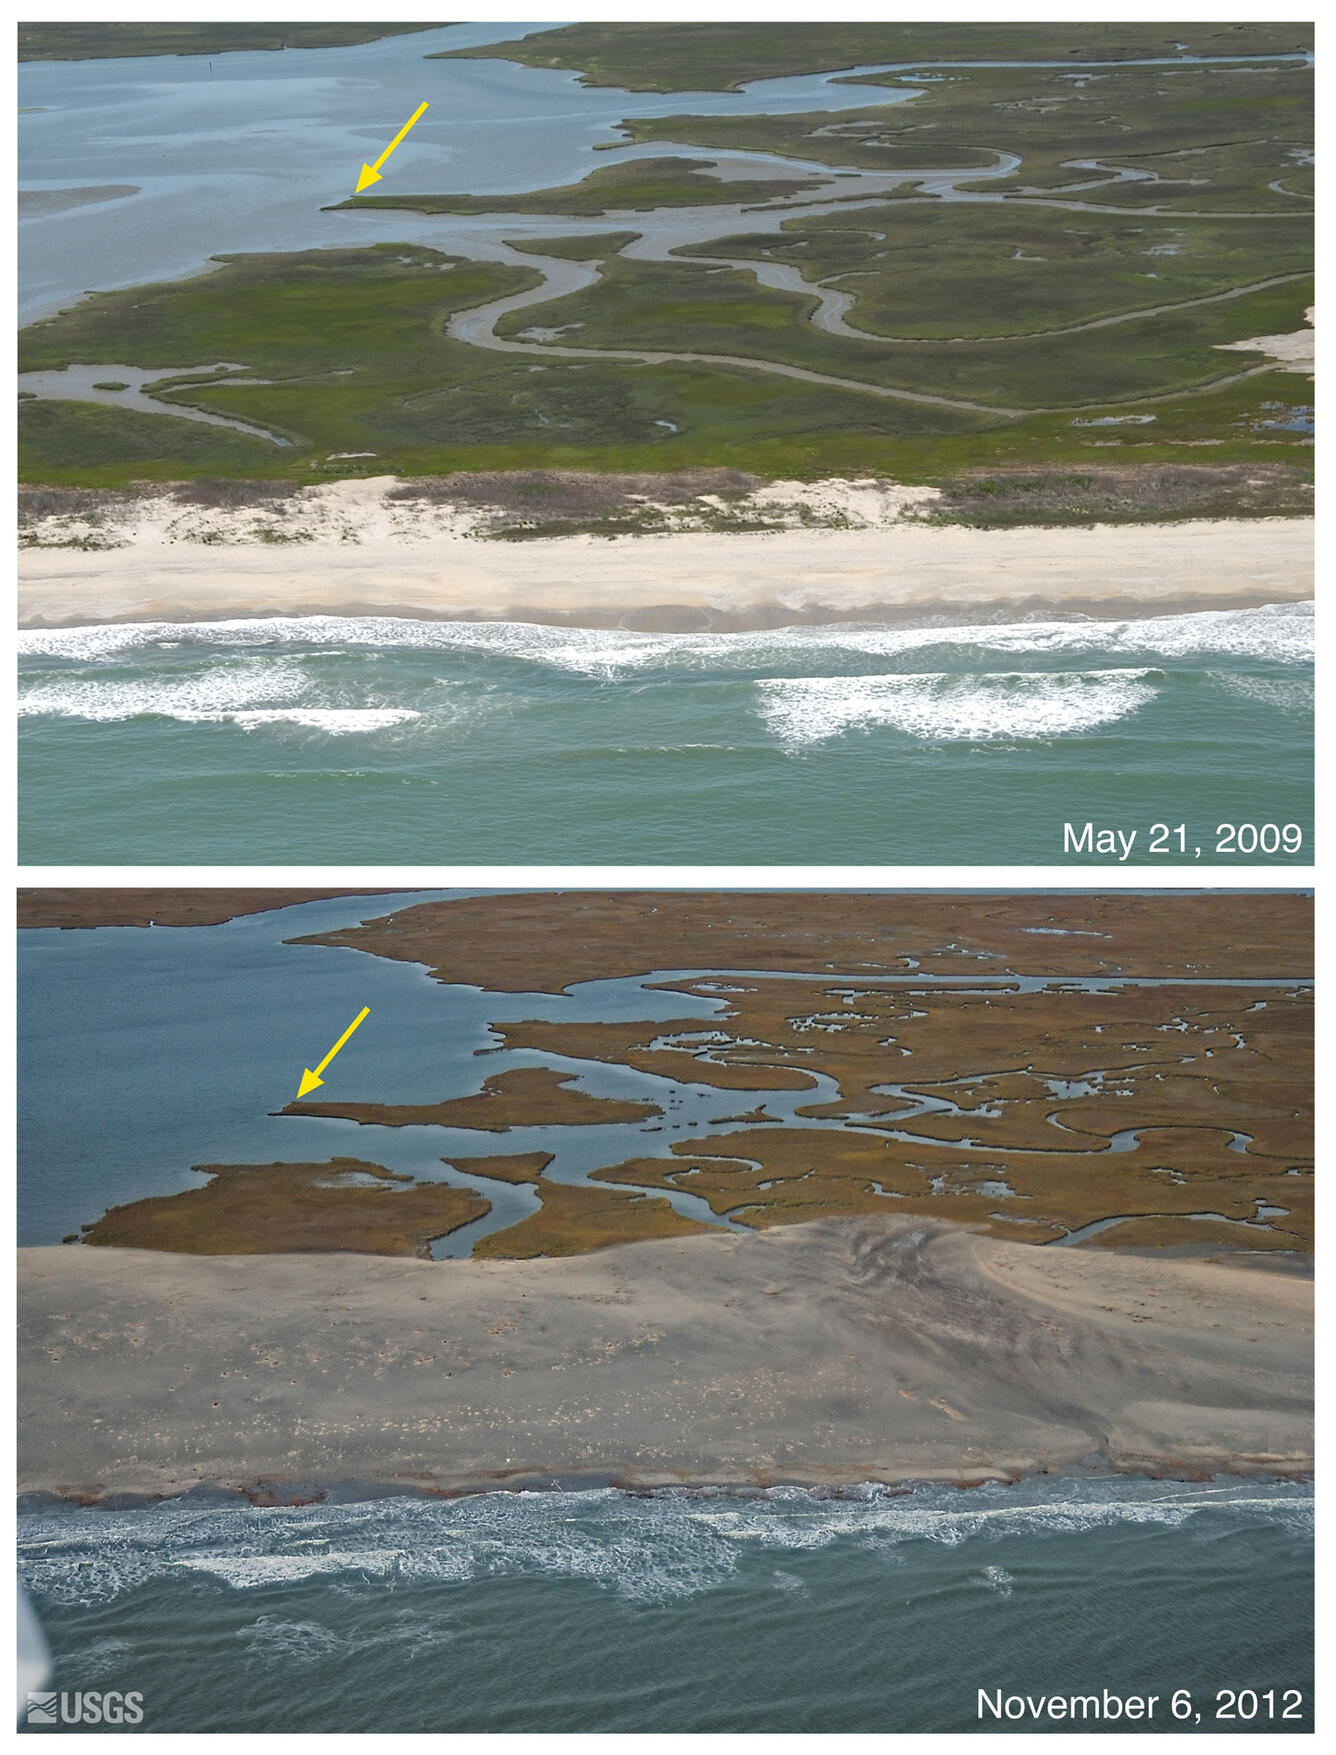
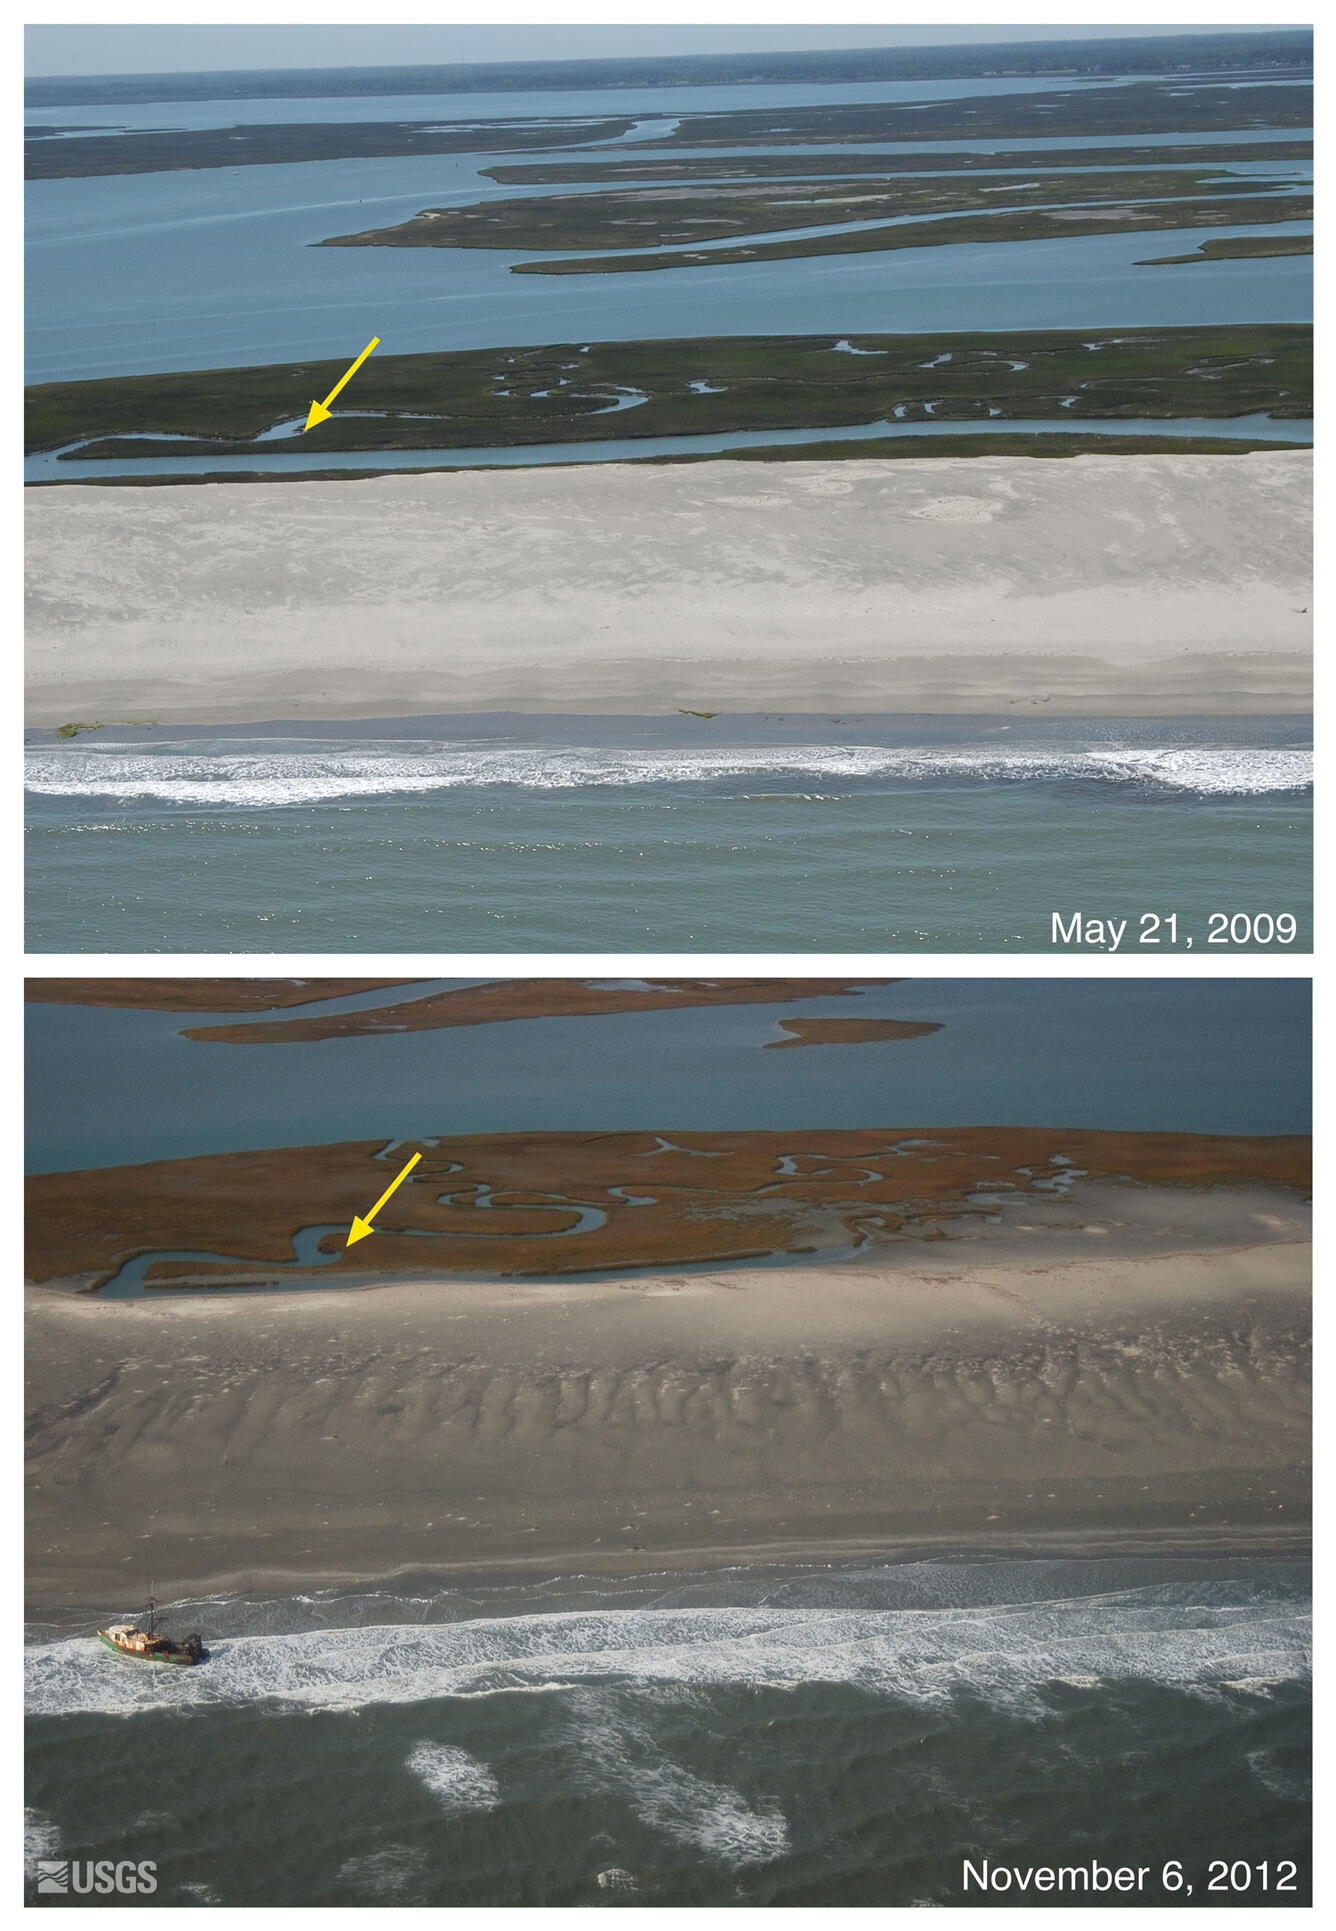
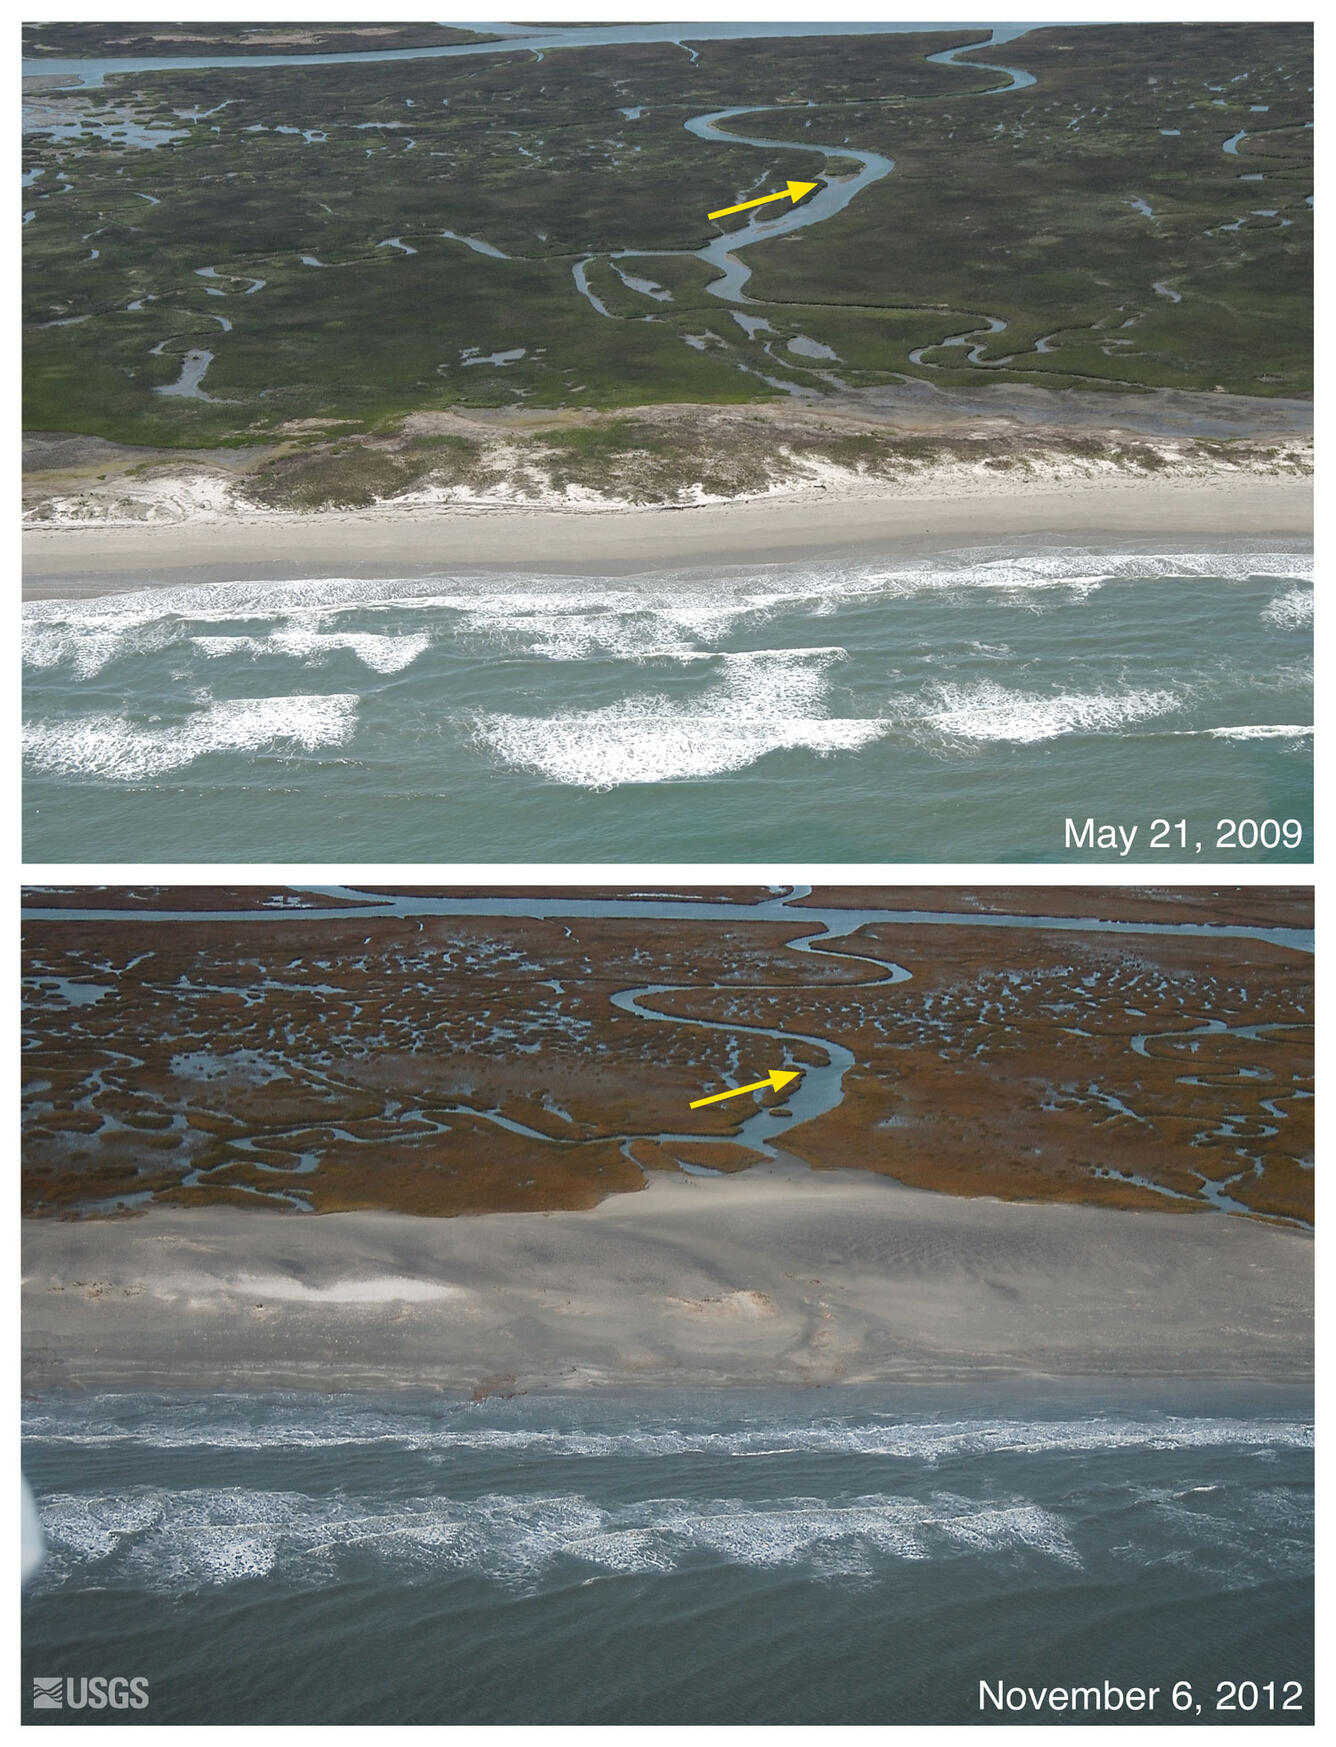
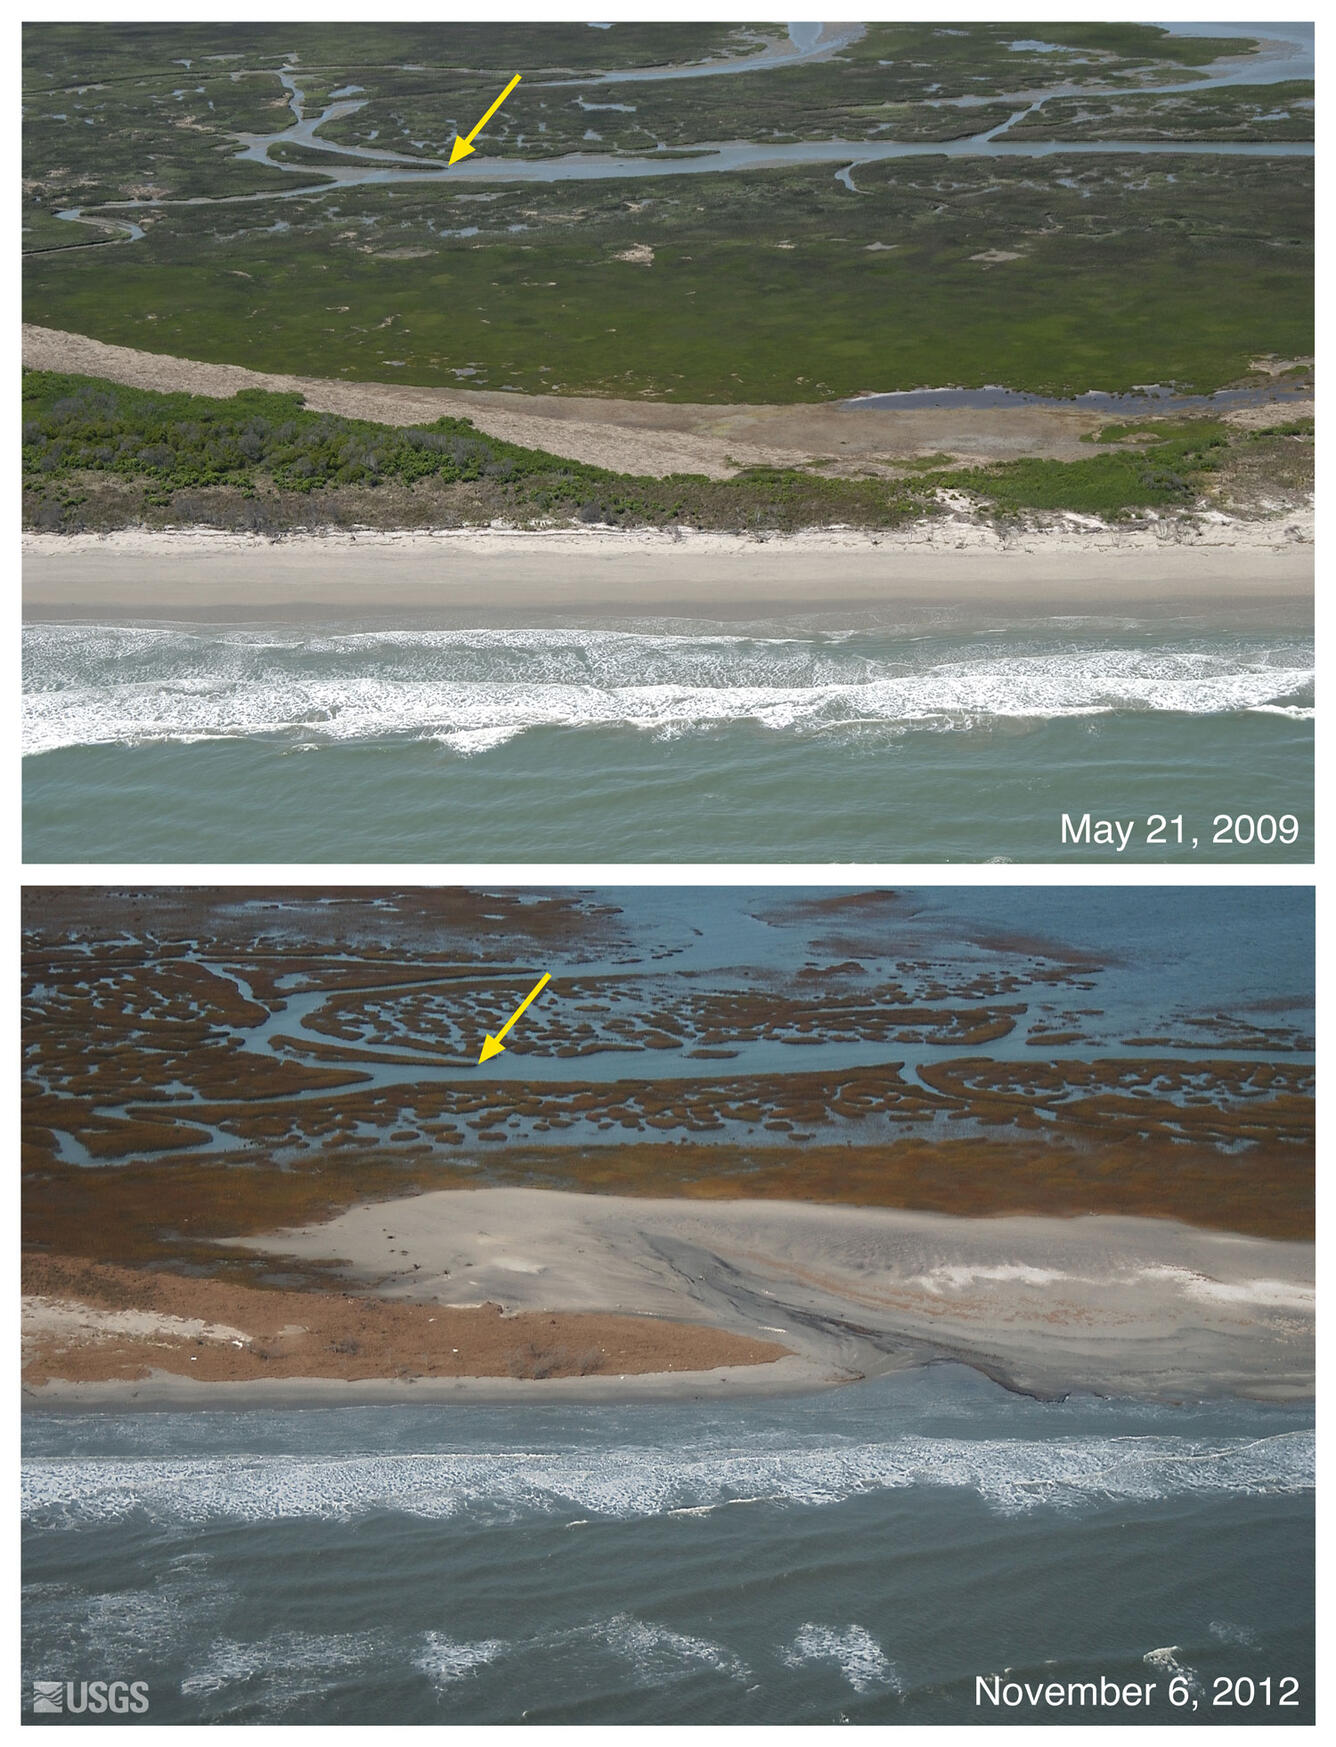
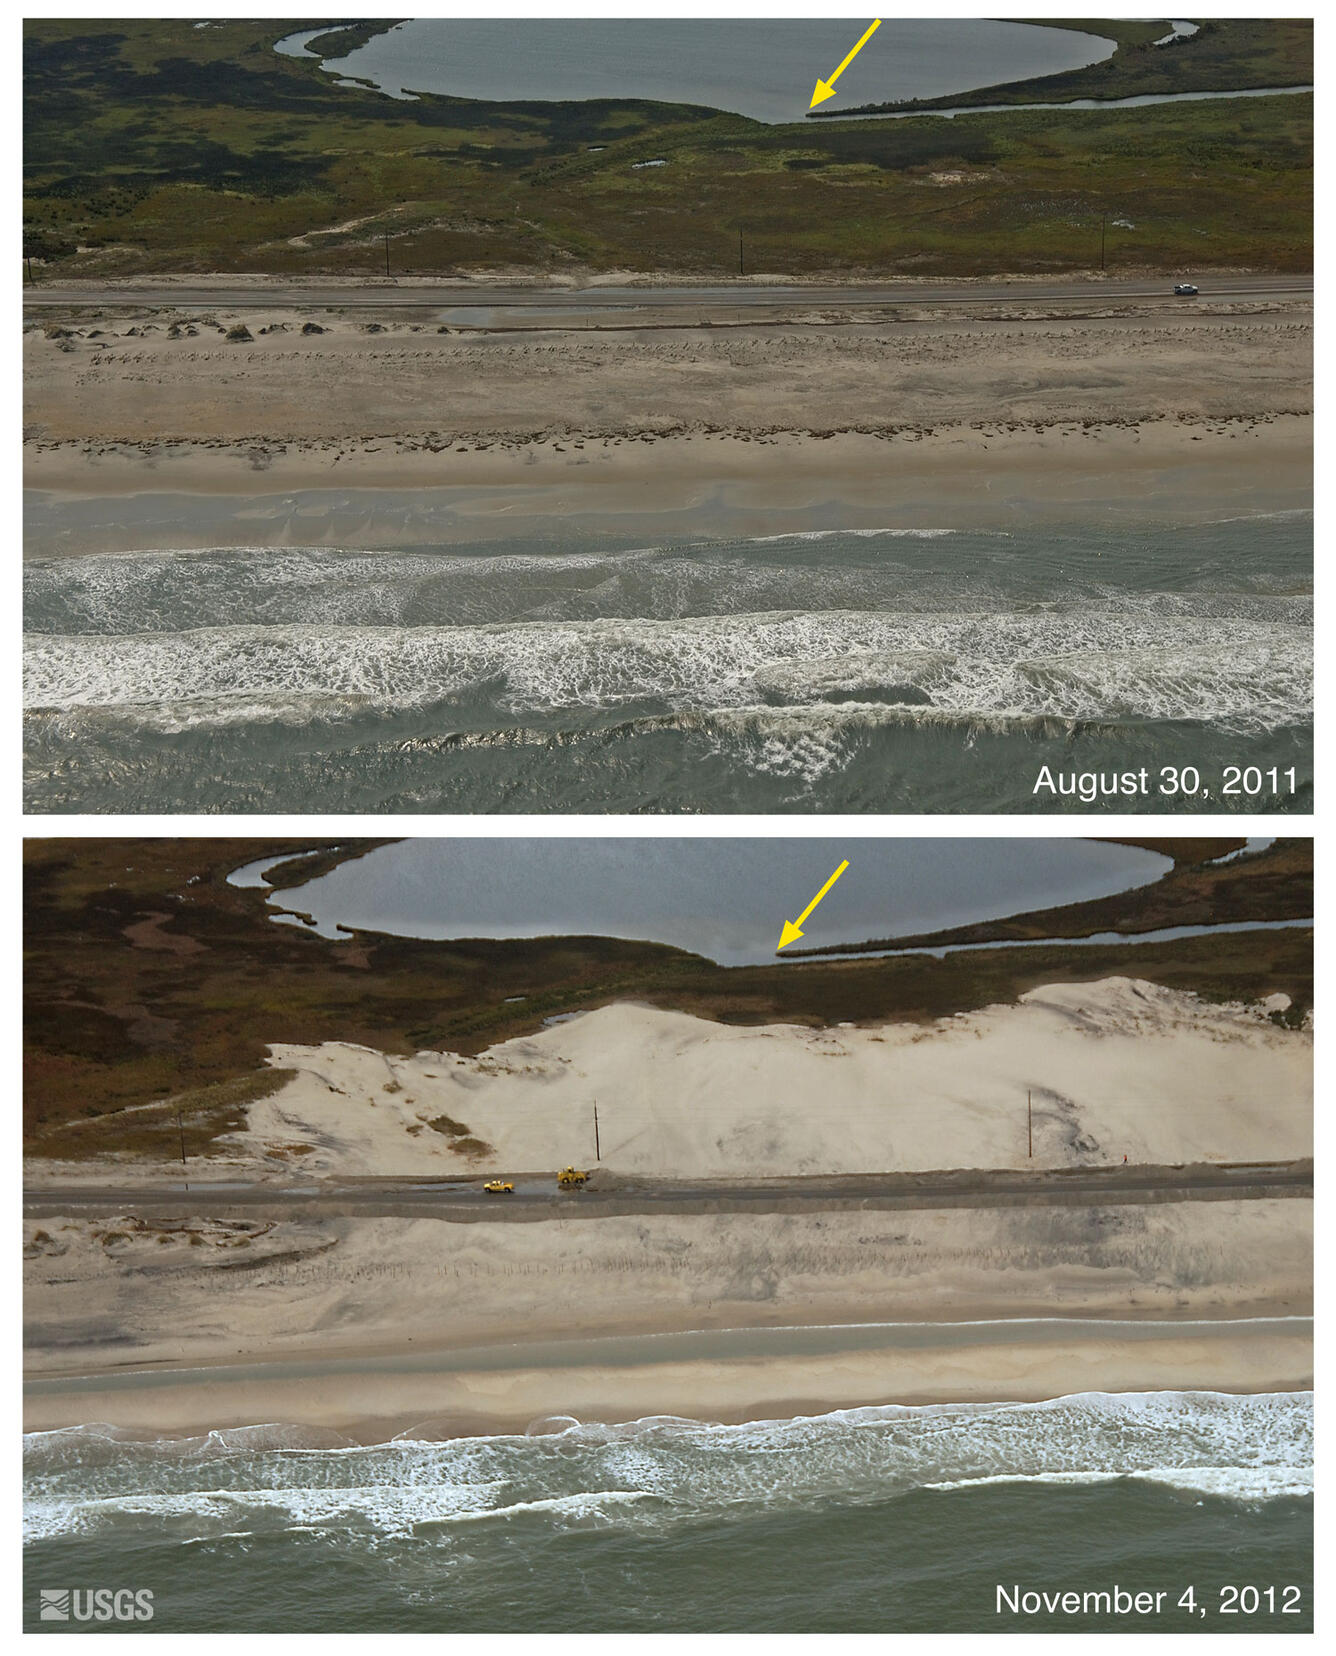
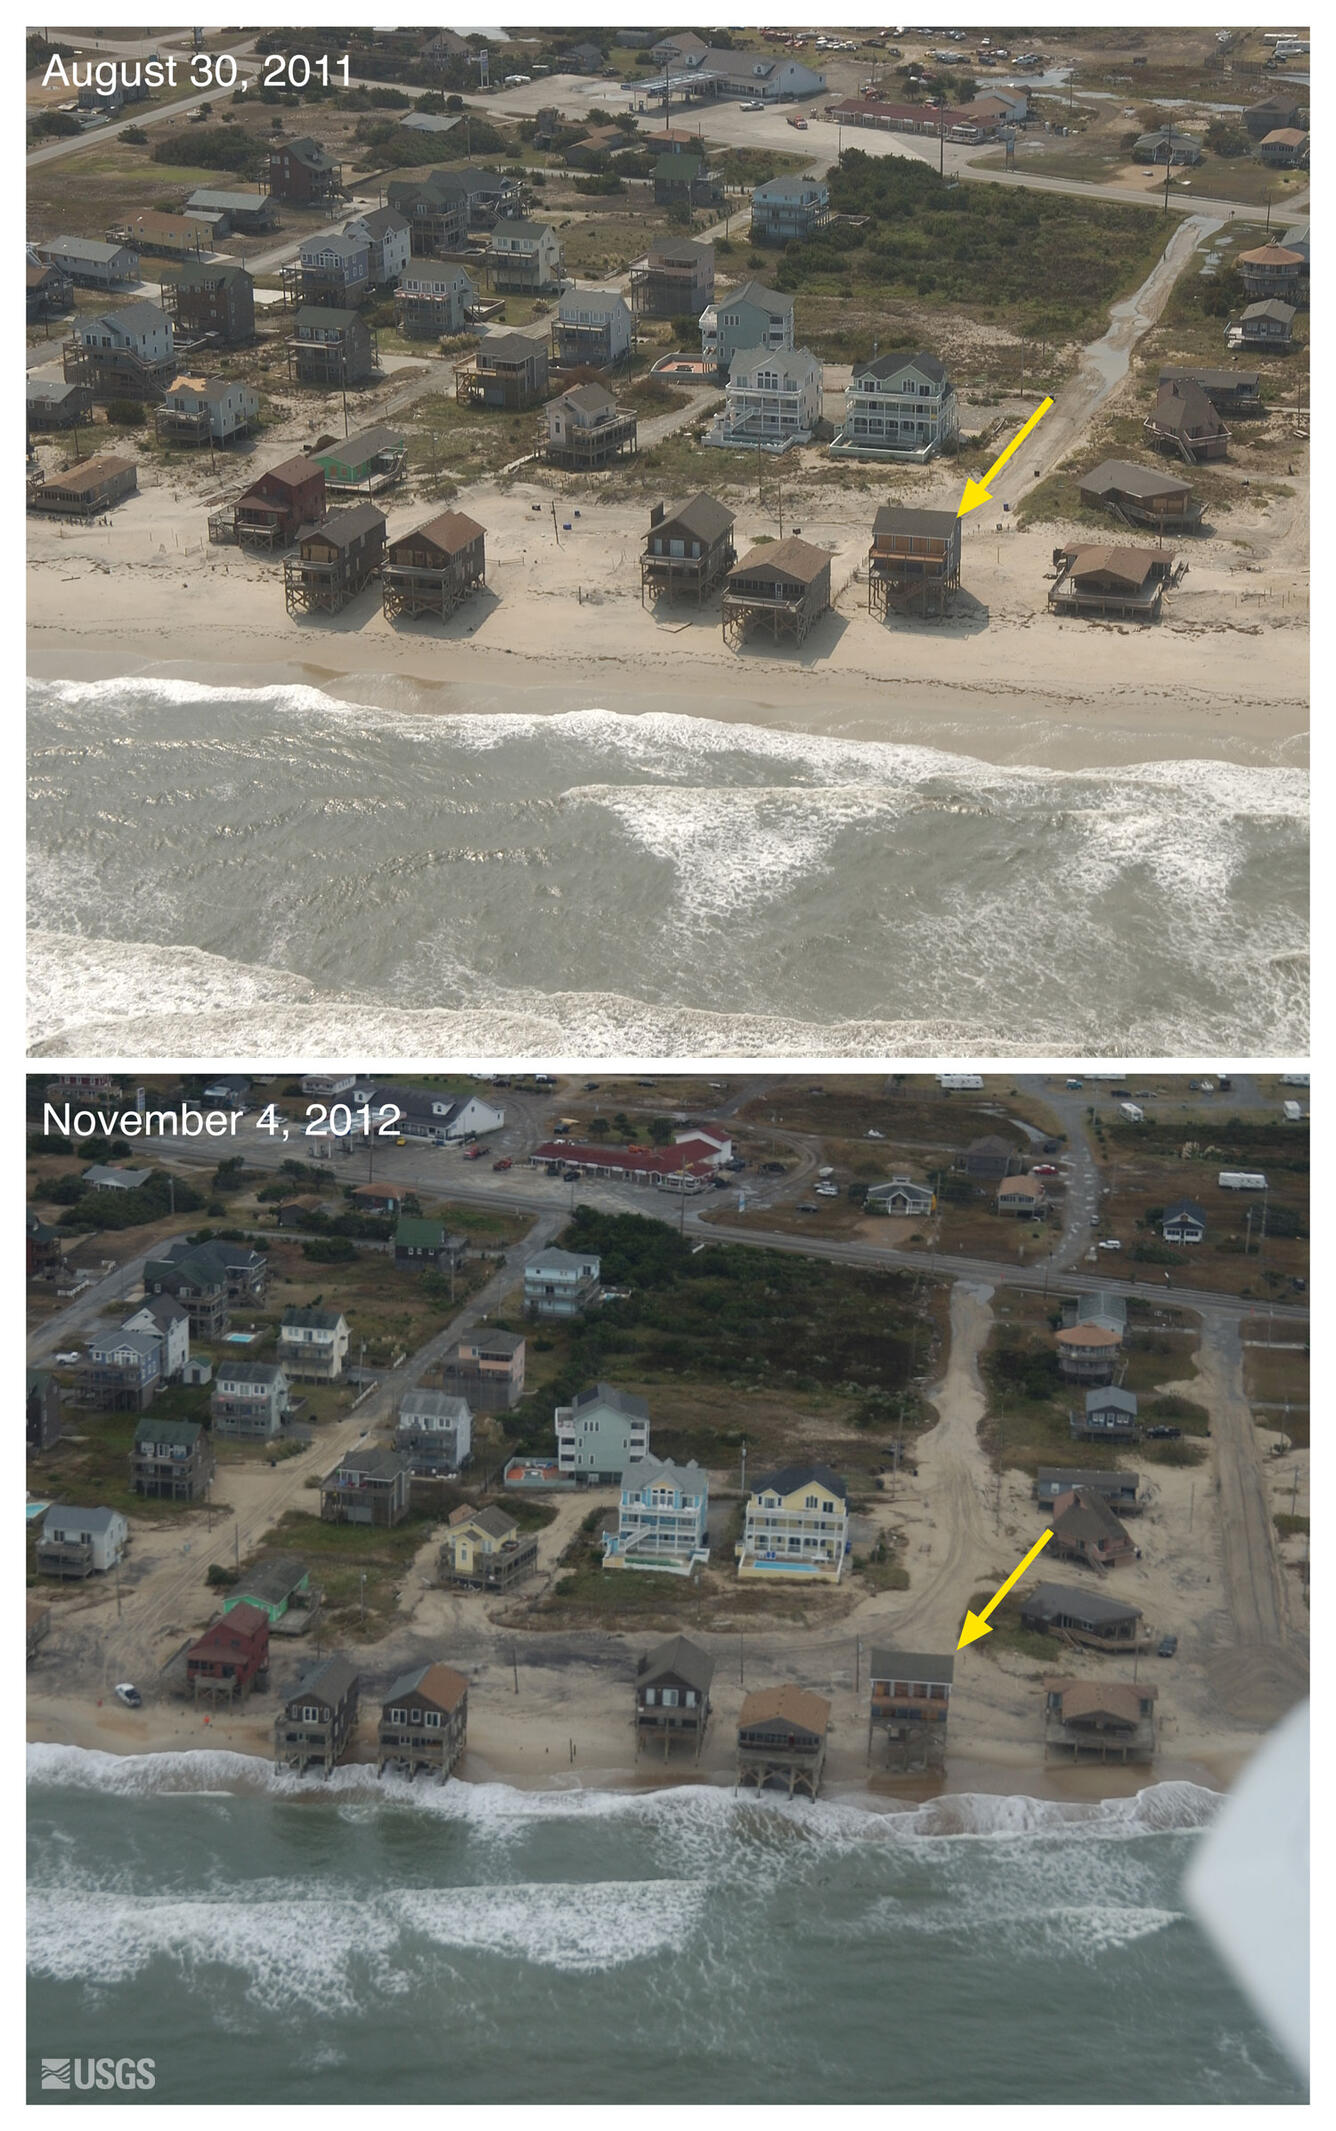
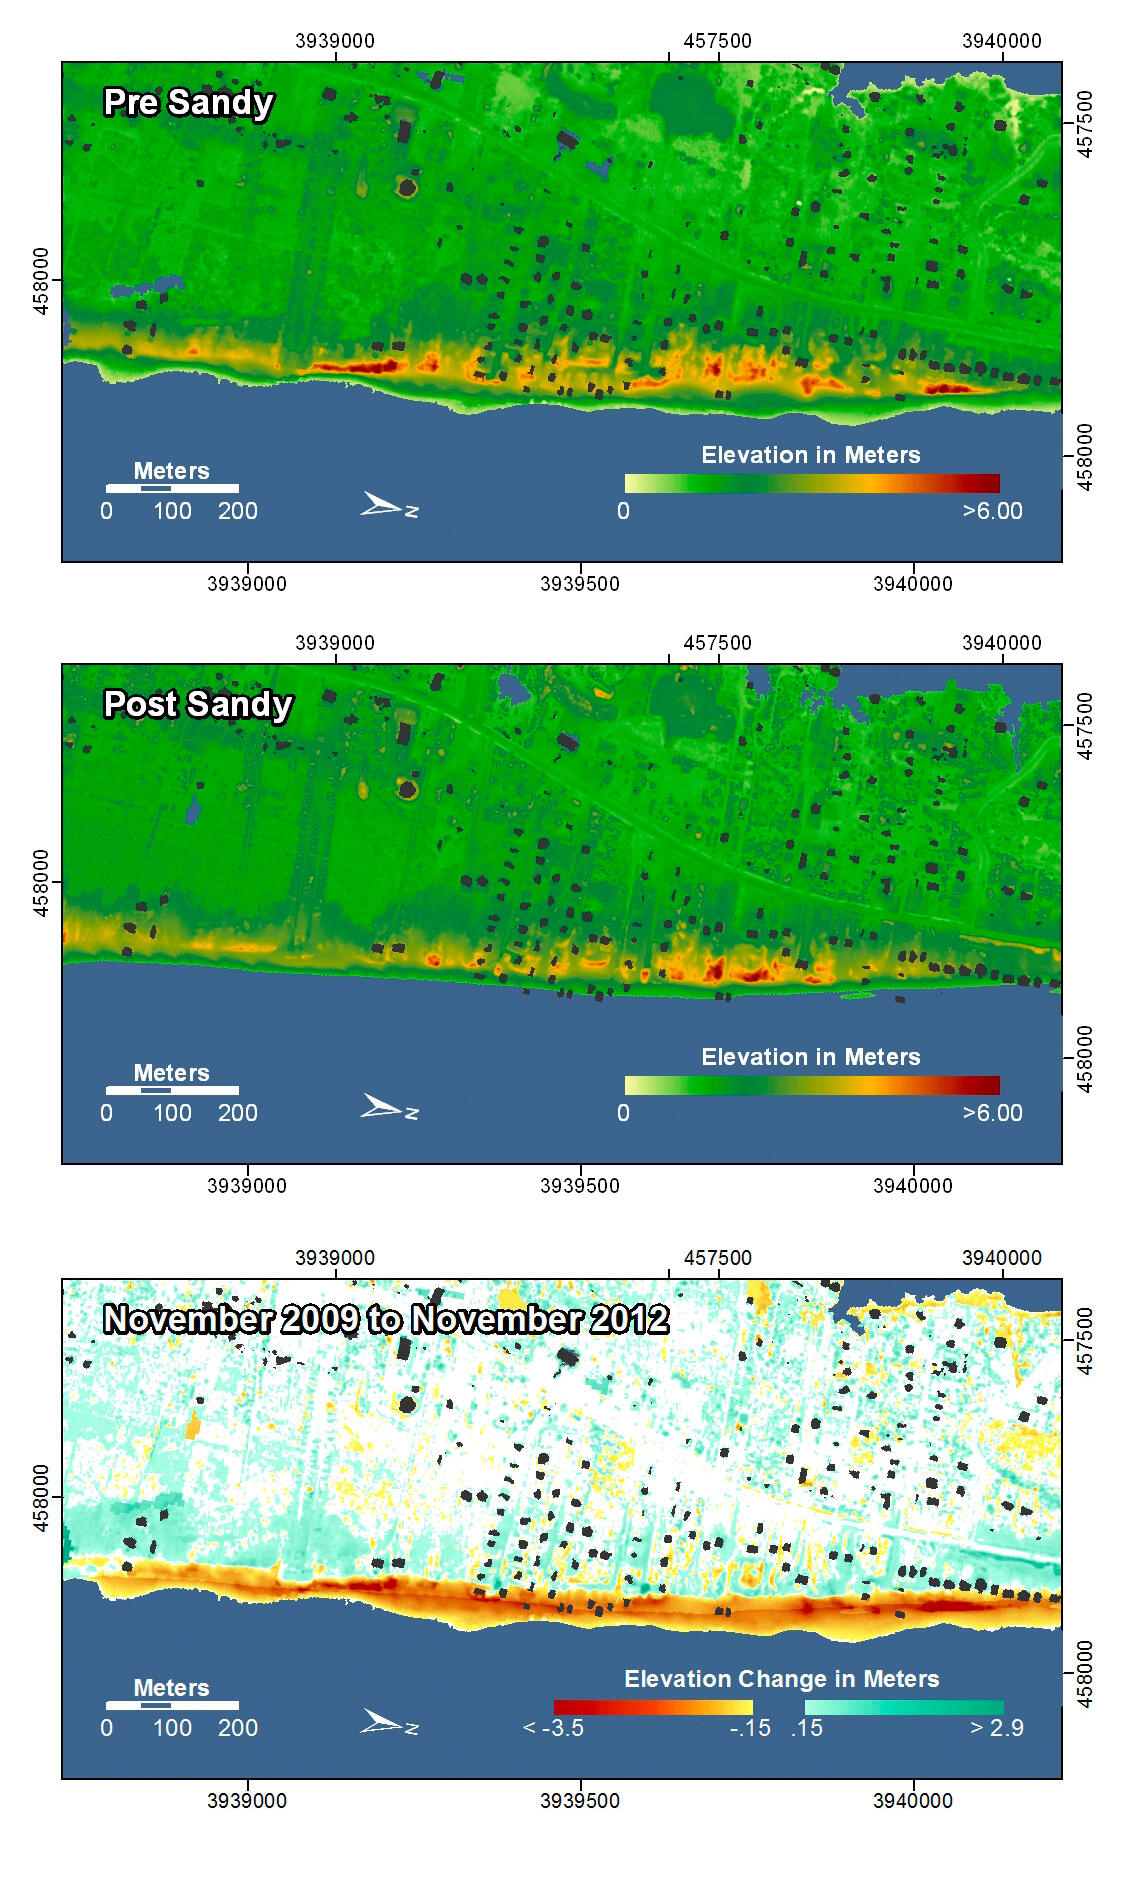
Following landfall, oblique aerial photography and lidar surveys of beach elevations were used to document the changes that occurred as a result of the storm. In addition, field measurements of the beaches and dunes were collected immediately after the storm. Comparisons of data collected before the storm show the nature, magnitude and spatial variability of the coastal response. These data will be used to further refine predictive models for storm-induced erosion.
All of the pre- and post-storm photos for Hurricane Sandy are available in the Oblique Aerial Photography Viewer.


Field Observations and Measurements of Coastal Change - Fire Island, New York
As Hurricane Sandy moved up the eastern U.S. coast and the forecasts were predicting significant impacts to the south shore of Long Island, a field team went to Fire Island on the south shore of Long Island, New York, to survey the beach, dunes and shoreline. The pre-storm survey was conducted on October 28, 2012. Following the storm, surveys were conducted over several days (November 1 and 2, 2012) to measure beach and dune erosion.
The impacts to the island were extensive. The majority of oceanfront homes in the communities within Fire Island National Seashore were damaged or destroyed. Enormous volumes of sand were carried from the beach and dunes to the central portion of the island, forming large overwash deposits, and the island was breached in 3 locations. With few exceptions, lower-relief dunes were overwashed and flattened. High dunes, which are more commonly found within undeveloped portions of the island, experienced severe erosion and overwash. The elevation of the beach was lowered and the dunes form vertical scarps where they survived.


Some key findings of the field data collection effort indicate that:
-
50% of the dunes on Fire Island were overwashed during the storm, carrying large volumes of material to the interior portion of the island
-
In locations where the dunes remained intact, they eroded an average of 22 meters in cross-beach position
-
Dune elevation losses were as high as 5meters and the berm of the beach was lowered by as much as 3 meters
The USGS worked closely with personnel from the National Park Service (NPS) to gain access to the island, and to survey and measure the dramatic changes to the barrier system. The post-storm data was used to help the NPS assess the areas of the coast that were most vulnerable to a nor'easter that impacted the coast a week after Sandy.


Below are other science projects associated with this project.

Hurricane Sandy Response- Linking the Delmarva Peninsula's Geologic Framework to Coastal Vulnerability

Hurricane Sandy Response - Storm Impacts and Vulnerability of Coastal Beaches

Hurricane Sandy Response - Barrier Island and Estuarine Wetland Physical Change Assessment

Forecasting Coastal Change

National Assessment of Coastal Change Hazards
Hurricane Sandy coastal change forecast and pre- and post-storm photos documenting coastal change.
Hurricane Sandy made landfall on October 30, 2012, and impacted a long swath of the Mid-Atlantic coastline. Many areas that had been hit by Hurricane Irene in August 2011 were again battered by strong waves and surge. The barrier islands were breached in a number of places and erosion of the beach and dunes occurred all along the Mid-Atlantic coast.
Response Activities
Forecast of Potential Coastal Change
As Hurricane Sandy moved northward along the U.S. Atlantic coast in October 2012, U.S. Geological Survey scientists worked to determine where and how the storm's waves and surge might dramatically reshape the beaches and dunes that stand between the storm and coastal developments. Through a complex modeling process that uses coastal elevations, wave forecasts, and potential storm surge, they predicted coastal change hazards, such as shoreline and dune erosion, that might be expected during a Sandy landfall.
The coastal change forecast model predicts the probability of where and how sand dunes along the coast will be impacted by water levels during a storm. This includes the combined effect of surge and wave runup. The color band closest to the shoreline is the probability of dune erosion, the middle color band is the probability that sand dunes will be overtopped by waves during the storm, and the outer color band is the probability that the sand dunes will be completely inundated/flooded. The model forecast is available on the Coastal Change Hazards Portal and more information about the model can be found here: https://www.usgs.gov/centers/spcmsc/science/scenario-based-assessments-used-coastal-change-hazard-forecasts.
Pre-and Post-Storm Photo Comparisons and Lidar Elevation Maps
Following landfall, oblique aerial photography and lidar surveys of beach elevations were used to document the changes that occurred as a result of the storm. In addition, field measurements of the beaches and dunes were collected immediately after the storm. Comparisons of data collected before the storm show the nature, magnitude and spatial variability of the coastal response. These data will be used to further refine predictive models for storm-induced erosion.
All of the pre- and post-storm photos for Hurricane Sandy are available in the Oblique Aerial Photography Viewer.
Field Observations and Measurements of Coastal Change - Fire Island, New York
As Hurricane Sandy moved up the eastern U.S. coast and the forecasts were predicting significant impacts to the south shore of Long Island, a field team went to Fire Island on the south shore of Long Island, New York, to survey the beach, dunes and shoreline. The pre-storm survey was conducted on October 28, 2012. Following the storm, surveys were conducted over several days (November 1 and 2, 2012) to measure beach and dune erosion.
The impacts to the island were extensive. The majority of oceanfront homes in the communities within Fire Island National Seashore were damaged or destroyed. Enormous volumes of sand were carried from the beach and dunes to the central portion of the island, forming large overwash deposits, and the island was breached in 3 locations. With few exceptions, lower-relief dunes were overwashed and flattened. High dunes, which are more commonly found within undeveloped portions of the island, experienced severe erosion and overwash. The elevation of the beach was lowered and the dunes form vertical scarps where they survived.
Some key findings of the field data collection effort indicate that:
-
50% of the dunes on Fire Island were overwashed during the storm, carrying large volumes of material to the interior portion of the island
-
In locations where the dunes remained intact, they eroded an average of 22 meters in cross-beach position
-
Dune elevation losses were as high as 5meters and the berm of the beach was lowered by as much as 3 meters
The USGS worked closely with personnel from the National Park Service (NPS) to gain access to the island, and to survey and measure the dramatic changes to the barrier system. The post-storm data was used to help the NPS assess the areas of the coast that were most vulnerable to a nor'easter that impacted the coast a week after Sandy.
Below are other science projects associated with this project.
Hurricane Sandy Response- Linking the Delmarva Peninsula's Geologic Framework to Coastal Vulnerability
Hurricane Sandy Response - Storm Impacts and Vulnerability of Coastal Beaches
Hurricane Sandy Response - Barrier Island and Estuarine Wetland Physical Change Assessment
Forecasting Coastal Change