
USGS scientists from the Woods Hole Coastal and Marine Science Center (WHCMSC) also installed pressure sensors at four sites along the coast of Cape Cod, Massachusetts, including Sandwich Marsh tidal creek in Sandwich, Head of the Meadow Beach in Truro, Marconi Beach in Wellfleet, and Nauset Light Beach in Eastham to measure storm surge and flooding during Hurricane
Monitoring the Storm: USGS Coastal Response to Hurricane Lee
By Woods Hole Coastal and Marine Science Center
October 3, 2023
In preparation for Hurricane Lee, scientists at the USGS deployed sensors and surveyed the U.S. Northeast coast to monitor the impacts of the storm. Monitoring hurricane impacts helps us better understand how coastal landscapes change in response to storms and allows us to validate models that forecast the dynamics of coastal storm impacts.
Media
Sources/Usage: Public Domain. View Media Details
Hurricane Lee made landfall on Saturday, September 16, 2023, in Nova Scotia, Canada and posed threats to communities along the Northeast coast. When a hurricane is predicted to make landfall in the U.S. or its territories, the USGS has a wide range of scientific tools and forecast models that can inform decision makers, emergency managers and communities to help them better prepare for, respond to and recover from the storm.
In advance of the storm, USGS scientists from the New England Water Science Center installed 15 internal logging pressure sensors at sites along Maine, New Hampshire and Massachusetts sandy coastlines as part of the National Oceanographic Partnership Program (NOPP). These sensors were attached to existing infrastructure, including pier pilings, beach walkways, power poles, and rock jetties, to measure storm surge and flooding caused by the hurricane. Several of the sites included cross-shore transects of 2-3 pressure sensors to measure the storm-induced waves and water levels over the course of the storm.
USGS scientists from the Woods Hole Coastal and Marine Science Center (WHCMSC) also installed pressure sensors at four sites along the coast of Cape Cod, Massachusetts, including Sandwich Marsh tidal creek in Sandwich, Head of the Meadow Beach in Truro, Marconi Beach in Wellfleet, and Nauset Light Beach in Eastham. To deploy the pressure sensors, 8-foot fence posts were hammered into the ground and the sensors were attached and marked with buoys and anchors. Once the storm passed the pressure sensors were recovered, and the fence posts were removed from the beach.
Media
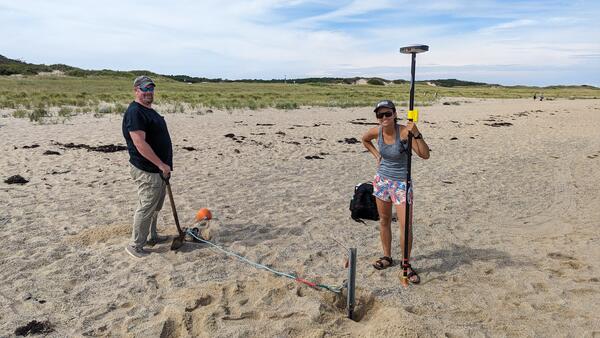
Eric Marsjanik and Jin-Si Over (USGS) installing pressure sensors attached to 8-foot fence posts marked with buoys and anchors to measure storm surge and flooding caused by Hurricane Lee.
Sources/Usage: Public Domain. View Media Details
Media
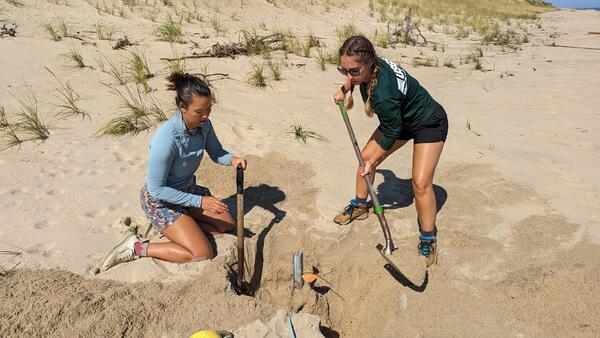
Mira Anderberg and Marie Bartlett (USGS) digging up a fence post that had a pressure sensor attached to measure storm surge and flooding during Hurricane Lee.
Sources/Usage: Public Domain. View Media Details
While pressure sensors were being deployed on land, more preparation to monitor the hurricane was happening in the air. As part of NOPP, the USGS, in coordination with researchers from Scripps Institution of Oceanography in La Jolla, California, boarded a U.S. Navy P3 Orion aircraft from the VXS-1 squadron based out of Naval Air Station Patuxent River in Maryland. They deployed 11 buoys into the Gulf of Maine, where they drifted and measured waves, temperature and physical ocean properties. The data are transmitted real time for comparison with forecasts by numerical models.
Additionally, USGS WHCMSC scientists, in collaboration with the Cape Cod National Seashore and the National Parks Service, conducted drone flights and GPS surveys to capture beach profile changes before and after the storm. These profiles and drone data allow scientists to visualize the movement of sediment along the beach.
Media

Dr. John Warner, USGS, and Dr. Martha Schonau, Scripps, before deploying 11 buoys from a U.S. Navy P3 Orion aircraft from the VXS-1 squadron based out of Naval Air Station Patuxent River in Maryland. These buoys measure waves, temperature, and physical ocean properties.
Sources/Usage: Public Domain. View Media Details
Media
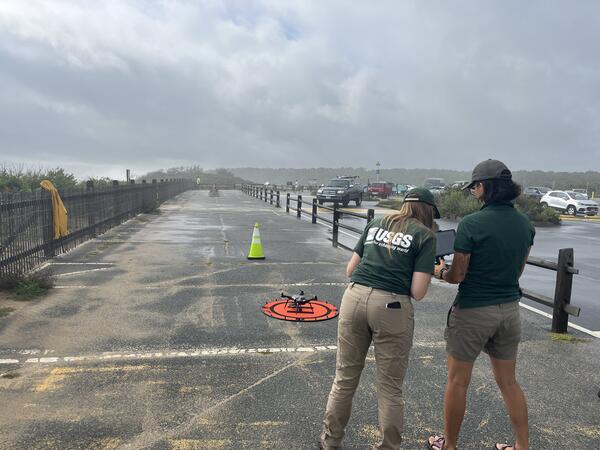
USGS scientists Jen Cramer and Jin-Si Over pilot a drone at Nauset Light Beach in Nauset, MA. Drone imagery will be used to monitor coastal change before and after Hurricane Lee. Photo by Mira Anderberg, USGS.
Sources/Usage: Public Domain. View Media Details
Data derived from the sensors and surveys will be helpful in tracking storm trends. The information can be used to assess how well dunes and wetlands can reduce storm damage, inform land use practices and help identify places of highest risk of coastal change. Data from this storm is also used to validate the models used to forecast coastal storm impacts.
The coupled ocean-atmosphere-waves-sediment transport (COAWST) modeling system was run daily to provide daily plots comparing model output with existing wave and water-level measurements. The daily plots showed the maximum expected wave heights and water levels due to storm surge in the Gulf of Maine and the New York Bight.
Data collected for Hurricane Lee will be available on the USGS Flood Event Viewer, as well as the Coastal Change Hazards Portal.
These data are used to assess the skill of the Total Water Level and Coastal Change Forecast Viewer, as well as to improve predictions for future storms.
Related

COAWST: A Coupled-Ocean-Atmosphere-Wave-Sediment Transport Modeling System
Understanding the processes responsible for coastal change is important for managing both our natural and economic coastal resources. Storms are one of the primary driving forces causing coastal change from a coupling of wave- and wind-driven flows. To better understand storm impacts and their effects on our coastlines, there is an international need to better predict storm paths and intensities...

Coastal Change Hazards
Natural processes such as waves, tides, and weather, continually change coastal landscapes. The integrity of coastal homes, businesses, and infrastructure can be threatened by hazards associated with event-driven changes, such as extreme storms and their impacts on beach and dune erosion, or longer-term, cumulative changes associated with coastal and marine processes, such as sea-level rise...
By
Natural Hazards Mission Area, Coastal and Marine Hazards and Resources Program, Pacific Coastal and Marine Science Center, St. Petersburg Coastal and Marine Science Center, Woods Hole Coastal and Marine Science Center, Supplemental Appropriations for Disaster Recovery Activities, Hurricanes, USGS Science in Long Island Sound and its Watershed
Providing Major Storm and Short-Term Flood Event Data
During major storms or other short-term events, the USGS collects streamflow and additional data to help document high-water events. This data is uploaded to the Short-Term Network (STN) for long-term archival and served out to the public through the Flood Event Viewer (FEV) which provides convenient, map-based access to downloadable event-based data.

Operational Total Water Level and Coastal Change Forecasts
The viewer shows predictions of the timing and magnitude of water levels at the shoreline and potential impacts to coastal dunes.

Hurricane Lee coastal response
USGS scientists from the Woods Hole Coastal and Marine Science Center (WHCMSC) also installed pressure sensors at four sites along the coast of Cape Cod, Massachusetts, including Sandwich Marsh tidal creek in Sandwich, Head of the Meadow Beach in Truro, Marconi Beach in Wellfleet, and Nauset Light Beach in Eastham to measure storm surge and flooding during Hurricane

Hurricane Lee sensor recovery
Mira Anderberg and Marie Bartlett (USGS) digging up a fence post that had a pressure sensor attached to measure storm surge and flooding during Hurricane Lee.
Mira Anderberg and Marie Bartlett (USGS) digging up a fence post that had a pressure sensor attached to measure storm surge and flooding during Hurricane Lee.

Hurricane Lee sensor retrieval
Marie Bartlett (USGS) removes fence post at Marconi Beach in Wellfleet, MA while recovering pressure sensor. Pressure sensors were attached to fence posts and hammered into the sand to measure total water levels of Hurricane Lee. Photo by Jin-Si Over, USGS.
Marie Bartlett (USGS) removes fence post at Marconi Beach in Wellfleet, MA while recovering pressure sensor. Pressure sensors were attached to fence posts and hammered into the sand to measure total water levels of Hurricane Lee. Photo by Jin-Si Over, USGS.

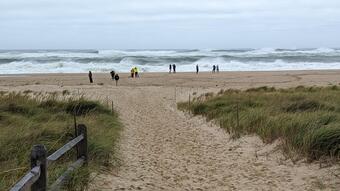
Hurricane Lee storm surge
Hurricane Lee storm surge at Head of the Meadow Beach in Truro, Massachusetts on September 16, 2023.
Hurricane Lee storm surge at Head of the Meadow Beach in Truro, Massachusetts on September 16, 2023.

Hurricane Lee buoy deployment
Dr. John Warner, USGS, and Dr. Martha Schonau, Scripps, before deploying 11 buoys from a U.S. Navy P3 Orion aircraft from the VXS-1 squadron based out of Naval Air Station Patuxent River in Maryland. These buoys measure waves, temperature, and physical ocean properties.
Dr. John Warner, USGS, and Dr. Martha Schonau, Scripps, before deploying 11 buoys from a U.S. Navy P3 Orion aircraft from the VXS-1 squadron based out of Naval Air Station Patuxent River in Maryland. These buoys measure waves, temperature, and physical ocean properties.

Hurricane Lee drone imagery
USGS scientists Jen Cramer and Jin-Si Over pilot a drone at Nauset Light Beach in Nauset, MA. Drone imagery will be used to monitor coastal change before and after Hurricane Lee. Photo by Mira Anderberg, USGS.
USGS scientists Jen Cramer and Jin-Si Over pilot a drone at Nauset Light Beach in Nauset, MA. Drone imagery will be used to monitor coastal change before and after Hurricane Lee. Photo by Mira Anderberg, USGS.

Hurricane Lee sensor installation
Eric Marsjanik and Jin-Si Over (USGS) installing pressure sensors attached to 8-foot fence posts marked with buoys and anchors to measure storm surge and flooding caused by Hurricane Lee.
Eric Marsjanik and Jin-Si Over (USGS) installing pressure sensors attached to 8-foot fence posts marked with buoys and anchors to measure storm surge and flooding caused by Hurricane Lee.

Hurricane Lee sensor deployment
Robert Bales (USGS) attaches a pressure sensor to post in the Sandwich Marsh tidal creek in Sandwich, MA to measure the water level during the storm. Photo by Chris Sherwood, USGS.
Robert Bales (USGS) attaches a pressure sensor to post in the Sandwich Marsh tidal creek in Sandwich, MA to measure the water level during the storm. Photo by Chris Sherwood, USGS.
Related
COAWST: A Coupled-Ocean-Atmosphere-Wave-Sediment Transport Modeling System
Understanding the processes responsible for coastal change is important for managing both our natural and economic coastal resources. Storms are one of the primary driving forces causing coastal change from a coupling of wave- and wind-driven flows. To better understand storm impacts and their effects on our coastlines, there is an international need to better predict storm paths and intensities...
Coastal Change Hazards
Natural processes such as waves, tides, and weather, continually change coastal landscapes. The integrity of coastal homes, businesses, and infrastructure can be threatened by hazards associated with event-driven changes, such as extreme storms and their impacts on beach and dune erosion, or longer-term, cumulative changes associated with coastal and marine processes, such as sea-level rise...
By
Natural Hazards Mission Area, Coastal and Marine Hazards and Resources Program, Pacific Coastal and Marine Science Center, St. Petersburg Coastal and Marine Science Center, Woods Hole Coastal and Marine Science Center, Supplemental Appropriations for Disaster Recovery Activities, Hurricanes, USGS Science in Long Island Sound and its Watershed
Providing Major Storm and Short-Term Flood Event Data
During major storms or other short-term events, the USGS collects streamflow and additional data to help document high-water events. This data is uploaded to the Short-Term Network (STN) for long-term archival and served out to the public through the Flood Event Viewer (FEV) which provides convenient, map-based access to downloadable event-based data.
Operational Total Water Level and Coastal Change Forecasts
The viewer shows predictions of the timing and magnitude of water levels at the shoreline and potential impacts to coastal dunes.
Hurricane Lee coastal response
USGS scientists from the Woods Hole Coastal and Marine Science Center (WHCMSC) also installed pressure sensors at four sites along the coast of Cape Cod, Massachusetts, including Sandwich Marsh tidal creek in Sandwich, Head of the Meadow Beach in Truro, Marconi Beach in Wellfleet, and Nauset Light Beach in Eastham to measure storm surge and flooding during Hurricane
USGS scientists from the Woods Hole Coastal and Marine Science Center (WHCMSC) also installed pressure sensors at four sites along the coast of Cape Cod, Massachusetts, including Sandwich Marsh tidal creek in Sandwich, Head of the Meadow Beach in Truro, Marconi Beach in Wellfleet, and Nauset Light Beach in Eastham to measure storm surge and flooding during Hurricane
Hurricane Lee sensor recovery
Mira Anderberg and Marie Bartlett (USGS) digging up a fence post that had a pressure sensor attached to measure storm surge and flooding during Hurricane Lee.
Mira Anderberg and Marie Bartlett (USGS) digging up a fence post that had a pressure sensor attached to measure storm surge and flooding during Hurricane Lee.
Hurricane Lee sensor retrieval
Marie Bartlett (USGS) removes fence post at Marconi Beach in Wellfleet, MA while recovering pressure sensor. Pressure sensors were attached to fence posts and hammered into the sand to measure total water levels of Hurricane Lee. Photo by Jin-Si Over, USGS.
Marie Bartlett (USGS) removes fence post at Marconi Beach in Wellfleet, MA while recovering pressure sensor. Pressure sensors were attached to fence posts and hammered into the sand to measure total water levels of Hurricane Lee. Photo by Jin-Si Over, USGS.
Hurricane Lee storm surge
Hurricane Lee storm surge at Head of the Meadow Beach in Truro, Massachusetts on September 16, 2023.
Hurricane Lee storm surge at Head of the Meadow Beach in Truro, Massachusetts on September 16, 2023.
Hurricane Lee buoy deployment
Dr. John Warner, USGS, and Dr. Martha Schonau, Scripps, before deploying 11 buoys from a U.S. Navy P3 Orion aircraft from the VXS-1 squadron based out of Naval Air Station Patuxent River in Maryland. These buoys measure waves, temperature, and physical ocean properties.
Dr. John Warner, USGS, and Dr. Martha Schonau, Scripps, before deploying 11 buoys from a U.S. Navy P3 Orion aircraft from the VXS-1 squadron based out of Naval Air Station Patuxent River in Maryland. These buoys measure waves, temperature, and physical ocean properties.
Hurricane Lee drone imagery
USGS scientists Jen Cramer and Jin-Si Over pilot a drone at Nauset Light Beach in Nauset, MA. Drone imagery will be used to monitor coastal change before and after Hurricane Lee. Photo by Mira Anderberg, USGS.
USGS scientists Jen Cramer and Jin-Si Over pilot a drone at Nauset Light Beach in Nauset, MA. Drone imagery will be used to monitor coastal change before and after Hurricane Lee. Photo by Mira Anderberg, USGS.
Hurricane Lee sensor installation
Eric Marsjanik and Jin-Si Over (USGS) installing pressure sensors attached to 8-foot fence posts marked with buoys and anchors to measure storm surge and flooding caused by Hurricane Lee.
Eric Marsjanik and Jin-Si Over (USGS) installing pressure sensors attached to 8-foot fence posts marked with buoys and anchors to measure storm surge and flooding caused by Hurricane Lee.
Hurricane Lee sensor deployment
Robert Bales (USGS) attaches a pressure sensor to post in the Sandwich Marsh tidal creek in Sandwich, MA to measure the water level during the storm. Photo by Chris Sherwood, USGS.
Robert Bales (USGS) attaches a pressure sensor to post in the Sandwich Marsh tidal creek in Sandwich, MA to measure the water level during the storm. Photo by Chris Sherwood, USGS.