
Isolated silicon carbide specimen from the USGS mineral collection. High-definition image showing crystalline texture and dark coloration.
Images
Images
Filter Total Items: 9454
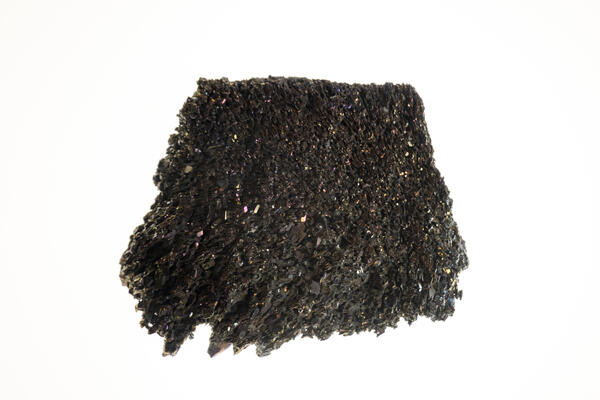
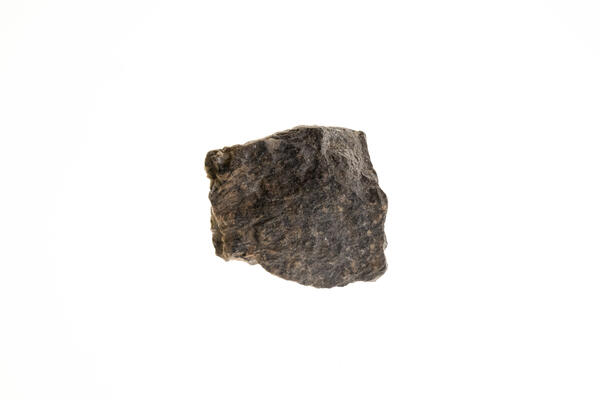
Silicon Carbide Sample
Isolated silicon carbide specimen from the USGS mineral collection. High-definition image showing crystalline texture and dark coloration.
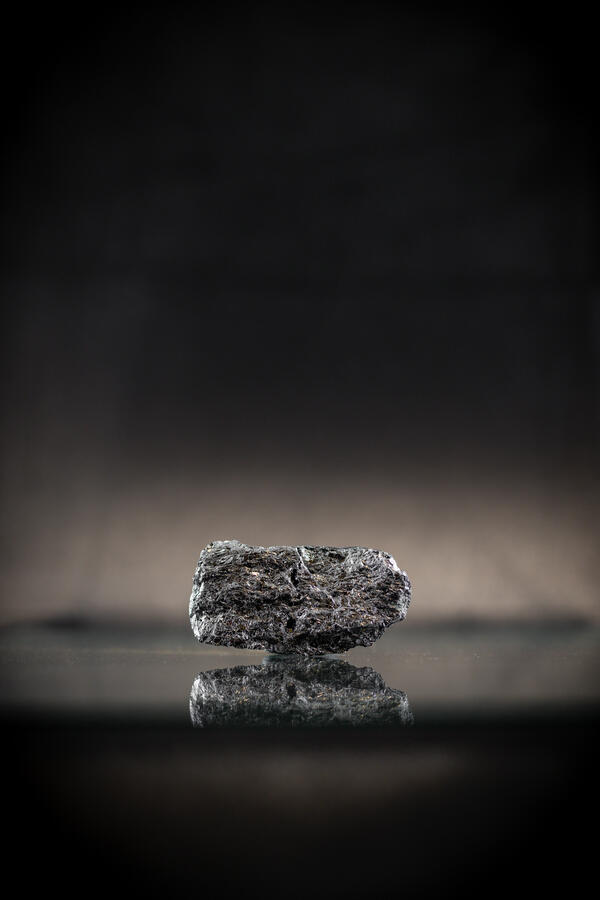
Silicon Metal Sample
High-definition image of silicon metal specimen with shiny surface and granular structure.
High-definition image of silicon metal specimen with shiny surface and granular structure.

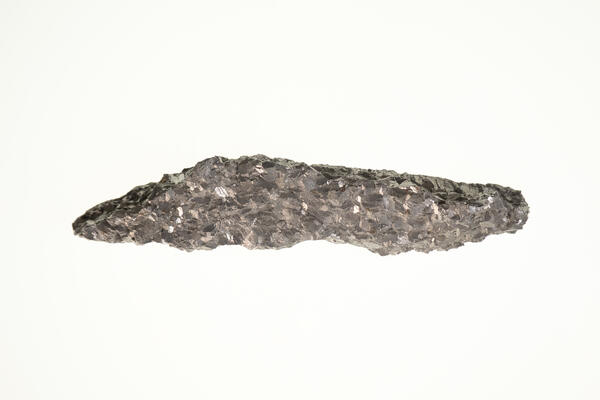
Silver Ore Sample
SGS mineral specimen of silver ore. High-definition image showing metallic luster and rough texture.
SGS mineral specimen of silver ore. High-definition image showing metallic luster and rough texture.
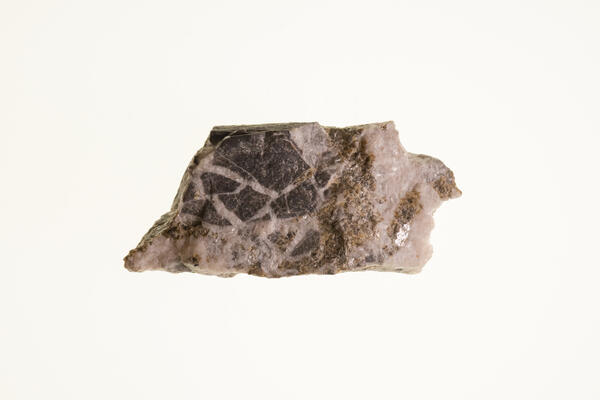
Silver Tetrahedrite
Isolated tetrahedrite specimen with silver content. High-definition image showing granular texture and dark coloration.
Isolated tetrahedrite specimen with silver content. High-definition image showing granular texture and dark coloration.
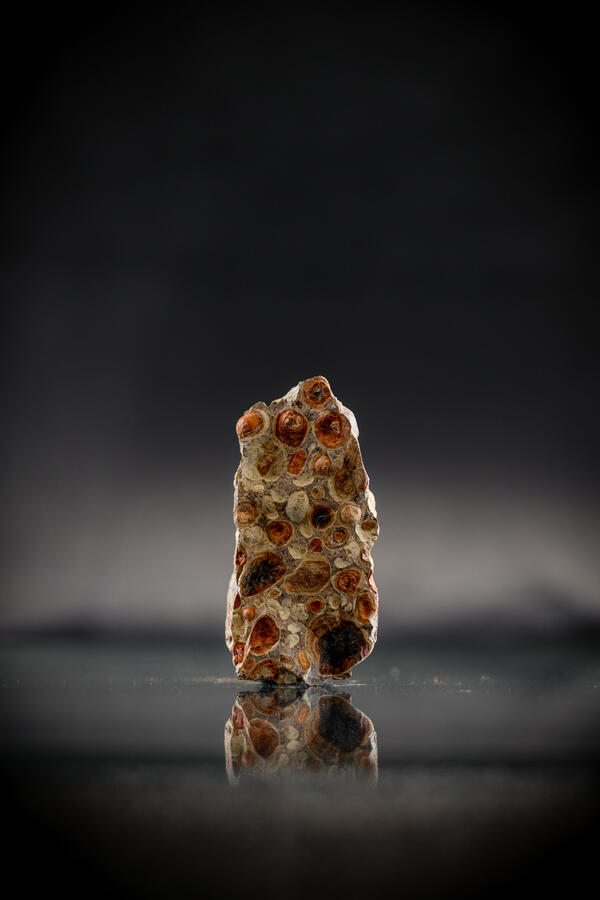
Sphalerite Specimen 5
High-definition image of sphalerite specimen with visible crystal faces and reddish-brown hue.
High-definition image of sphalerite specimen with visible crystal faces and reddish-brown hue.

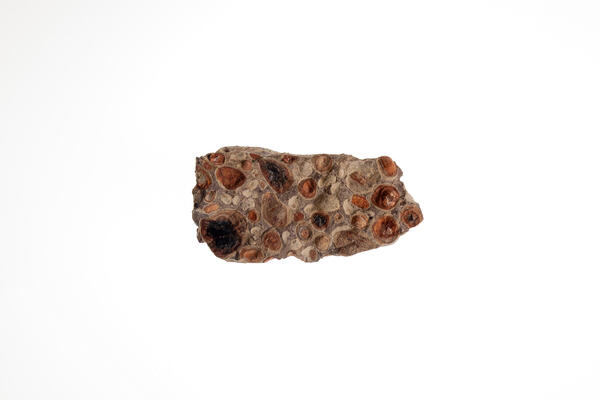
Sphalerite with Serpentine 1
Isolated specimen of sphalerite with serpentine. High-definition image showing contrasting textures and colors.
Isolated specimen of sphalerite with serpentine. High-definition image showing contrasting textures and colors.
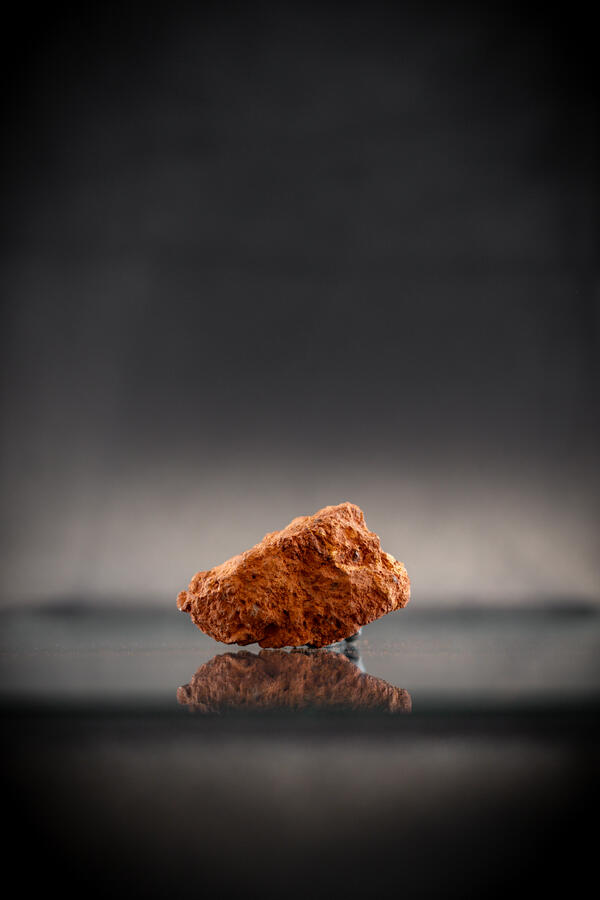
Bauxite Sample
Isolated bauxite specimen from the USGS mineral collection. High-definition image showing earthy texture and reddish-brown color.
Isolated bauxite specimen from the USGS mineral collection. High-definition image showing earthy texture and reddish-brown color.
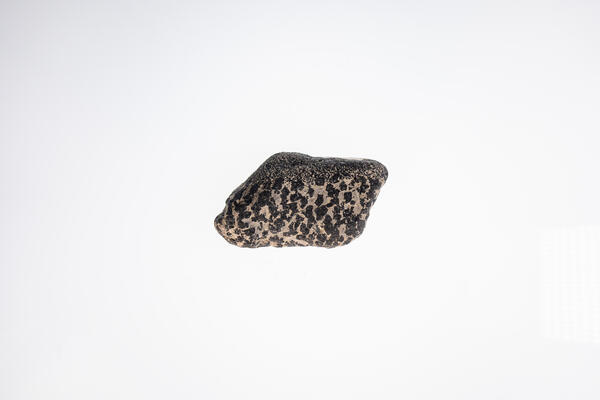
Bauxite Sample 2
Isolated USGS mineral specimen of vesicular basalt. High-definition image showing porous side texture and dark volcanic color.
Isolated USGS mineral specimen of vesicular basalt. High-definition image showing porous side texture and dark volcanic color.
Bauxite Aluminum Ore
Bauxite ore specimen from the USGS mineral collection. High-definition image showing earthy structure and aluminum content.
Bauxite ore specimen from the USGS mineral collection. High-definition image showing earthy structure and aluminum content.

Blister Copper Sample
Isolated blister copper specimen from the USGS mineral collection. High-definition image showing rough surface and oxidized color.
Isolated blister copper specimen from the USGS mineral collection. High-definition image showing rough surface and oxidized color.
Chromium Chromite Sample 3
High-definition image of chromite specimen with visible crystal grains and dark coloration.
High-definition image of chromite specimen with visible crystal grains and dark coloration.
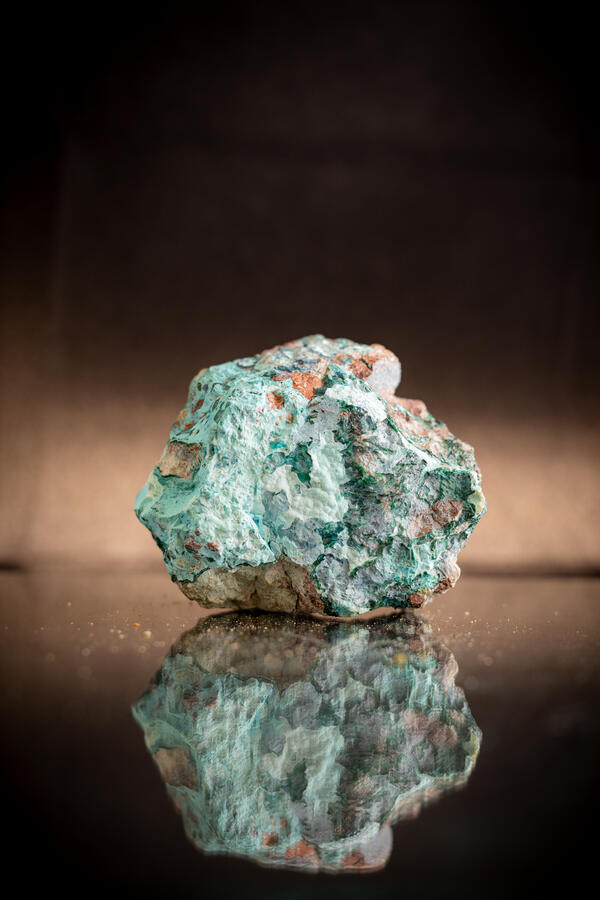
Chrysocolla Specimen
Isolated USGS mineral specimen of low-carbon ferrochromium. High-definition image showing smooth metallic surface.
Isolated USGS mineral specimen of low-carbon ferrochromium. High-definition image showing smooth metallic surface.
Columbite-Tantalite Sample 1
Isolated high-resolution image of columbite-tantalite ore, a mineral specimen from the USGS collection, highlighting its granular texture and crystal structure.
Isolated high-resolution image of columbite-tantalite ore, a mineral specimen from the USGS collection, highlighting its granular texture and crystal structure.
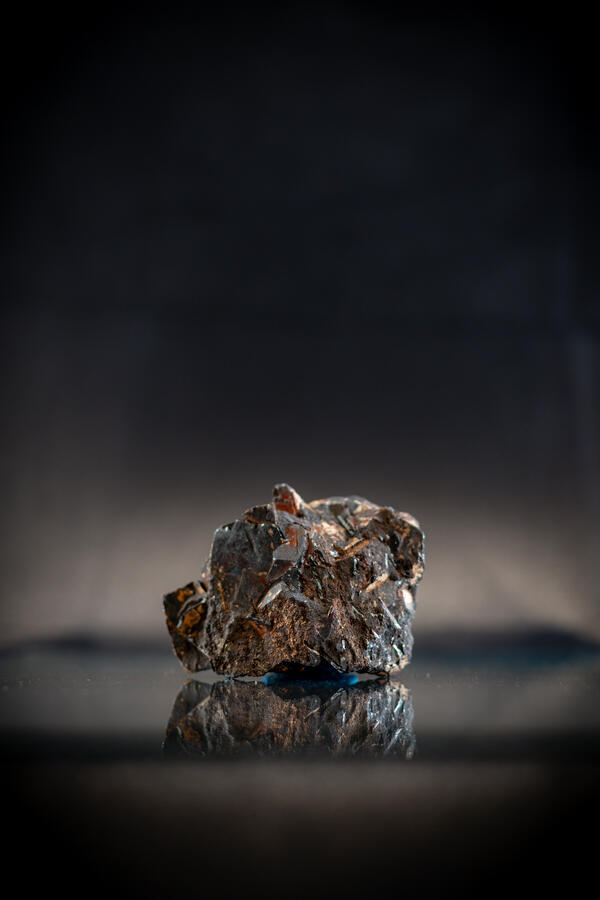
Covellite and Pyrite 2
Isolated mineral specimen featuring covellite and pyrite, captured in high resolution to emphasize the contrast between blue and gold metallic textures.
Isolated mineral specimen featuring covellite and pyrite, captured in high resolution to emphasize the contrast between blue and gold metallic textures.
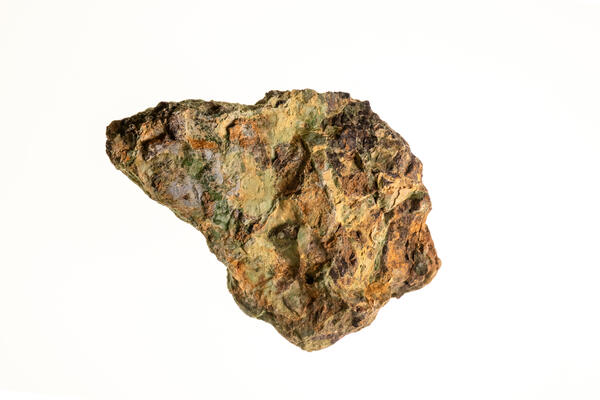
Garnierite Specimen 3
High-definition image of garnierite specimen with layered texture and pale green color.
High-definition image of garnierite specimen with layered texture and pale green color.
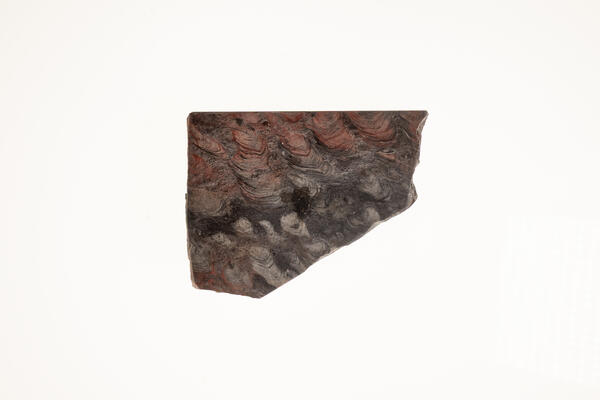
Stromatolites with Algal Structure
USGS mineral specimen of stromatolites showing preserved algal structures. High-definition image highlighting layered texture and fossil patterns.
USGS mineral specimen of stromatolites showing preserved algal structures. High-definition image highlighting layered texture and fossil patterns.
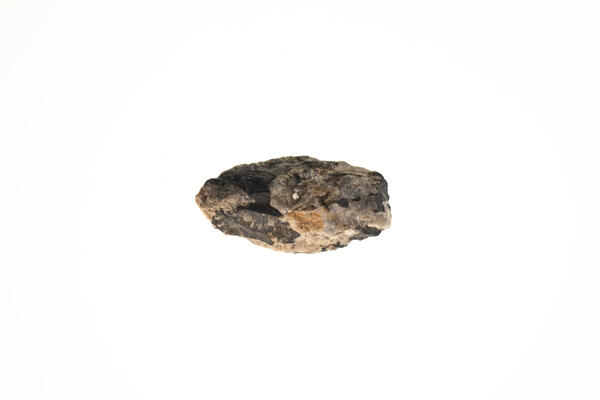
Argentiferous Tetrahedrite 3
USGS mineral specimen of argentiferous tetrahedrite. High-definition image showing granular structure and metallic sheen.
USGS mineral specimen of argentiferous tetrahedrite. High-definition image showing granular structure and metallic sheen.
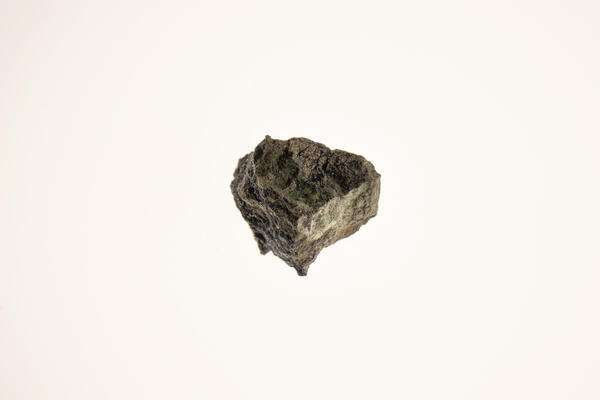
Wolframite (Tungsten Ore) 3
High-definition image of wolframite specimen with fine-grained texture and dark luster.
High-definition image of wolframite specimen with fine-grained texture and dark luster.
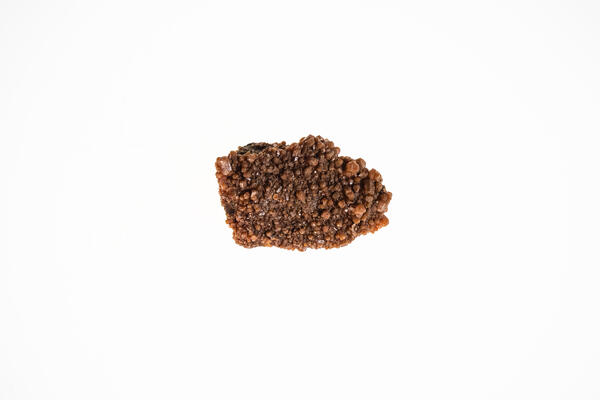
Vanadinite Specimen 2
High-definition image of vanadinite specimen with prismatic structure and vibrant coloration.
High-definition image of vanadinite specimen with prismatic structure and vibrant coloration.
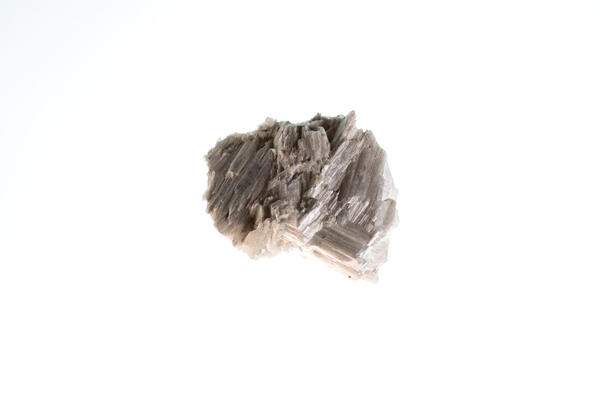
Wollastonite Specimen
Isolated wollastonite specimen from the USGS mineral collection. High-definition image showing fibrous texture and pale coloration.
Isolated wollastonite specimen from the USGS mineral collection. High-definition image showing fibrous texture and pale coloration.
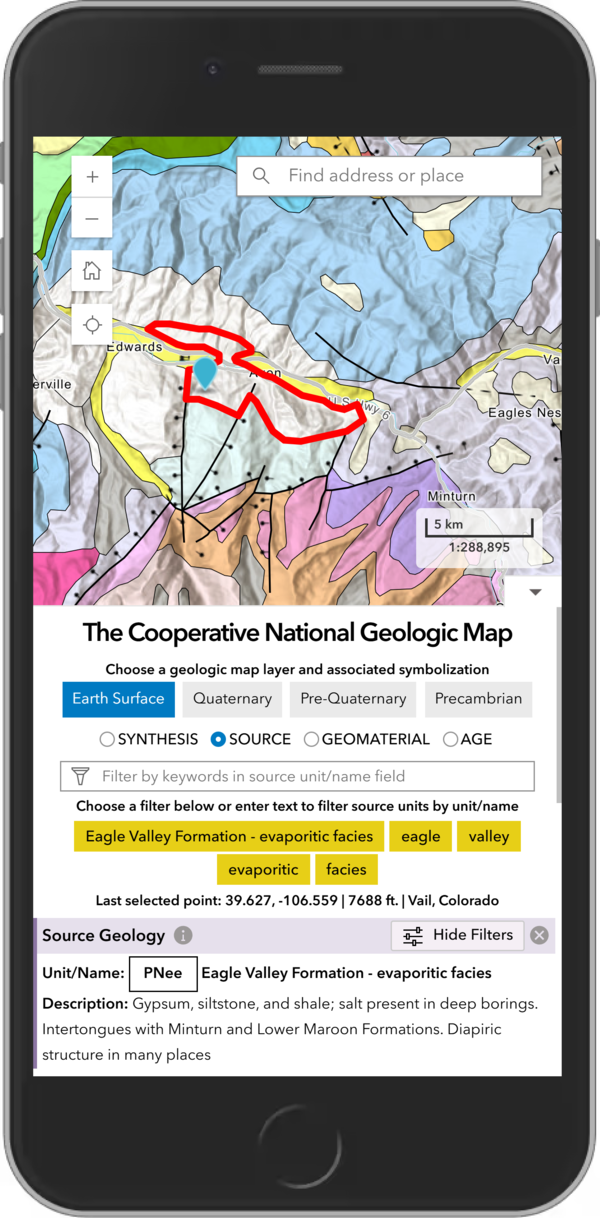
The USGS Cooperative National Geologic Map on smartphone
The USGS Cooperative National Geologic Map on smartphoneThe new USGS Cooperative National Geologic Map web tool was designed to also be mobile friendly, allowing users to explore geologic data from smartphones and tablets, in addition to larger devices. USGS image.