USGS installs wave sensors in Florida before Hurricane Milton makes landfall
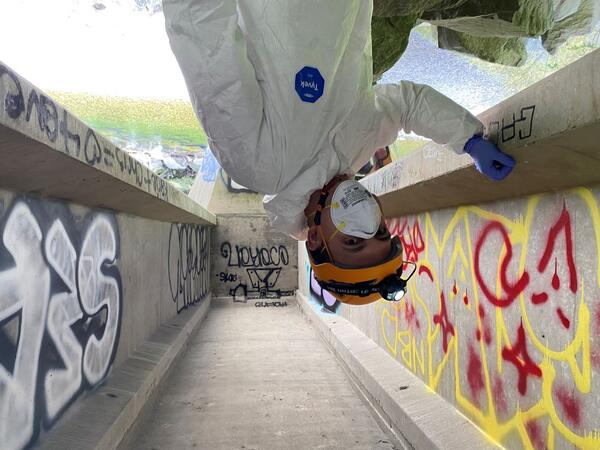
USGS installs wave sensors in Florida before Hurricane Milton makes landfallJulie Hobbs, a USGS hydrologic technician, installs a wave sensor near Venice, Fla., Monday, October 7, 2024, ahead of Hurricane Milton’s projected landfall in Florida’s Gulf Coast Wednesday. USGS photo by Sean Townsend.