
USGS water data expert Garret Welsh measures water flow in the pouring rain at the Straight River near Faribault, Minnesota. This measurement recorded the 6th highest flow in the station's 59-year history, highlighting the severity of current flood conditions. Such data is crucial for emergency managers and forecasters to protect communities at risk.
Where can I find flood maps?
FEMA is the official public source for flood maps for insurance purposes:
- FEMA’s Flood Map Service Center
- FEMA’s National Flood Hazard Layer
NOAA is responsible for producing flood forecast maps that combine precipitation data with USGS streamflow data:
- NWS - National Water Prediction Service: River forecasts and long range flood outlook
- Coastal Inundation Dashboard: Real-time and historical coastal flooding information
USGS flood map products include:
- USGS Flood Information: Maps and resources for current and historical floods.
- Flood Inundation Mapper: Shows where river flooding might occur over a range of water levels. Only available for a few areas.
- Flood Event Viewer: Data collected during short-term flood events like hurricanes and multi-state storms. Includes rapid-deployment gages, temporary sensors, and high-water marks.
- Coastal Change Hazards Portal: Extreme storms, shoreline change, and sea-level rise.
Related

How are floods predicted? How are floods predicted?
Flood predictions require several types of data: The amount of rainfall occurring on a real-time basis. The rate of change in river stage on a real-time basis, which can help indicate the severity and immediacy of the threat. Knowledge about the type of storm producing the moisture, such as duration, intensity and areal extent, which can be valuable for determining possible severity of the...

What are the two types of floods? What are the two types of floods?
There are two basic types of floods: flash floods and the more widespread river floods. Flash floods generally cause greater loss of life and river floods generally cause greater loss of property. A flash flood occurs when runoff from excessive rainfall causes a rapid rise in the water height (stage) of a stream or normally-dry channel. Flash floods are more common in areas with a dry climate and...

Does an increase in the 100-year flood estimate originate from climate or land-use change? Does an increase in the 100-year flood estimate originate from climate or land-use change?
Climate variability (dry cycles to wet cycles) and land-use change play a significant role, but there is a large amount of uncertainty around the flood quantile estimates (the value of discharge corresponding to the 100-year flood), particularly if there isn’t a long record of observed data at a stream location. Learn more: The 100-Year Flood The 100-Year Flood--It's All About Chance

What is a 1,000-year flood? What is a 1,000-year flood?
The term “1,000-year flood” means that, statistically speaking, a flood of that magnitude (or greater) has a 1 in 1,000 chance of occurring in any given year. In terms of probability, the 1,000-year flood has a 0.1% chance of happening in any given year. These statistical values are based on observed data.
We had a "100-year flood" two years in a row. How can that be? We had a "100-year flood" two years in a row. How can that be?
The term "100-year flood" is used to describe the recurrence interval of floods. The 100-year recurrence interval means that a flood of that magnitude has a one percent chance of occurring in any given year. In other words, the chances that a river will flow as high as the 100-year flood stage this year is 1 in 100. Statistically, each year begins with the same 1-percent chance that a 100-year...

USGS Flood Monitoring: Eastern Minnesota
USGS water data expert Garret Welsh measures water flow in the pouring rain at the Straight River near Faribault, Minnesota. This measurement recorded the 6th highest flow in the station's 59-year history, highlighting the severity of current flood conditions. Such data is crucial for emergency managers and forecasters to protect communities at risk.

Flooding on Kennebec River at Calumet Bridge in Augusta, Maine
Flooding on Kennebec River at Calumet Bridge in Augusta, MaineThis USGS webcam footage shows the Kennebec River in Augusta, Maine, flooding after a large coastal storm hit much of the East Coast and battered New England with heavy rains and winds. USGS image.

Aerial image of Lower Nooksack River flooding its banks in 2009
Aerial image of Lower Nooksack River flooding its banks in 2009Aerial image of Lower Nooksack River flooding its banks in 2009, from the study Compound flood model for the lower Nooksack River and delta, western Washington—Assessment of vulnerability and nature-based adaptation oppor

Floodwater damage from Extratropical Typhoon Merbok in Nome, Alaska
Floodwater damage from Extratropical Typhoon Merbok in Nome, AlaskaA building lifted from its foundation by floodwater from Extratropical Typhoon Merbok is trapped under a bridge in Nome, Alaska.
Floodwater damage from Extratropical Typhoon Merbok in Nome, Alaska
Floodwater damage from Extratropical Typhoon Merbok in Nome, AlaskaA building lifted from its foundation by floodwater from Extratropical Typhoon Merbok is trapped under a bridge in Nome, Alaska.
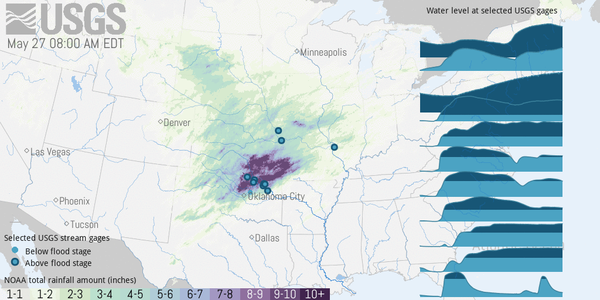
Spring 2019 Midwest flooding data visualization
This DataVisualization shows the severity of flooding in the Midwest . As of June 1, 2019, 17 USGS streamgage sites in red had the highest streamflow for the entire period of record available. Both the Mississippi and the Arkansas rivers are seeing record breaking flows.
This DataVisualization shows the severity of flooding in the Midwest . As of June 1, 2019, 17 USGS streamgage sites in red had the highest streamflow for the entire period of record available. Both the Mississippi and the Arkansas rivers are seeing record breaking flows.

Understanding Floods | Long-term Streamflow Data Collection
Understanding Floods | Long-term Streamflow Data CollectionThe USGS is developing methods to improve data collection during floods to gain new insight into the rise and fall of flood waters. In the past, the only data left behind after a flood was how high the water got, or the peak of the flood.
Related
How are floods predicted? How are floods predicted?
Flood predictions require several types of data: The amount of rainfall occurring on a real-time basis. The rate of change in river stage on a real-time basis, which can help indicate the severity and immediacy of the threat. Knowledge about the type of storm producing the moisture, such as duration, intensity and areal extent, which can be valuable for determining possible severity of the...
What are the two types of floods? What are the two types of floods?
There are two basic types of floods: flash floods and the more widespread river floods. Flash floods generally cause greater loss of life and river floods generally cause greater loss of property. A flash flood occurs when runoff from excessive rainfall causes a rapid rise in the water height (stage) of a stream or normally-dry channel. Flash floods are more common in areas with a dry climate and...
Does an increase in the 100-year flood estimate originate from climate or land-use change? Does an increase in the 100-year flood estimate originate from climate or land-use change?
Climate variability (dry cycles to wet cycles) and land-use change play a significant role, but there is a large amount of uncertainty around the flood quantile estimates (the value of discharge corresponding to the 100-year flood), particularly if there isn’t a long record of observed data at a stream location. Learn more: The 100-Year Flood The 100-Year Flood--It's All About Chance
What is a 1,000-year flood? What is a 1,000-year flood?
The term “1,000-year flood” means that, statistically speaking, a flood of that magnitude (or greater) has a 1 in 1,000 chance of occurring in any given year. In terms of probability, the 1,000-year flood has a 0.1% chance of happening in any given year. These statistical values are based on observed data.
We had a "100-year flood" two years in a row. How can that be? We had a "100-year flood" two years in a row. How can that be?
The term "100-year flood" is used to describe the recurrence interval of floods. The 100-year recurrence interval means that a flood of that magnitude has a one percent chance of occurring in any given year. In other words, the chances that a river will flow as high as the 100-year flood stage this year is 1 in 100. Statistically, each year begins with the same 1-percent chance that a 100-year...
USGS Flood Monitoring: Eastern Minnesota
USGS water data expert Garret Welsh measures water flow in the pouring rain at the Straight River near Faribault, Minnesota. This measurement recorded the 6th highest flow in the station's 59-year history, highlighting the severity of current flood conditions. Such data is crucial for emergency managers and forecasters to protect communities at risk.
USGS water data expert Garret Welsh measures water flow in the pouring rain at the Straight River near Faribault, Minnesota. This measurement recorded the 6th highest flow in the station's 59-year history, highlighting the severity of current flood conditions. Such data is crucial for emergency managers and forecasters to protect communities at risk.
Flooding on Kennebec River at Calumet Bridge in Augusta, Maine
Flooding on Kennebec River at Calumet Bridge in Augusta, MaineThis USGS webcam footage shows the Kennebec River in Augusta, Maine, flooding after a large coastal storm hit much of the East Coast and battered New England with heavy rains and winds. USGS image.
Aerial image of Lower Nooksack River flooding its banks in 2009
Aerial image of Lower Nooksack River flooding its banks in 2009Aerial image of Lower Nooksack River flooding its banks in 2009, from the study Compound flood model for the lower Nooksack River and delta, western Washington—Assessment of vulnerability and nature-based adaptation oppor
Floodwater damage from Extratropical Typhoon Merbok in Nome, Alaska
Floodwater damage from Extratropical Typhoon Merbok in Nome, AlaskaA building lifted from its foundation by floodwater from Extratropical Typhoon Merbok is trapped under a bridge in Nome, Alaska.
Floodwater damage from Extratropical Typhoon Merbok in Nome, Alaska
Floodwater damage from Extratropical Typhoon Merbok in Nome, AlaskaA building lifted from its foundation by floodwater from Extratropical Typhoon Merbok is trapped under a bridge in Nome, Alaska.
Spring 2019 Midwest flooding data visualization
This DataVisualization shows the severity of flooding in the Midwest . As of June 1, 2019, 17 USGS streamgage sites in red had the highest streamflow for the entire period of record available. Both the Mississippi and the Arkansas rivers are seeing record breaking flows.
This DataVisualization shows the severity of flooding in the Midwest . As of June 1, 2019, 17 USGS streamgage sites in red had the highest streamflow for the entire period of record available. Both the Mississippi and the Arkansas rivers are seeing record breaking flows.
Understanding Floods | Long-term Streamflow Data Collection
Understanding Floods | Long-term Streamflow Data CollectionThe USGS is developing methods to improve data collection during floods to gain new insight into the rise and fall of flood waters. In the past, the only data left behind after a flood was how high the water got, or the peak of the flood.
Updated Date: July 1, 2026