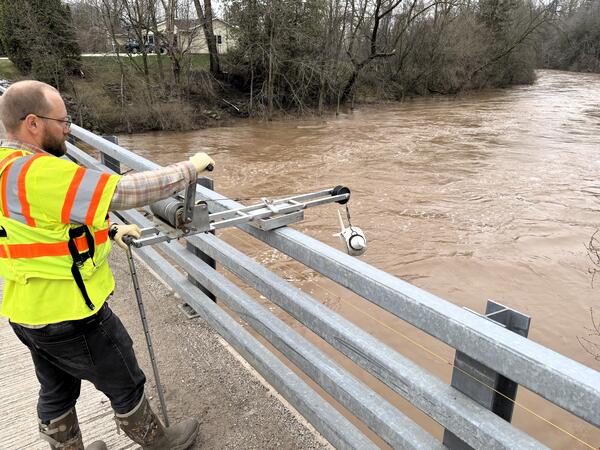
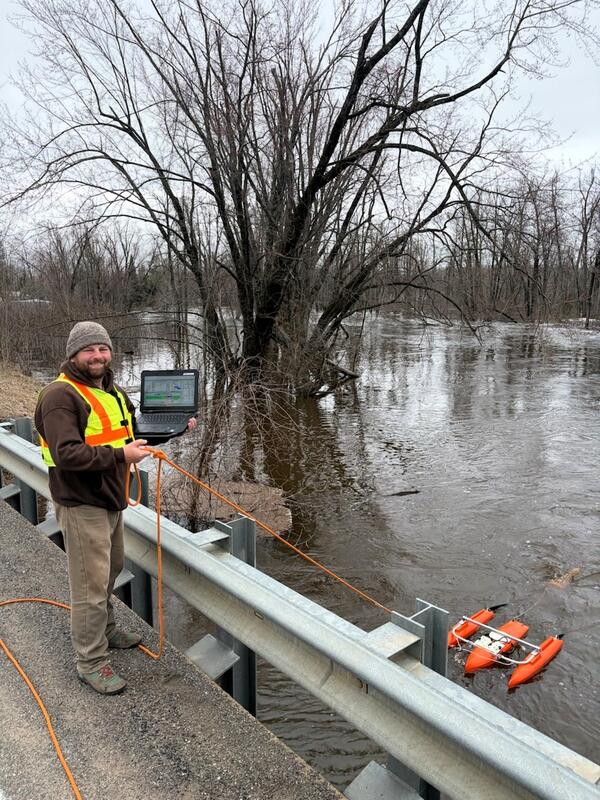
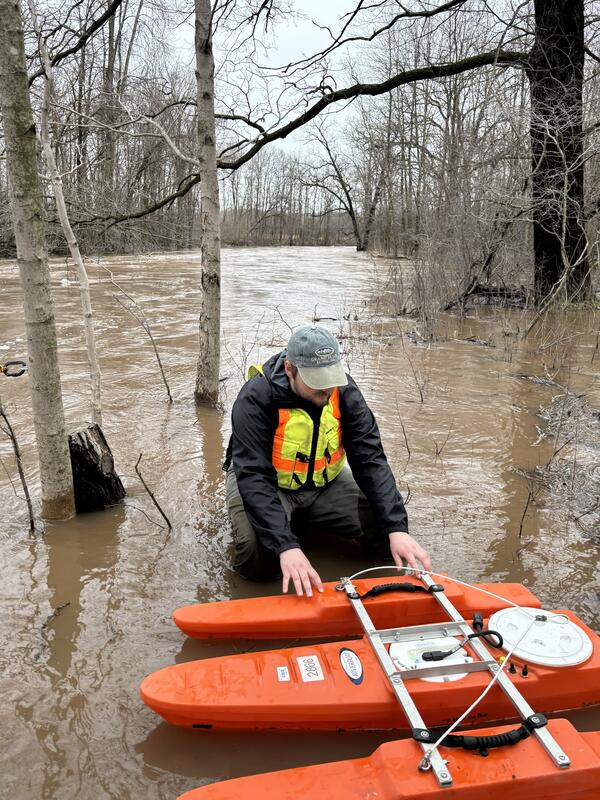
Climate variability (dry cycles to wet cycles) and land-use change play a significant role, but there is a large amount of uncertainty around the flood quantile estimates (the value of discharge corresponding to the 100-year flood), particularly if there isn’t a long record of observed data at a stream location.
Learn more:
Related Content
How are floods predicted?
Flood predictions require several types of data: The amount of rainfall occurring on a real-time basis. The rate of change in river stage on a real-time basis, which can help indicate the severity and immediacy of the threat. Knowledge about the type of storm producing the moisture, such as duration, intensity and areal extent, which can be valuable for determining possible severity of the...
How can a 1,000-year rainfall not result in a 1,000-year flood?
It comes down to a number of factors, including the pattern of movement of the rainstorm in each particular watershed, the conditions of the soil and plant matter in the watershed, and the timing of the rainstorm in one watershed versus other watersheds. For example, if the ground is already saturated before a rainstorm, much of the rain will run off into streams, but if the ground is dry, it will...
We had a "100-year flood" two years in a row. How can that be?
The term "100-year flood" is used to describe the recurrence interval of floods. The 100-year recurrence interval means that a flood of that magnitude has a one percent chance of occurring in any given year. In other words, the chances that a river will flow as high as the 100-year flood stage this year is 1 in 100. Statistically, each year begins with the same 1-percent chance that a 100-year...
Why do the values for the 100-year flood seem to change with every flood?
The amount of water corresponding to a 100-year flood, a 500-year flood, or a 1,000-year flood is known as a "flood quantile". For instance, on a given river, the flood quantile corresponding to the 50-year flood might be 10,000 cubic feet per second (cfs) and the flood quantile corresponding to the 100-year flood might be 15,000 cfs. The estimates of the flood quantiles are calculated using...
Where can I find flood maps?
FEMA is the official public source for flood maps for insurance purposes: FEMA’s Flood Map Service Center FEMA’s National Flood Hazard Layer NOAA is responsible for producing flood forecast maps that combine precipitation data with USGS streamflow data: National Weather Service - Advanced Hydrologic Prediction Service River Forecasts Long-Range River Flood Risk Coastal Inundation Dashboard: Real...
What is a 1,000-year flood?
The term “1,000-year flood” means that, statistically speaking, a flood of that magnitude (or greater) has a 1 in 1,000 chance of occurring in any given year. In terms of probability, the 1,000-year flood has a 0.1% chance of happening in any given year. These statistical values are based on observed data.
What are the two types of floods?
There are two basic types of floods: flash floods and the more widespread river floods. Flash floods generally cause greater loss of life and river floods generally cause greater loss of property. A flash flood occurs when runoff from excessive rainfall causes a rapid rise in the water height (stage) of a stream or normally-dry channel. Flash floods are more common in areas with a dry climate and...
How USGS gages are used in flood forecasting
Guidelines for determining flood flow frequency — Bulletin 17C
Development of flood regressions and climate change scenarios to explore estimates of future peak flows
Popular myths about flooding in Western Washington
Climate change, atmospheric rivers, and floods in California - a multimodel analysis of storm frequency and magnitude changes
100-Year flood–it's all about chance
The world's largest floods, past and present: Their causes and magnitudes
Large floods in the United States: where they happen and why
Related Content
- FAQ
How are floods predicted?
Flood predictions require several types of data: The amount of rainfall occurring on a real-time basis. The rate of change in river stage on a real-time basis, which can help indicate the severity and immediacy of the threat. Knowledge about the type of storm producing the moisture, such as duration, intensity and areal extent, which can be valuable for determining possible severity of the...
How can a 1,000-year rainfall not result in a 1,000-year flood?
It comes down to a number of factors, including the pattern of movement of the rainstorm in each particular watershed, the conditions of the soil and plant matter in the watershed, and the timing of the rainstorm in one watershed versus other watersheds. For example, if the ground is already saturated before a rainstorm, much of the rain will run off into streams, but if the ground is dry, it will...
We had a "100-year flood" two years in a row. How can that be?
The term "100-year flood" is used to describe the recurrence interval of floods. The 100-year recurrence interval means that a flood of that magnitude has a one percent chance of occurring in any given year. In other words, the chances that a river will flow as high as the 100-year flood stage this year is 1 in 100. Statistically, each year begins with the same 1-percent chance that a 100-year...
Why do the values for the 100-year flood seem to change with every flood?
The amount of water corresponding to a 100-year flood, a 500-year flood, or a 1,000-year flood is known as a "flood quantile". For instance, on a given river, the flood quantile corresponding to the 50-year flood might be 10,000 cubic feet per second (cfs) and the flood quantile corresponding to the 100-year flood might be 15,000 cfs. The estimates of the flood quantiles are calculated using...
Where can I find flood maps?
FEMA is the official public source for flood maps for insurance purposes: FEMA’s Flood Map Service Center FEMA’s National Flood Hazard Layer NOAA is responsible for producing flood forecast maps that combine precipitation data with USGS streamflow data: National Weather Service - Advanced Hydrologic Prediction Service River Forecasts Long-Range River Flood Risk Coastal Inundation Dashboard: Real...
What is a 1,000-year flood?
The term “1,000-year flood” means that, statistically speaking, a flood of that magnitude (or greater) has a 1 in 1,000 chance of occurring in any given year. In terms of probability, the 1,000-year flood has a 0.1% chance of happening in any given year. These statistical values are based on observed data.
What are the two types of floods?
There are two basic types of floods: flash floods and the more widespread river floods. Flash floods generally cause greater loss of life and river floods generally cause greater loss of property. A flash flood occurs when runoff from excessive rainfall causes a rapid rise in the water height (stage) of a stream or normally-dry channel. Flash floods are more common in areas with a dry climate and...
- Multimedia
- Publications
How USGS gages are used in flood forecasting
The U.S. Geological Survey (USGS) operates an extensive nationwide network of stream, rain, and groundwater gages. These instruments are used to monitor how much water there is across the Nation at any given moment. Stream data are collected at streamgages every 15 minutes, transmitted to USGS servers, and updated online in real time. To improve awareness of current water conditions and possible fGuidelines for determining flood flow frequency — Bulletin 17C
Accurate estimates of flood frequency and magnitude are a key component of any effective nationwide flood risk management and flood damage abatement program. In addition to accuracy, methods for estimating flood risk must be uniformly and consistently applied because management of the Nation’s water and related land resources is a collaborative effort involving multiple actors including most levelDevelopment of flood regressions and climate change scenarios to explore estimates of future peak flows
A new Web-based application, titled “Application of Flood Regressions and Climate Change Scenarios To Explore Estimates of Future Peak Flows”, has been developed by the U.S. Geological Survey, in cooperation with the New York State Department of Transportation, that allows a user to apply a set of regression equations to estimate the magnitude of future floods for any stream or river in New York SPopular myths about flooding in Western Washington
Floods are the most destructive natural hazard in the Nation, causing more deaths and financial loss in the 20th century than any other natural disaster. The most significant 20 riverine floods of the 20th century for which data are available have killed more than 1,843 people and caused more than $50 billion (uninflated) in damages (Perry, 2000). One of the most common means of describing the sevClimate change, atmospheric rivers, and floods in California - a multimodel analysis of storm frequency and magnitude changes
Recent studies have documented the important role that “atmospheric rivers” (ARs) of concentrated near‐surface water vapor above the Pacific Ocean play in the storms and floods in California, Oregon, and Washington. By delivering large masses of warm, moist air (sometimes directly from the Tropics), ARs establish conditions for the kinds of high snowlines and copious orographic rainfall that have100-Year flood–it's all about chance
In the 1960's, the United States government decided to use the 1-percent annual exceedance probability (AEP) flood as the basis for the National Flood Insurance Program. The 1-percent AEP flood was thought to be a fair balance between protecting the public and overly stringent regulation. Because the 1-percent AEP flood has a 1 in 100 chance of being equaled or exceeded in any 1 year, and it has aThe world's largest floods, past and present: Their causes and magnitudes
Floods are among the most powerful forces on earth. Human societies worldwide have lived and died with floods from the very beginning, spawning a prominent role for floods within legends, religions, and history. Inspired by such accounts, geologists, hydrologists, and historians have studied the role of floods on humanity and its supporting ecosystems, resulting in new appreciation for the many-faLarge floods in the United States: where they happen and why
The spatial distribution of large gaged floods throughout the United States shows that the locations of most of the largest flows are related to specific combinations of regional climatology, topography, and basin size. Key factors include the general northward trend of decreasing atmospheric moisture, proximity to oceanic moisture sources such as the Pacific Ocean and the Gulf of Mexico, and orie - News