
July 13, 2020: New publication describing Landsat Burned Area Algorithm and Products for the United States
Return to all Landsat Headlines
Complete and accurate burned area map data are needed to document spatial and temporal patterns of fires, to quantify their drivers, and to assess the impacts on human and natural systems. However, there are few sources that consistently and comprehensively track fires over space and time. The Landsat Burned Area Science Products provide new and unique information about spatial and temporal patterns of fire occurrence that many existing fire databases may miss.
A new publication in the journal of Remote Sensing of the Environment by Hawbaker et al., (2020) describes the Landsat Burned Area algorithm, the products produced, and new validation metrics. The paper describes the spatial and temporal patterns of burned areas across the conterminous U.S., how burned area varies in relation to the number of operational Landsat sensors, and a comparison with other burned area product datasets.
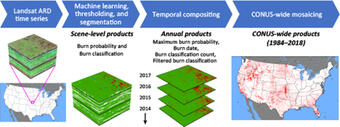
The Landsat Burned Area algorithm uses surface reflectance and top of atmosphere brightness temperature from the U.S. Landsat Analysis Ready Data product and includes improvements over the earlier Landsat Burned Area Essential Climate Variable (BAECV) algorithm and products. U.S. Landsat ARD is derived from Collection 1 Landsat 4-8 data (1982-present), providing users with a dense acquisition archive designed specifically for facilitating land change time series analysis. The Burned Area algorithm identifies burned areas in U.S. Landsat ARD tiles using machine learning, thresholding, and image segmentation.
Results from Hawbaker et al., (2020) show that from 1984 through 2018, U.S. annual burned area averaged 30,000 square kilometers, and increased over time at a rate of 356 km2/year. Compared to existing burned area products, the new Landsat Burned Area product identified 29% more burned area than the BAECV product (1984 – 2015), 183% more than the Monitoring Trends in Burn Severity / Geospatial Multi- Agency Coordination products (1984 – 2018), and 56% more than the NASA MODIS/Terra+Aqua Burned Area Monthly products (2003 – 2018).

Validation with reference data from high-resolution commercial satellite imagery resulted in omission and commission error rates averaging 19% and 41%, respectively. In comparison, validation with Landsat reference data had omission and commission error rates averaging 40% and 28%. Differences in the error rates are related to resolution of the validation data and date-differences between the Burned Area products and validation data.
The combined amount of burned area detected by multiple sensors was larger than from any individual sensor, but there was no significant difference between the individual sensors. For example, from 2014 through 2018, burned area detected by Landsat 8 OLI/TIRS alone was 21% greater than Landsat 7 ETM+ alone and 49% more burned area was detected by Landsat 7 ETM+ and Landsat 8 OLI/TIRS combined than Landsat 7 ETM+ alone.
Landsat Burned Area ARD products are routinely produced as new Landsat data are collected and provide a unique data source to monitor and assess the spatial and temporal patterns and the impacts of fire.
To learn more, visit the open access article in Remote Sensing of the Environment at https://doi.org/10.1016/j.rse.2020.111801 and the Landsat Burned Area product page.
Burned Area belongs to a suite of USGS research-quality, applications-ready, Landsat-derived science products aimed at reducing the burden of data processing for the user community. Visit the Landsat Science Products web page to learn more about the types of products available and how to download them.
Reference:
Hawbaker, T.J., Vanderhoof, M.K., Schmidt, G.L., Beal, Y.-J., Picotte, J.J., Takacs, J.D., Falgout, J.T., Dwyer, J.L., 2020. The Landsat Burned Area algorithm and products for the United States. Remote Sensing of the Environment 244. https://doi.org/10.1016/j.rse.2020.111801