
Surface breakouts (light in color) remain active on the upper coastal plain. These breakouts are fed by both the main eastern tube—left of the kipuka and below the tube's fume trace on the pali—and from the eastern June 26 breakout branch, visible to the right of the kipuka.
Images
Images related to natural hazards.
Filter Total Items: 7275

Breakouts remain active on flow field
Surface breakouts (light in color) remain active on the upper coastal plain. These breakouts are fed by both the main eastern tube—left of the kipuka and below the tube's fume trace on the pali—and from the eastern June 26 breakout branch, visible to the right of the kipuka.

Earth movers on Big Sur landslide, October 12, 2017
Earth movers on Big Sur landslide, October 12, 2017View of the huge landslide at Mud Creek on the Big Sur coast, October 12, 2017. USGS is studying the landslide, collecting data and imagery that can be used to monitor changes. USGS provides the data to Caltrans, the California Department of Transportation, whose heavy equipment and earth movers are shown here.

upper coastal plain breakouts on the episode 61g flow field. The ma...
upper coastal plain breakouts on the episode 61g flow field. The ma...A view of the upper coastal plain breakouts on the episode 61g flow field. The majority of the active surface flows on the coastal plain are being fed by the June 26 breakout branch on the eastern margin of the flow field (right).
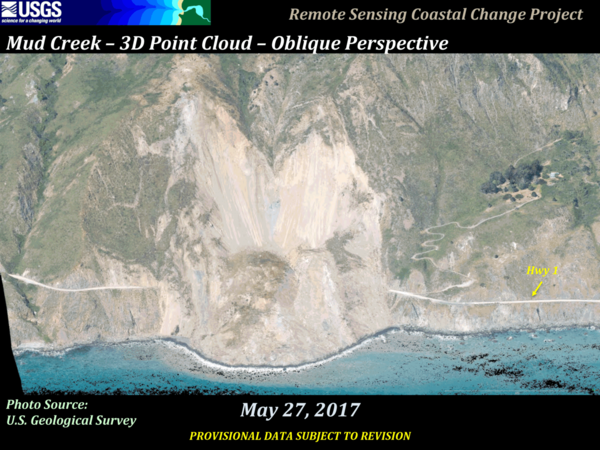
Mud Creek from June 13 to October 12, 2017
In 2017, the massive Mud Creek landslide buried a quarter-mile of the famous coastal route, California’s Highway 1, with rocks and dirt more than 65 feet deep. USGS monitors erosion along the landslide-prone cliffs of Big Sur, collecting aerial photos frequently throughout the year.
In 2017, the massive Mud Creek landslide buried a quarter-mile of the famous coastal route, California’s Highway 1, with rocks and dirt more than 65 feet deep. USGS monitors erosion along the landslide-prone cliffs of Big Sur, collecting aerial photos frequently throughout the year.

Thermal map of flow field
This map is similar to the map above but shows a thermal map over the Episode 61g lava flow. Cooler colors (blue and green) show cooled, inactive portions of the flow surface. Hot colors (red and orange) show areas of active surface breakouts.
This map is similar to the map above but shows a thermal map over the Episode 61g lava flow. Cooler colors (blue and green) show cooled, inactive portions of the flow surface. Hot colors (red and orange) show areas of active surface breakouts.

Deploying equipment from small boat
Wayne Baldwin, USGS, deploys a sound velocity profiler off the stern of the R/V Stephens in Lake Powell, UT-AZ as part of a collaborative program with the Utah Water Science Center to map the depth and sediments within Lake Powell, UT-AZ.
Wayne Baldwin, USGS, deploys a sound velocity profiler off the stern of the R/V Stephens in Lake Powell, UT-AZ as part of a collaborative program with the Utah Water Science Center to map the depth and sediments within Lake Powell, UT-AZ.

Map view of well recorded historical seismicity at Mount Hood since...
Map view of well recorded historical seismicity at Mount Hood since...Bottom: Cross-sectional view looking north. Right: Cross-sectional view looking west. Black outline is elevation profile through the summit of Mount Hood. Circles are sized with respect to earthquake magnitude. Earthquake locations from the Pacific Northwest Seismic Network.

Breakouts remain active on the coastal plain and pali
Breakouts remain active on the coastal plain and palipāhoehoe breakouts remain scattered on the coastal plain, but have not advanced significantly in recent weeks. In addition, small channelized ‘A‘ā flows have been recently active on the steep slopes of the pali. The pali can be seen in the distance in this photo.

typical pāhoehoe breakouts on the coastal plain, as well as a small...
typical pāhoehoe breakouts on the coastal plain, as well as a small...This video clip shows typical pāhoehoe breakouts on the coastal plain, as well as a small channelized ‘A‘ā flow on the pali.
typical pāhoehoe breakouts on the coastal plain, as well as a small...
typical pāhoehoe breakouts on the coastal plain, as well as a small...This video clip shows typical pāhoehoe breakouts on the coastal plain, as well as a small channelized ‘A‘ā flow on the pali.

Over the past two weeks, there have been at least three breakouts w...
Over the past two weeks, there have been at least three breakouts w...Over the past two weeks, there have been at least three breakouts within 100 m (330 ft) of the Kamokuna ocean entry. The western-most breakout (pictured above) had no visible surface breakouts on the cliff today (October 6), but was producing a nice cascading ‘A‘ā flow off the edge of the cliff and onto the delta.

Image taken by a time-lapse camera on Oct. 5 at 6:11 pm (), with th...
Image taken by a time-lapse camera on Oct. 5 at 6:11 pm (), with th...Image taken by a time-lapse camera on October 5 at 6:11 pm (HST), with the lava streams showing up nicely as the sun starts to go down.
Image taken by a time-lapse camera on Oct. 5 at 6:11 pm (), with th...
Image taken by a time-lapse camera on Oct. 5 at 6:11 pm (), with th...Image taken by a time-lapse camera on October 5 at 6:11 pm (HST), with the lava streams showing up nicely as the sun starts to go down.

A small channel flowing down the cliff to delta creates an ‘A‘ā fan...
A small channel flowing down the cliff to delta creates an ‘A‘ā fan...A small channel flowing down the cliff to the delta creates an ‘A‘ā fan at its distal tip. Many lava falls over the past week have locally built up the height of the sea cliff and covered much of the blocky rigid cliff face.

Coastal breakouts put on a show
There were clear views of the delta today (October 6), with only weak plumes being produced by the few ocean entries. Multiple pāhoehoe streams and drips entered the ocean on the east side of the delta (pictured).
There were clear views of the delta today (October 6), with only weak plumes being produced by the few ocean entries. Multiple pāhoehoe streams and drips entered the ocean on the east side of the delta (pictured).

Image taken by a time-lapse camera of multiple lava cascades on the...
Image taken by a time-lapse camera of multiple lava cascades on the...Image taken by a time-lapse camera of multiple lava cascades on the sea cliff on October 4 at 3:31 am (HST). Just a few of the many resulting surface flows can be seen on the delta both below the cliff and near the front, which is lit by lava and moonlight.

Tropical Storm Nate's Forecasted Effect on Gulf Beaches
Tropical Storm Nate's Forecasted Effect on Gulf BeachesTropical Storm Nate's predicted effect on Northern Gulf sandy shorelines, based on landfall as a Category 1 hurricane, is shown at three intensities. Outer band: Dune erosion. Middle band: Dune overwash. Inner band: Dune inundation, with potential flooding behind the dune. Credit: USGS Coastal Change Hazard Portal.

Modeling Kīlauea a Century Ago
This view of Halema‘uma‘u as it appeared in the 1917 relief model by George Carroll Curtis shows fine details around the crater, including the first road for automobiles, which ended near the crater rim. The light-colored circular feature around Halema‘uma‘u is a nearly continuous escarpment along which subsidence occurred. Photo by Burr A. Church.
This view of Halema‘uma‘u as it appeared in the 1917 relief model by George Carroll Curtis shows fine details around the crater, including the first road for automobiles, which ended near the crater rim. The light-colored circular feature around Halema‘uma‘u is a nearly continuous escarpment along which subsidence occurred. Photo by Burr A. Church.

Modeling Kīlauea a Century Ago
The 1917 Curtis relief model of Kīlauea Volcano's summit shows many well-known geologic features, including the summit caldera (large depression), Halema‘uma‘u (crater within the caldera), Kīlauea Iki (crater at far right), and elaborate drainage patterns (foreground). Photo by Burr A. Church.
The 1917 Curtis relief model of Kīlauea Volcano's summit shows many well-known geologic features, including the summit caldera (large depression), Halema‘uma‘u (crater within the caldera), Kīlauea Iki (crater at far right), and elaborate drainage patterns (foreground). Photo by Burr A. Church.
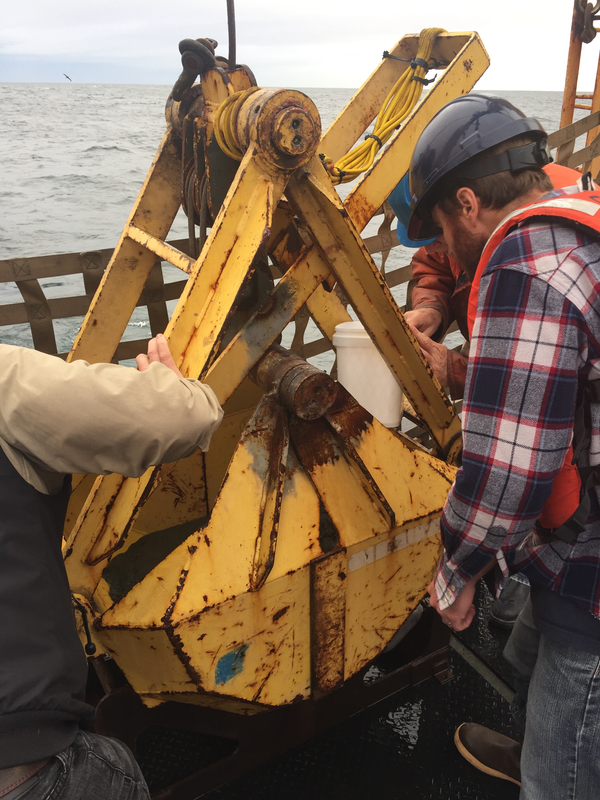
Examining bucket of seafloor sediment collected off southeast Alaska
Examining bucket of seafloor sediment collected off southeast AlaskaUSGS research geophysicist Danny Brothers (right) and colleagues examine the surface of a sediment grab sample just pulled onto the deck of the Canadian Coast Guard Ship John P. Tully. The sample was collected from the top of a mud volcano north of the border between southeast Alaska and British Columbia.

Legacy of Mount St. Helens 1980 eruption still defies perfect solution
Legacy of Mount St. Helens 1980 eruption still defies perfect solutionAerial view of Spirit Lake (center) looking north from above the crater of Mount St. Helens. The lake's outlet to the west (left) was blocked by the 1980 landslide, which required a new engineered outlet to maintain the lake at a safe level. A tunnel was drilled through a bedrock ridge on west side of lake in 1984-1985. Glacier covered Mount Rainier in distance.

breakout point of the easternmost of two short-lived breakouts that...
breakout point of the easternmost of two short-lived breakouts that...A view of the breakout point of the easternmost of two short-lived breakouts that began on September 23. This thin pāhoehoe breakout (lighter flow in center of photo) started approximately 45 m (49 yards) upslope of the sea cliff, and on the eastern side of the lava tube that feeds the ocean entry.

This western breakout also began on Sep. 23, at a distance of appro...
This western breakout also began on Sep. 23, at a distance of appro...This western breakout also began on September 23, at a distance of approximately 90 m (98 yards) from the sea cliff. This pāhoehoe (bottom edge has a yellow dotted outline) was more viscous than the breakout to the east, so the surface texture is less smooth and reflective, making it harder to distinguish between the older flows.