
The National Atmospheric Deposition Program (NADP) is a collaboration of atmospheric monitoring networks. The purpose of the networks is to collect data to evaluate air quality. Network data also inform science-based actions to protect human health and preserve ecosystems for current and future generations.
The NADP National Trends Network (NTN) quantifies the concentration of eight major ions and acidity present in precipitation samples for 250 sites across the United States. The Mercury Deposition (MDN), Ammonia Monitoring (AMoN), Atmospheric Mercury (AMNET), and Mercury Litterfall (MLN) Networks comprise the other NADP networks.
The USGS has been an NADP partner agency since 1981 and participates by providing funds for 69 NTN sites. USGS also funds one MDN and one MLN site.
USGS Monitoring Sites
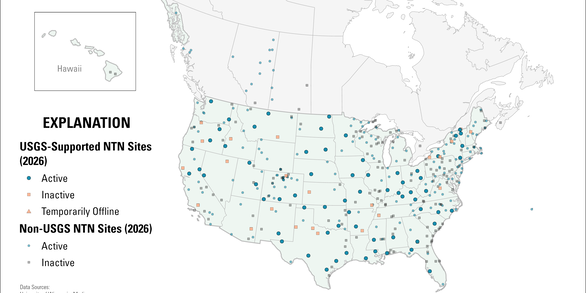
USGS funds and operates National Atmospheric Deposition Program sites throughout the United States.
A National Program

The National Atmospheric Deposition Program is a cooperative effort between many groups.
Quick Links
USGS supports monitoring sites within the National Trends Network, Mercury Deposition Network, and Mercury Litterfall Network of the National Atmospheric Deposition Program.
Data from the NADP networks are used to track trends and examine spatial patterns in atmospheric deposition of chemical elements that include nitrogen, sulfur, mercury, calcium, and others. Many of these chemical elements are naturally present in the atmosphere but also originate in part as air pollutant emissions from human activities including power plants and vehicles.

Policies implemented under the Clean Air Act, as part of global treaties, and by other regulations typically set targets for reducing emissions. Changes in air pollutant emissions are tracked by NADP measurements. Therefore, there is a close link between science, policy, and management at the heart of the NADP.
Site operators collect samples following approved methods. The NADP Analytical Laboratory (NAL) analyzes the samples using consistent methods. This facilitates comparisons across sites and ensures consistent data for evaluation of long-term trends in deposition chemistry.
The USGS participation in the NADP is funded by the National Water Quality Program.
Annual gradient maps
Since 1985, the NADP has created annual gradient maps of precipitation-weighted mean concentrations and deposition for several different chemical elements.
Learn more about the NADP data, program, and networks.
Connecting the dots between USGS water monitoring networks
The NADP has provided atmospheric deposition data to the nation as part of a collaborative effort since 1978. The USGS supports the largest number of sites in the contiguous United States in monitoring deposition with the National Trends Network (NTN). This effort includes weekly sampling at sites in some of the most remote locations to provide continual data on the trends in many atmospheric chemistry constituents including nitrogen, phosphorus, sulfur, calcium, chloride and others. Annual summaries of the data with trend plots of constituent concentrations and deposition across the country are available. USGS researchers can use NADP data in conjunction with surface water and groundwater water quality data to have a more complete chemistry record in watersheds throughout the nation. This data is used to inform scientists and policy makers of changes in concentration and deposition rates across the country.
The funding for the NADP comes from the National Water Quality Program (NWQP). The USGS Observing Systems Division within the Water Resources Mission Area operates and coordinates large, congressionally mandated USGS atmospheric deposition monitoring networks such as the National Atmospheric Deposition Program.
Authorizations
USGS activities are conducted under the authority of various pieces of authorizing federal legislation. The following is a subset of authorizations that are related to the National Atmospheric Deposition Program:
42 U.S.C. § 8901 et seq. | Acid Precipitation Act of 1980 (Pub. L. 104–182)
Title IX of the Clean Air Act Amendments of 1990 (Pub. L. 101-549) calls for continuation of the National Acid Precipitation Assessment Program (NAPAP) established under the Acid Precipitation Act of 1980. The USGS is an active participant in the research program through its support of interagency monitoring of precipitation chemistry via the National Atmospheric Deposition Program. In addition, the USGS is a participant in studies of acid precipitation because of prior work in this field.
Here is a full list of National Water Quality Program authorizations.
Below are other science topics associated with the National Atmospheric Deposition Program.

National Water Monitoring Network
The National Atmospheric Deposition Program (NADP) is a collaboration of atmospheric monitoring networks. The purpose of the networks is to collect data to evaluate air quality. Network data also inform science-based actions to protect human health and preserve ecosystems for current and future generations.
The NADP National Trends Network (NTN) quantifies the concentration of eight major ions and acidity present in precipitation samples for 250 sites across the United States. The Mercury Deposition (MDN), Ammonia Monitoring (AMoN), Atmospheric Mercury (AMNET), and Mercury Litterfall (MLN) Networks comprise the other NADP networks.
The USGS has been an NADP partner agency since 1981 and participates by providing funds for 69 NTN sites. USGS also funds one MDN and one MLN site.
USGS Monitoring Sites
USGS funds and operates National Atmospheric Deposition Program sites throughout the United States.
A National Program
The National Atmospheric Deposition Program is a cooperative effort between many groups.
Quick Links
USGS supports monitoring sites within the National Trends Network, Mercury Deposition Network, and Mercury Litterfall Network of the National Atmospheric Deposition Program.
Data from the NADP networks are used to track trends and examine spatial patterns in atmospheric deposition of chemical elements that include nitrogen, sulfur, mercury, calcium, and others. Many of these chemical elements are naturally present in the atmosphere but also originate in part as air pollutant emissions from human activities including power plants and vehicles.
Policies implemented under the Clean Air Act, as part of global treaties, and by other regulations typically set targets for reducing emissions. Changes in air pollutant emissions are tracked by NADP measurements. Therefore, there is a close link between science, policy, and management at the heart of the NADP.
Site operators collect samples following approved methods. The NADP Analytical Laboratory (NAL) analyzes the samples using consistent methods. This facilitates comparisons across sites and ensures consistent data for evaluation of long-term trends in deposition chemistry.
The USGS participation in the NADP is funded by the National Water Quality Program.
Annual gradient maps
Since 1985, the NADP has created annual gradient maps of precipitation-weighted mean concentrations and deposition for several different chemical elements.
Learn more about the NADP data, program, and networks.
Connecting the dots between USGS water monitoring networks
The NADP has provided atmospheric deposition data to the nation as part of a collaborative effort since 1978. The USGS supports the largest number of sites in the contiguous United States in monitoring deposition with the National Trends Network (NTN). This effort includes weekly sampling at sites in some of the most remote locations to provide continual data on the trends in many atmospheric chemistry constituents including nitrogen, phosphorus, sulfur, calcium, chloride and others. Annual summaries of the data with trend plots of constituent concentrations and deposition across the country are available. USGS researchers can use NADP data in conjunction with surface water and groundwater water quality data to have a more complete chemistry record in watersheds throughout the nation. This data is used to inform scientists and policy makers of changes in concentration and deposition rates across the country.
The funding for the NADP comes from the National Water Quality Program (NWQP). The USGS Observing Systems Division within the Water Resources Mission Area operates and coordinates large, congressionally mandated USGS atmospheric deposition monitoring networks such as the National Atmospheric Deposition Program.
Authorizations
USGS activities are conducted under the authority of various pieces of authorizing federal legislation. The following is a subset of authorizations that are related to the National Atmospheric Deposition Program:
42 U.S.C. § 8901 et seq. | Acid Precipitation Act of 1980 (Pub. L. 104–182)
Title IX of the Clean Air Act Amendments of 1990 (Pub. L. 101-549) calls for continuation of the National Acid Precipitation Assessment Program (NAPAP) established under the Acid Precipitation Act of 1980. The USGS is an active participant in the research program through its support of interagency monitoring of precipitation chemistry via the National Atmospheric Deposition Program. In addition, the USGS is a participant in studies of acid precipitation because of prior work in this field.
Here is a full list of National Water Quality Program authorizations.
Below are other science topics associated with the National Atmospheric Deposition Program.