U.S. flag

An official website of the United States government

Images

Hawaiian Volcano Observatory images of eruptive activity, field work, and more.

Filter Total Items: 4072
Color photograph of field engineer replacing wires at volcano monitoring station
September 6, 2024 — Kohala monitoring station maintenance

A USGS Hawaiian Volcano Observatory (HVO) field engineer replaces the power cable at the KOHD repeater station. HVO field engineers maintain the network of instruments that allow HVO to monitor volcanic activity and earthquakes in Hawaii. Working with HVO IT-specialists, they ensure that each monitoring station functions and can relay data back to the observatory.

A USGS Hawaiian Volcano Observatory (HVO) field engineer replaces the power cable at the KOHD repeater station. HVO field engineers maintain the network of instruments that allow HVO to monitor volcanic activity and earthquakes in Hawaii. Working with HVO IT-specialists, they ensure that each monitoring station functions and can relay data back to the observatory.

Color photograph of volcano monitoring station
September 6, 2024 — Kohala monitoring station maintenance

Repeater station KOHD receives data from monitoring stations nearby and relays it back to the Hawaiian Volcano Observatory. The site is located on Kohala volcano, which last erupted over one hundred thousand years ago. The verdant pu‘u (hills) that are cinder cones erupted by Kohala are visible in the background of this photo. USGS photo by K. Mulliken.

Repeater station KOHD receives data from monitoring stations nearby and relays it back to the Hawaiian Volcano Observatory. The site is located on Kohala volcano, which last erupted over one hundred thousand years ago. The verdant pu‘u (hills) that are cinder cones erupted by Kohala are visible in the background of this photo. USGS photo by K. Mulliken.

Color photograph of field engineer maintaining remote volcano monitoring station
September 4, 2024 — Hualālai monitoring station maintenance

At the Hualālai repeater station, USGS Hawaiian Volcano Observatory field engineers installed a voice repeater that will enable radio communications between disparate locations. USGS photo by M. Warren.

At the Hualālai repeater station, USGS Hawaiian Volcano Observatory field engineers installed a voice repeater that will enable radio communications between disparate locations. USGS photo by M. Warren.

Color photograph of field engineers performing volcano monitoring station maintenance
September 4, 2024 — Hualālai station maintenance

The Hualālai repeater site is located on the southeast side of Hualālai volcano, which erupted most recently in 1800-1801. At an elevation of 2,160 meters (7,090 feet) above sea level, the repeater site is often enshrouded in fog. A suite of solar panels is used to generate power for the site, stored locally in lithium batteries. USGS photo by M. Warren.

The Hualālai repeater site is located on the southeast side of Hualālai volcano, which erupted most recently in 1800-1801. At an elevation of 2,160 meters (7,090 feet) above sea level, the repeater site is often enshrouded in fog. A suite of solar panels is used to generate power for the site, stored locally in lithium batteries. USGS photo by M. Warren.

Color photograph of volcano monitoring station power and electronics system
September 4, 2024 — Hualālai monitoring station maintenance

Remote volcano monitoring stations on the Island of Hawai‘i are powered via solar panels that charge a suite of batteries. The power system at the Hualālai repeater station, which relays data from nearby stations back to the observatory, was upgraded in 2023 to use lithium batteries (white boxes in the photo). USGS photo by M. Warren.

Remote volcano monitoring stations on the Island of Hawai‘i are powered via solar panels that charge a suite of batteries. The power system at the Hualālai repeater station, which relays data from nearby stations back to the observatory, was upgraded in 2023 to use lithium batteries (white boxes in the photo). USGS photo by M. Warren.

Color photograph of instrument mounted to the bottom of a helicopter
HVO’s Riegl VUX-120 aerial lidar system

HVO’s Riegl VUX-120 aerial lidar system mounted to the belly of a contracted helicopter just before the September 5, 2024 test flight. Photo by D. Filiano, U.S. Army Corps of Engineers.

HVO’s Riegl VUX-120 aerial lidar system mounted to the belly of a contracted helicopter just before the September 5, 2024 test flight. Photo by D. Filiano, U.S. Army Corps of Engineers.

Color photograph of lidar point cloud and photograph of volcanic cone
Point cloud and photograph of Pu‘ukoa‘e on Kīlauea

Left: A snapshot of the point cloud from HVO’s September 5, 2024, lidar test flight along Kīlauea’s Southwest Rift Zone, providing an east-looking oblique view of Pu‘ukoa‘e (upper left) and another unnamed cinder cone (lower right).

Left: A snapshot of the point cloud from HVO’s September 5, 2024, lidar test flight along Kīlauea’s Southwest Rift Zone, providing an east-looking oblique view of Pu‘ukoa‘e (upper left) and another unnamed cinder cone (lower right).

Color photograph of scientist measuring crack in road
August 22, 2024 — Measuring cracks on Chain of Craters Road, Kīlauea

USGS Hawaiian Volcano Observatory geologist Mike Cappos takes the bearing of a crack that formed in Chain of Craters Road during a recent intrusive event near Pauahi Crater in Hawai‘i Volcanoes National Park. USGS photo by C. Sealing.

USGS Hawaiian Volcano Observatory geologist Mike Cappos takes the bearing of a crack that formed in Chain of Craters Road during a recent intrusive event near Pauahi Crater in Hawai‘i Volcanoes National Park. USGS photo by C. Sealing.

Color photograph of scientist measuring cracks in road
August 22, 2024 — Measuring cracks on Chain of Craters Road, Kīlauea

USGS Hawaiian Volcano Observatory geologist Mike Cappos measures cracks that formed in Chain of Craters Road during a recent intrusive event near PAUAHI Crater in Hawai‘i Volcanoes National Park. USGS photo by C. Sealing.

USGS Hawaiian Volcano Observatory geologist Mike Cappos measures cracks that formed in Chain of Craters Road during a recent intrusive event near PAUAHI Crater in Hawai‘i Volcanoes National Park. USGS photo by C. Sealing.

Color map showing deformation and earthquakes on volcano
August 22, 2024—InSAR image of ground deformation and map of seismicity for Kīlauea upper East Rift Zone intrusion

The map on the left shows recent deformation at Kīlauea over the timeframe of August 9–21, 2024. Data were acquired by the European Space Agency's Sentinel-1A satellite. Colored fringes denote areas of ground deformation, with more fringes indicating more deformation. Each color cycle represents 2.8 cm (1.1 in) of ground motion.

The map on the left shows recent deformation at Kīlauea over the timeframe of August 9–21, 2024. Data were acquired by the European Space Agency's Sentinel-1A satellite. Colored fringes denote areas of ground deformation, with more fringes indicating more deformation. Each color cycle represents 2.8 cm (1.1 in) of ground motion.

Color photograph of scientists checking volcano monitoring equipment
August 20, 2024 — Routine field visit to Kīlauea summit

USGS scientists visited the KWcam webcam, at the summit of Kīlauea, to replace the desiccant packs that keep the webcam enclosure dry. Despite ongoing earthquake activity in the upper East Rift Zone of Kīlauea, activity beneath the summit caldera was quiet today. USGS photo by M. Patrick.
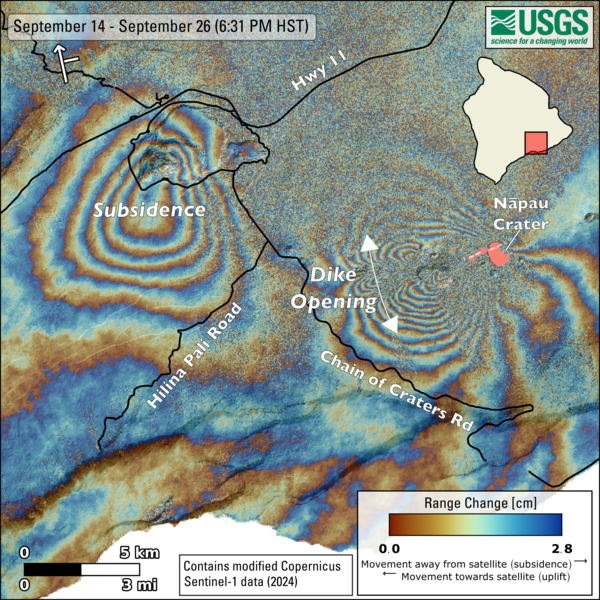
USGS scientists visited the KWcam webcam, at the summit of Kīlauea, to replace the desiccant packs that keep the webcam enclosure dry. Despite ongoing earthquake activity in the upper East Rift Zone of Kīlauea, activity beneath the summit caldera was quiet today. USGS photo by M. Patrick.

Color photograph of scientist photographing summit caldera of volcano
August 20, 2024 — Routine field visit to Kīlauea summit

USGS scientists made a routine visit to the summit of Kīlauea for maintenance work on a webcam and general observations. The weather offered clear views of Kaluapele (the summit caldera), and only minor outgassing from several spots on the caldera floor. USGS photo by M. Patrick.

USGS scientists made a routine visit to the summit of Kīlauea for maintenance work on a webcam and general observations. The weather offered clear views of Kaluapele (the summit caldera), and only minor outgassing from several spots on the caldera floor. USGS photo by M. Patrick.

Color map showing deformation on volcano
August 19, 2024—InSAR image of Kīlauea ground deformation

This map shows recent deformation at Kīlauea, over the timeframe of August 7-19, 2024. Data were acquired by the European Space Agency's Sentinel-1A satellite. Colored fringes denote areas of ground deformation, with more fringes indicating more deformation.  Each color cycle represents 2.8 cm (1.1 in) of ground motion.

This map shows recent deformation at Kīlauea, over the timeframe of August 7-19, 2024. Data were acquired by the European Space Agency's Sentinel-1A satellite. Colored fringes denote areas of ground deformation, with more fringes indicating more deformation.  Each color cycle represents 2.8 cm (1.1 in) of ground motion.

Color map showing past lava flows from volcanic rift zone
Kīlauea middle East Rift Zone reference map

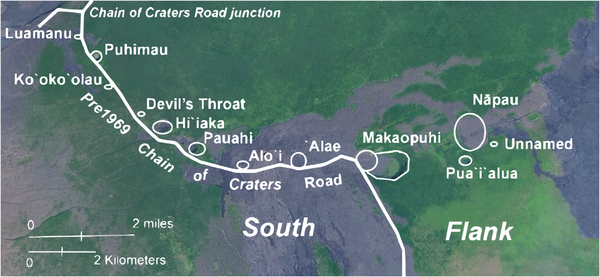
This reference map depicts the features on Kīlauea's middle East Rift Zone, much of which is within Hawaiʻi Volcanoes National Park. Pit craters and lava flows are evidence of a long history of magma moving along this rift zone pathway. Numerous eruptions took place in this region during the 1960s–1970s.

This reference map depicts the features on Kīlauea's middle East Rift Zone, much of which is within Hawaiʻi Volcanoes National Park. Pit craters and lava flows are evidence of a long history of magma moving along this rift zone pathway. Numerous eruptions took place in this region during the 1960s–1970s.

Color map showing ground deformation on volcano
August 7, 2024—InSAR image of Kīlauea ground deformation

This map shows recent deformation at Kīlauea, over the timeframe of July 26-August 7, 2024. Data were acquired by the European Space Agency's Sentinel-1A satellite. Colored fringes denote areas of ground deformation, with more fringes indicating more deformation.  Each color cycle represents 2.8 cm (1.1 in) of ground motion.

This map shows recent deformation at Kīlauea, over the timeframe of July 26-August 7, 2024. Data were acquired by the European Space Agency's Sentinel-1A satellite. Colored fringes denote areas of ground deformation, with more fringes indicating more deformation.  Each color cycle represents 2.8 cm (1.1 in) of ground motion.

Color photograph of scientist conducting maintenance on volcanic gas monitoring station
August 2, 2024—Sulfur Cone gas monitoring maintenance

A Hawaiian Volcano Observatory gas scientist works to install a newly calibrated Multi-Gas instrument at the Sulfur Cone site. At an elevation of 3,430 meters (11,240 feet) above sea level, the air is rare! Working conditions are far more strenuous for HVO field teams at these high elevations due to the much lower levels of oxygen in the air to breathe.

A Hawaiian Volcano Observatory gas scientist works to install a newly calibrated Multi-Gas instrument at the Sulfur Cone site. At an elevation of 3,430 meters (11,240 feet) above sea level, the air is rare! Working conditions are far more strenuous for HVO field teams at these high elevations due to the much lower levels of oxygen in the air to breathe.

Photo of volcanic cone
August 2, 2024—Sulfur Cone gas monitoring maintenance

On August 2,2024, Hawaiian Volcano Observatory Gas Scientists flew via helicopter to the Sulfur Cone Multi-Gas instrumentation site on Mauna Loa's Southwest Rift Zone, which is at an elevation of 3,430 meters (11,240 feet) above sea level.

On August 2,2024, Hawaiian Volcano Observatory Gas Scientists flew via helicopter to the Sulfur Cone Multi-Gas instrumentation site on Mauna Loa's Southwest Rift Zone, which is at an elevation of 3,430 meters (11,240 feet) above sea level.

Color photograph of volcanic gas monitoring instrumentation
August 2, 2024—Sulfur Cone gas monitoring maintenance

This photograph shows the inside of the Hawaiian Volcano Observatory (HVO) Multi-Gas site at Sulfur Cone. Currently, HVO has 2 of these continuous gas monitoring sites in operation on the Island of Hawai‘i. This one at Sulfur Cone high on Mauna Loa's Southwest Rift Zone, along with one at the summit of Kīlauea.

This photograph shows the inside of the Hawaiian Volcano Observatory (HVO) Multi-Gas site at Sulfur Cone. Currently, HVO has 2 of these continuous gas monitoring sites in operation on the Island of Hawai‘i. This one at Sulfur Cone high on Mauna Loa's Southwest Rift Zone, along with one at the summit of Kīlauea.

Color photograph of volcanic gas monitoring instrumentation
August 2, 2024—Sulfur Cone gas monitoring maintenance

This photograph shows the inside of the Hawaiian Volcano Observatory (HVO) Multi-Gas site at Sulfur Cone. Currently, HVO has 2 of these continuous gas monitoring sites in operation on the Island of Hawai‘i. This one at Sulfur Cone high on Mauna Loa's Southwest Rift Zone, along with one at the summit of Kīlauea.

This photograph shows the inside of the Hawaiian Volcano Observatory (HVO) Multi-Gas site at Sulfur Cone. Currently, HVO has 2 of these continuous gas monitoring sites in operation on the Island of Hawai‘i. This one at Sulfur Cone high on Mauna Loa's Southwest Rift Zone, along with one at the summit of Kīlauea.

Color photograph of volcanic gas monitoring instrumentation
August 2, 2024—Sulfur Cone gas monitoring maintenance

This photo shows the gas monitoring site layout at Sulfur Cone. On the left side of the photo is the power/telemetry system which powers the Multi-Gas instrument and sends data back to HVO via radio to be later analyzed by HVO gas scientists.

This photo shows the gas monitoring site layout at Sulfur Cone. On the left side of the photo is the power/telemetry system which powers the Multi-Gas instrument and sends data back to HVO via radio to be later analyzed by HVO gas scientists.

Color photograph of volcanic gas monitoring instrument
August 2, 2024—Sulfur Cone gas monitoring maintenance

The continuously monitoring Multi-Gas instrument at Sulfur Cone is housed inside the black Pelican case shown here. Air is pulled into the instrument via a small pump to be analyzed for volcanic gases (Sulfur Dioxide, Hydrogen Sulfide, Carbon Dioxide and Water Vapor).

The continuously monitoring Multi-Gas instrument at Sulfur Cone is housed inside the black Pelican case shown here. Air is pulled into the instrument via a small pump to be analyzed for volcanic gases (Sulfur Dioxide, Hydrogen Sulfide, Carbon Dioxide and Water Vapor).

Was this page helpful?