
An area on the north rim of Yellowstone caldera, to the south of Norris Geyser Basin, started to uplift slightly in July 2025. Similar deformation occurred in the same area during 1996-2004 and reveals characteristics of the subsurface.
In July 2025, minor uplift began along the north rim of Yellowstone caldera, just south of Norris Geyser Basin. This area is referred to as the “Norris Uplift Anomaly” because of a previous episode of uplift that occurred in 1996–2004. Following that earlier time period, the area subsided for a few years and then was mostly quiet until mid-2025. The area of deformation probably reflects magmatic activity about 14 km (9 miles) beneath the surface. The uplift does not indicate an increased chance of eruption, but rather is a sign of the dynamic changes that are common in the region but that could only be recognized by increased monitoring capabilities and improvements in technology over the past few decades.
Recent deformation of the Norris Uplift Anomaly (NUA)
The recent NUA deformation was detected by three different monitoring techniques: continuous GPS, semipermanent GPS, and InSAR.
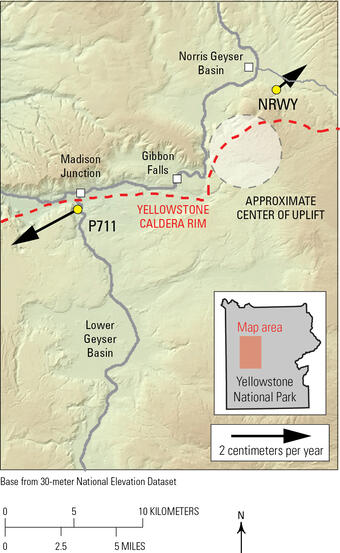
There are no continuous GPS stations located in the core area of the uplift, but two, designated P711 (near Madison Junction) and NRWY (near Norris Junction), are located on the margins, where horizontal deformation caused by the uplift is relatively easy to detect. In July 2025, P711 began moving to the southwest, and NRWY to the northeast—both moving away from the center of uplift (just as two different sides of an inflating balloon move away from the balloon’s center). From July until the end of 2025, P711 moved to the west by about 1 centimeter (0.4 inch).
The full set of continuous GPS data from the Yellowstone region are available from https://earthquake.usgs.gov/monitoring/gps/YellowstoneContin_ITRF2014.
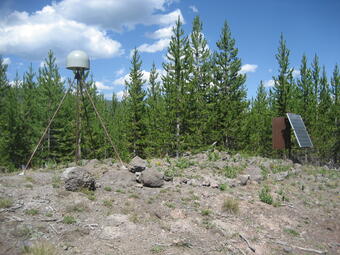
Semipermanent GPS stations are deployed seasonally, usually set up in May and recovered in September. They are intended to augment continuous GPS coverage but do not have telemetry, so they only record data on site, and those data are only available when the equipment is recovered and downloaded. One semipermanent GPS station, designated BRYL, is located near the center of uplift. Data for that station from 2025 show that uplift began in July, about the same time as horizontal motion was recorded at continuous GPS stations P711 and NRWY. The amount of uplift from July until the station was recovered in late September was about 2 centimeters (0.8 inches). Uplift was also recorded at nearby semipermanent GPS station MMTN.
The full set of semipermanent GPS data from the Yellowstone area are available from https://earthquake.usgs.gov/monitoring/gps/Yellowstone_SPGPS_ITRF2014.
InSAR (interferometric synthetic aperture radar) is a technique that compares to radar images of the surface that are acquired at different times and calculates the ground motion that occurs in the direction of the satellite (usually at some angle from vertical) between the two times. The deformation is visualized as colored fringes, with more colored fringes meaning more ground motion. InSAR data that span October 2024 to October 2025 show a colorful “bullseye” in the area of the NUA. The data indicate about 2 centimeters (0.8 inches) of uplift, similar to what was measured by the semipermanent GPS station BRYL. InSAR data cannot penetrate significant snow cover, so it will not be possible to update interferograms of the Yellowstone area until spring/summer 2026.
Current monitoring data
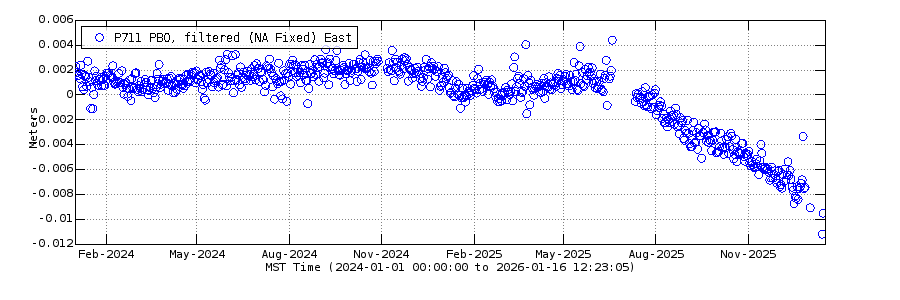
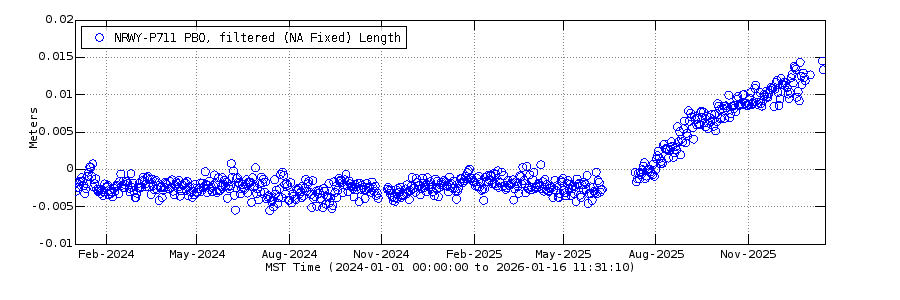
The plots below show the east component of P711 since 2024 (upper plot), as well as the distance change between sites P711 and NRWY (lower plot), which span the area of uplift. Both plots will be updated regularly as new results are acquired and processed.
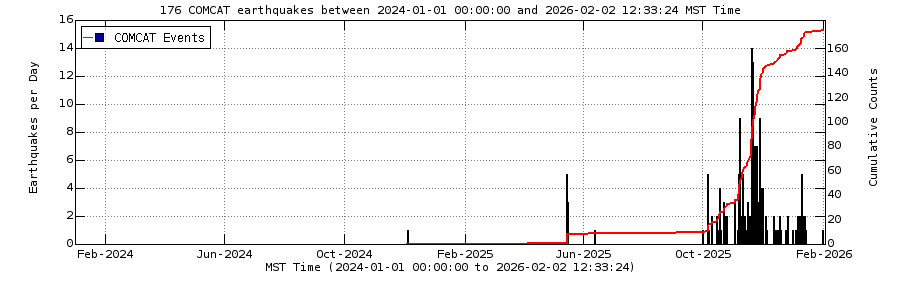
In the area of the uplift, there was a slight increase in seismicity during September-December 2025. During that time, over 200 earthquakes were located near the center of uplift, mostly during November. The largest event during this time period was M2.7 (there were 4 earthquakes in the M2 range). Overall, seismicity in the Yellowstone region during 2025 was low (1,119 located earthquakes) compared to typical rates (1,500-2,500 located earthquakes per year). The association between the earthquakes and the uplift is not clear, but the coincidence in timing suggests a link, probably because the uplift exerts small stresses on the surrounding rock.
What is the cause of the Norris Uplift Anomaly?
Ground deformation in the Yellowstone region can be caused by a variety of sources—changes in groundwater conditions, faulting, magma accumulation or withdrawal, cooling of subsurface fluids, and the accumulation and release of hydrothermal fluids, to name a few. In the case of the Norris Uplift Anomaly, the most likely cause is accumulation of magma. Mathematical modeling of the deformation indicates that the source is about 14 kilometers (9 miles) beneath the surface, which is deeper than would be expected for hydrothermal fluids. The shape of the deformation—a circular anomaly when viewed from above—is not what would be expected from faulting.
The area of the Norris Uplift Anomaly is also the only place in the Yellowstone region where long-period earthquakes have been recorded. Long-period (sometimes called low-frequency) earthquakes are gentler and more resonant than typical short-period earthquakes that are associated with breaking rock, and they are thought to result from fluids (water, gas, or magma) moving through cracks beneath the ground. Only two such earthquakes have ever been recorded at Yellowstone: one on August 16, 2021, about 16 kilometers (10 miles) beneath Norris Geyser Basin, and another on October 25, 2021, about 19 kilometers (12 miles) beneath the Gibbon Falls area. The location and depth of these two events is consistent with the depth of the Norris Uplift Anomaly deformation and support the presence of an active magmatic system in the area.
Should we be worried about a volcanic eruption?
No. This deformation is due to activity deep beneath the ground—well beneath the top of the magma chamber, which is about 3.8 kilometers (2.4 miles) beneath the surface. It is probably a common process in Yellowstone, but only in the past few decades has it been possible to detect such small deformation thanks to improvements in technology and monitoring networks.
Prior to any volcanic eruption, there would be dramatic increases in the rates of deformation and obvious shallowing of the deformation source, coupled with major increases in seismicity, as well as changes in gas emissions and thermal output. Yellowstone’s magma chamber is mostly solid, and a volcanic eruption is unlikely anytime soon. The most recent volcanic eruption occurred 70,000 years ago and was a lava flow that resulted in the formation of Pitchstone Plateau in the south part of Yellowstone National Park. The most likely geologic hazards on human timescales are strong tectonic earthquakes (like the M7.3 that occurred at Hebgen Lake in 1959) and hydrothermal explosions (like the July 23, 2024, explosion at Biscuit Basin).
When was the Norris Uplift Anomaly last active?
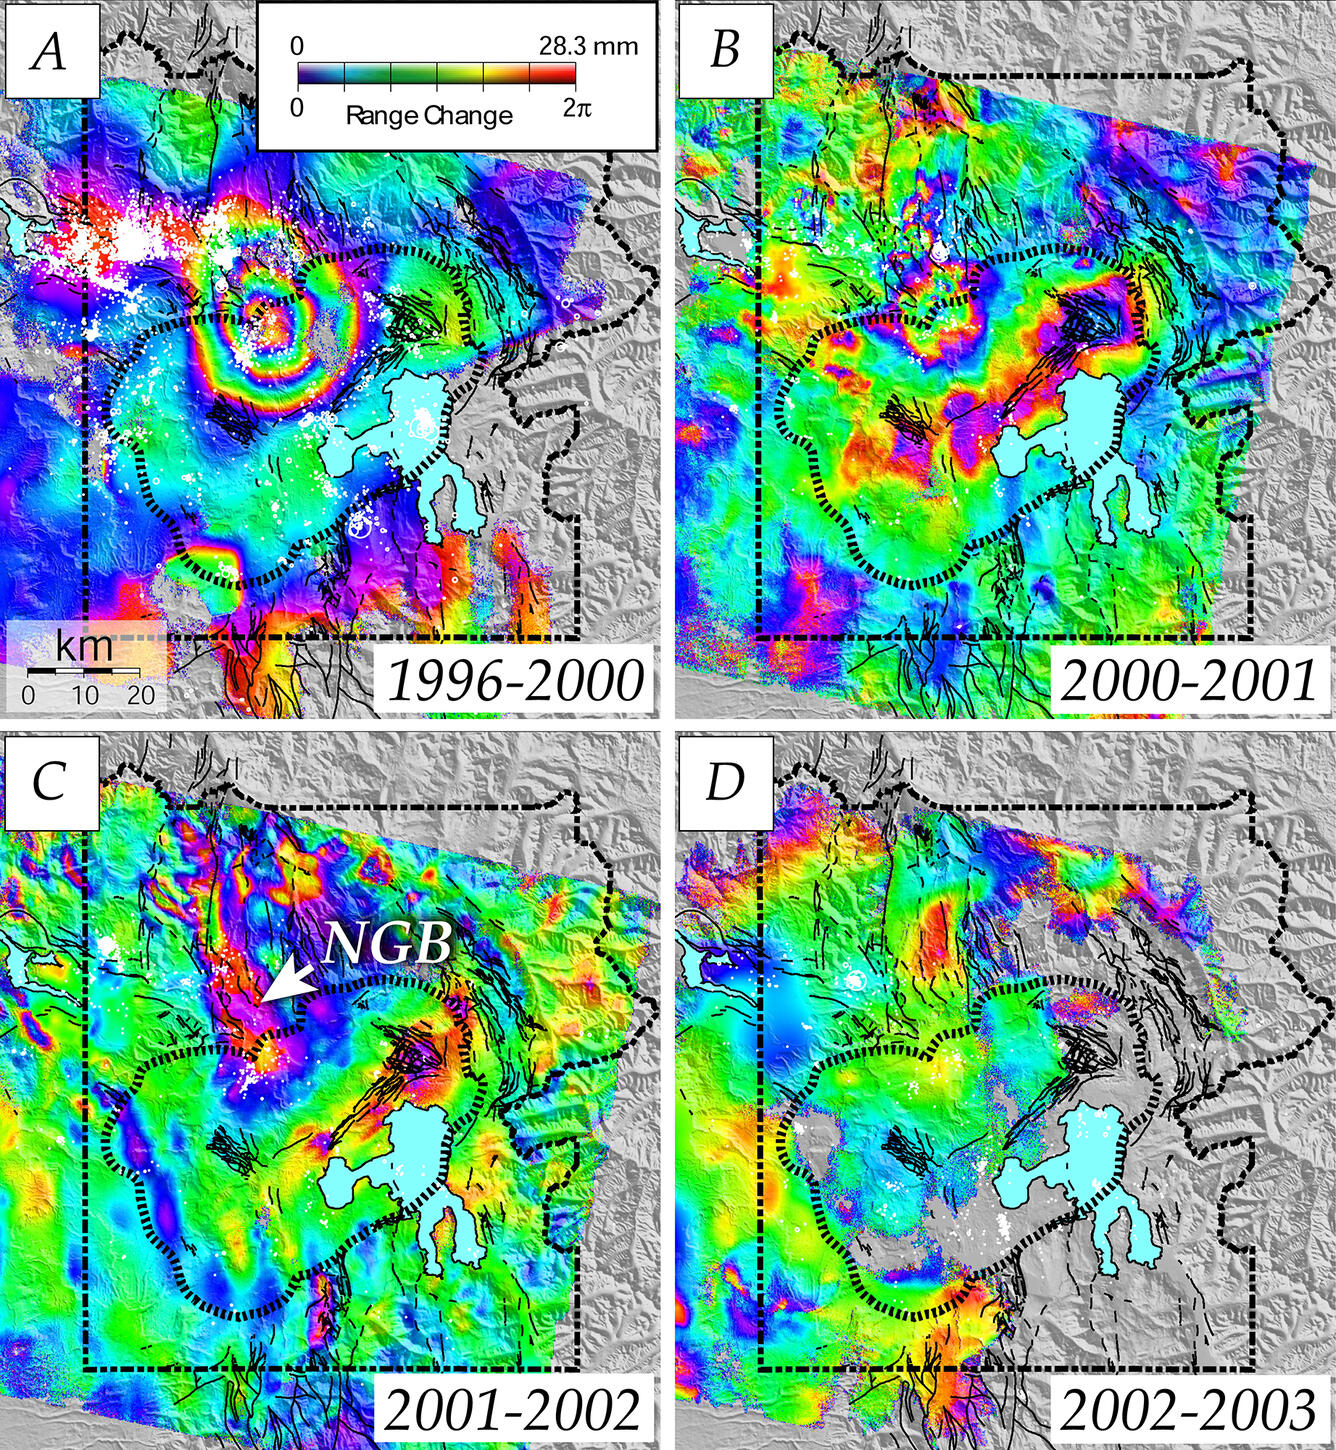
The first time the Norris Uplift Anomaly was detected was during 1996–2004, when the area rose by about 12 centimeters (4.7 inches). The deformation was recognized mostly from InSAR data because continuous GPS monitoring in the Yellowstone region was limited at that time. After 2004, the area subsided by about 7 centimeters (2.8 inches) and then was mostly inactive. During 2013–2020 there was uplift and subsidence closer to Norris Geyser Basin, but this deformation was related to the geyser basin itself and the accumulation and release of water at shallow levels.
InSAR data from September 2020 to September 2021 suggested that the Norris Uplift Anomaly had reactivated, but the signal was minor—only about 1 centimeter (0.4 inches). This deformation was too small to be obvious in any GPS data, and an interferogram from the following year (2021–2022) indicated that the area had subsided slightly. The interferograms showing this deformation can be found in the Yellowstone Volcano Observatory annual reports for 2021 and 2022.
An area on the north rim of Yellowstone caldera, to the south of Norris Geyser Basin, started to uplift slightly in July 2025. Similar deformation occurred in the same area during 1996-2004 and reveals characteristics of the subsurface.
In July 2025, minor uplift began along the north rim of Yellowstone caldera, just south of Norris Geyser Basin. This area is referred to as the “Norris Uplift Anomaly” because of a previous episode of uplift that occurred in 1996–2004. Following that earlier time period, the area subsided for a few years and then was mostly quiet until mid-2025. The area of deformation probably reflects magmatic activity about 14 km (9 miles) beneath the surface. The uplift does not indicate an increased chance of eruption, but rather is a sign of the dynamic changes that are common in the region but that could only be recognized by increased monitoring capabilities and improvements in technology over the past few decades.
Recent deformation of the Norris Uplift Anomaly (NUA)
The recent NUA deformation was detected by three different monitoring techniques: continuous GPS, semipermanent GPS, and InSAR.
There are no continuous GPS stations located in the core area of the uplift, but two, designated P711 (near Madison Junction) and NRWY (near Norris Junction), are located on the margins, where horizontal deformation caused by the uplift is relatively easy to detect. In July 2025, P711 began moving to the southwest, and NRWY to the northeast—both moving away from the center of uplift (just as two different sides of an inflating balloon move away from the balloon’s center). From July until the end of 2025, P711 moved to the west by about 1 centimeter (0.4 inch).
The full set of continuous GPS data from the Yellowstone region are available from https://earthquake.usgs.gov/monitoring/gps/YellowstoneContin_ITRF2014.
Semipermanent GPS stations are deployed seasonally, usually set up in May and recovered in September. They are intended to augment continuous GPS coverage but do not have telemetry, so they only record data on site, and those data are only available when the equipment is recovered and downloaded. One semipermanent GPS station, designated BRYL, is located near the center of uplift. Data for that station from 2025 show that uplift began in July, about the same time as horizontal motion was recorded at continuous GPS stations P711 and NRWY. The amount of uplift from July until the station was recovered in late September was about 2 centimeters (0.8 inches). Uplift was also recorded at nearby semipermanent GPS station MMTN.
The full set of semipermanent GPS data from the Yellowstone area are available from https://earthquake.usgs.gov/monitoring/gps/Yellowstone_SPGPS_ITRF2014.
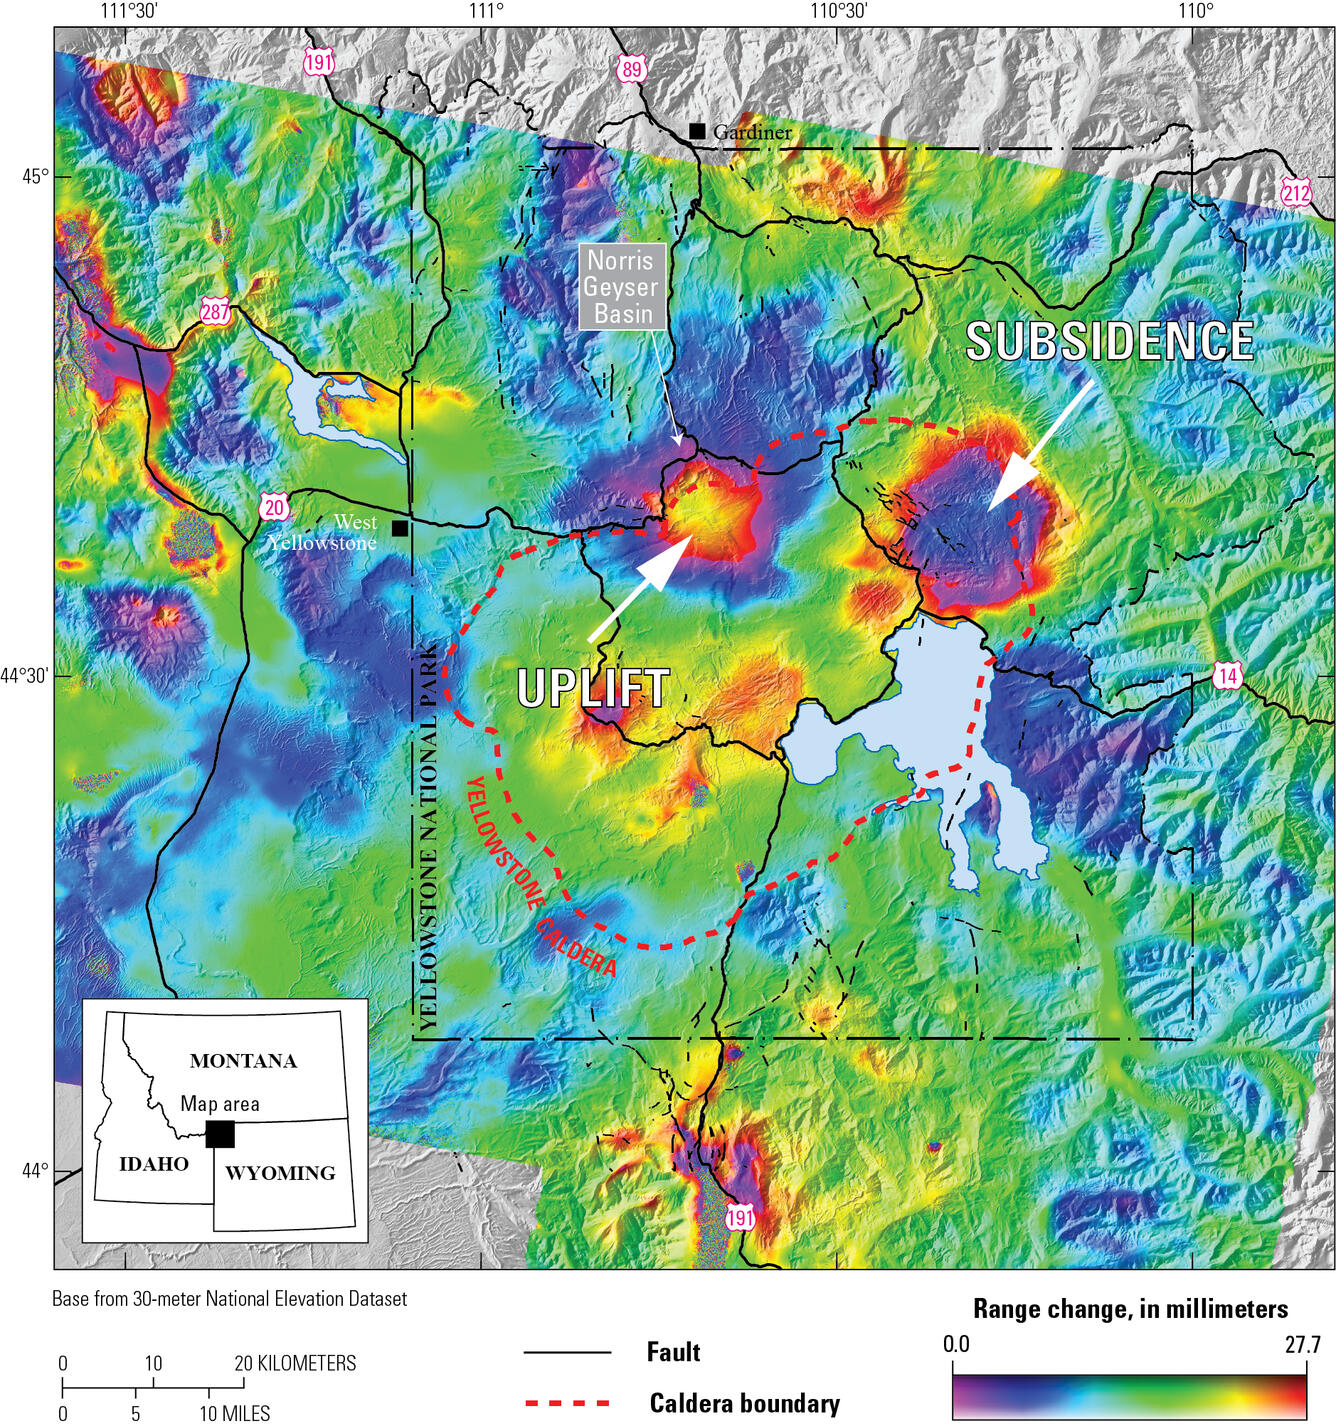
InSAR (interferometric synthetic aperture radar) is a technique that compares to radar images of the surface that are acquired at different times and calculates the ground motion that occurs in the direction of the satellite (usually at some angle from vertical) between the two times. The deformation is visualized as colored fringes, with more colored fringes meaning more ground motion. InSAR data that span October 2024 to October 2025 show a colorful “bullseye” in the area of the NUA. The data indicate about 2 centimeters (0.8 inches) of uplift, similar to what was measured by the semipermanent GPS station BRYL. InSAR data cannot penetrate significant snow cover, so it will not be possible to update interferograms of the Yellowstone area until spring/summer 2026.
Current monitoring data
The plots below show the east component of P711 since 2024 (upper plot), as well as the distance change between sites P711 and NRWY (lower plot), which span the area of uplift. Both plots will be updated regularly as new results are acquired and processed.
In the area of the uplift, there was a slight increase in seismicity during September-December 2025. During that time, over 200 earthquakes were located near the center of uplift, mostly during November. The largest event during this time period was M2.7 (there were 4 earthquakes in the M2 range). Overall, seismicity in the Yellowstone region during 2025 was low (1,119 located earthquakes) compared to typical rates (1,500-2,500 located earthquakes per year). The association between the earthquakes and the uplift is not clear, but the coincidence in timing suggests a link, probably because the uplift exerts small stresses on the surrounding rock.
What is the cause of the Norris Uplift Anomaly?
Ground deformation in the Yellowstone region can be caused by a variety of sources—changes in groundwater conditions, faulting, magma accumulation or withdrawal, cooling of subsurface fluids, and the accumulation and release of hydrothermal fluids, to name a few. In the case of the Norris Uplift Anomaly, the most likely cause is accumulation of magma. Mathematical modeling of the deformation indicates that the source is about 14 kilometers (9 miles) beneath the surface, which is deeper than would be expected for hydrothermal fluids. The shape of the deformation—a circular anomaly when viewed from above—is not what would be expected from faulting.
The area of the Norris Uplift Anomaly is also the only place in the Yellowstone region where long-period earthquakes have been recorded. Long-period (sometimes called low-frequency) earthquakes are gentler and more resonant than typical short-period earthquakes that are associated with breaking rock, and they are thought to result from fluids (water, gas, or magma) moving through cracks beneath the ground. Only two such earthquakes have ever been recorded at Yellowstone: one on August 16, 2021, about 16 kilometers (10 miles) beneath Norris Geyser Basin, and another on October 25, 2021, about 19 kilometers (12 miles) beneath the Gibbon Falls area. The location and depth of these two events is consistent with the depth of the Norris Uplift Anomaly deformation and support the presence of an active magmatic system in the area.
Should we be worried about a volcanic eruption?
No. This deformation is due to activity deep beneath the ground—well beneath the top of the magma chamber, which is about 3.8 kilometers (2.4 miles) beneath the surface. It is probably a common process in Yellowstone, but only in the past few decades has it been possible to detect such small deformation thanks to improvements in technology and monitoring networks.
Prior to any volcanic eruption, there would be dramatic increases in the rates of deformation and obvious shallowing of the deformation source, coupled with major increases in seismicity, as well as changes in gas emissions and thermal output. Yellowstone’s magma chamber is mostly solid, and a volcanic eruption is unlikely anytime soon. The most recent volcanic eruption occurred 70,000 years ago and was a lava flow that resulted in the formation of Pitchstone Plateau in the south part of Yellowstone National Park. The most likely geologic hazards on human timescales are strong tectonic earthquakes (like the M7.3 that occurred at Hebgen Lake in 1959) and hydrothermal explosions (like the July 23, 2024, explosion at Biscuit Basin).
When was the Norris Uplift Anomaly last active?
The first time the Norris Uplift Anomaly was detected was during 1996–2004, when the area rose by about 12 centimeters (4.7 inches). The deformation was recognized mostly from InSAR data because continuous GPS monitoring in the Yellowstone region was limited at that time. After 2004, the area subsided by about 7 centimeters (2.8 inches) and then was mostly inactive. During 2013–2020 there was uplift and subsidence closer to Norris Geyser Basin, but this deformation was related to the geyser basin itself and the accumulation and release of water at shallow levels.
InSAR data from September 2020 to September 2021 suggested that the Norris Uplift Anomaly had reactivated, but the signal was minor—only about 1 centimeter (0.4 inches). This deformation was too small to be obvious in any GPS data, and an interferogram from the following year (2021–2022) indicated that the area had subsided slightly. The interferograms showing this deformation can be found in the Yellowstone Volcano Observatory annual reports for 2021 and 2022.