Young Moose, Glacial Ridge National Wildlife Refuge
Young Moose, Glacial Ridge National Wildlife RefugeYoung moose near Benoit, Minnesota, Glacial Ridge National Wildlife Refuge

Official websites use .gov
A .gov website belongs to an official government organization in the United States.
Secure .gov websites use HTTPS
A lock () or https:// means you’ve safely connected to the .gov website. Share sensitive information only on official, secure websites.
Access all multimedia to include images, video, audio, webcams, before-after imagery, and more. Filter and explore with filtering options to refine search.

Young moose near Benoit, Minnesota, Glacial Ridge National Wildlife Refuge
Young moose near Benoit, Minnesota, Glacial Ridge National Wildlife Refuge

Earl Alstrom and Carol Hasburgh taking water quality samples near St. Mary’s, Alaska.
Earl Alstrom and Carol Hasburgh taking water quality samples near St. Mary’s, Alaska.

Photo Contest Winner | Nov. 2019 | Where We Work
Cattaraugus Creek near Springville, NY
Photo Contest Winner | Nov. 2019 | Where We Work
Cattaraugus Creek near Springville, NY

Northeast Region Photo Contest Winner | Sept 2019 | USGS at Work
Crawfish groundwater measurement
Northeast Region Photo Contest Winner | Sept 2019 | USGS at Work
Crawfish groundwater measurement
Summary: Scientists at EROS use tools like Landsat to produce land cover maps, which tell us if landscapes are rural or urban, cropped or forested, wetland or shrubland. Those maps help scientists at EROS and around the U.S. study the impact of changes in land use on not just landscapes, but on ecosystems, patterns of resource use, wildlife habitat, and much more.
Summary: Scientists at EROS use tools like Landsat to produce land cover maps, which tell us if landscapes are rural or urban, cropped or forested, wetland or shrubland. Those maps help scientists at EROS and around the U.S. study the impact of changes in land use on not just landscapes, but on ecosystems, patterns of resource use, wildlife habitat, and much more.

Northern Pintail Drake at Colusa National Wildlife Refuge
Northern Pintail Drake at Colusa National Wildlife Refuge

A closer view of the braided section of the Fissure 8 channel, with Highway 132 cutting across both branches. USGS photo by M. Zoeller.
A closer view of the braided section of the Fissure 8 channel, with Highway 132 cutting across both branches. USGS photo by M. Zoeller.

Building 1 formerly housed many different USGS groups, including the Western Coastal and Marine Geology team, but slowly has been leased out to other federal agencies like the Transportation Security Administration (TSA) and Veterans Affairs (VA). At the right is the Menlo Survey Federal Credit Union.
Building 1 formerly housed many different USGS groups, including the Western Coastal and Marine Geology team, but slowly has been leased out to other federal agencies like the Transportation Security Administration (TSA) and Veterans Affairs (VA). At the right is the Menlo Survey Federal Credit Union.

This photo looks north along the broad Fissure 8 channel. At its widest section, the Fissure 8 channel is about 430 meters (1400 feet wide). In the upper right section of the photo, Highway 132 can be seen cutting through the braided section of the channel. USGS photo by M. Zoeller.
This photo looks north along the broad Fissure 8 channel. At its widest section, the Fissure 8 channel is about 430 meters (1400 feet wide). In the upper right section of the photo, Highway 132 can be seen cutting through the braided section of the channel. USGS photo by M. Zoeller.

This timelapse sequence shows two hours of activity at the water pond in Halema‘uma‘u, at Kīlauea's summit. Flow is evident along the sharp orange color boundary in the center of the pond, as well as along portions of the shoreline. The pond is 189 m (650 ft) long. The vido was taken on the eastern rim.
This timelapse sequence shows two hours of activity at the water pond in Halema‘uma‘u, at Kīlauea's summit. Flow is evident along the sharp orange color boundary in the center of the pond, as well as along portions of the shoreline. The pond is 189 m (650 ft) long. The vido was taken on the eastern rim.

Building 3 on the USGS Western Region campus in Menlo Park, California.
Building 3 on the USGS Western Region campus in Menlo Park, California.

An overflight on December 18 provided aerial photographs of Kīlauea caldera, which were used to construct a 3D model. The water pond is visible in the deepest portion of Halema‘uma‘u crater. For scale, the water pond is 189 m (650 ft) long and approximately 600 m (1970 ft) below the western caldera rim.
An overflight on December 18 provided aerial photographs of Kīlauea caldera, which were used to construct a 3D model. The water pond is visible in the deepest portion of Halema‘uma‘u crater. For scale, the water pond is 189 m (650 ft) long and approximately 600 m (1970 ft) below the western caldera rim.

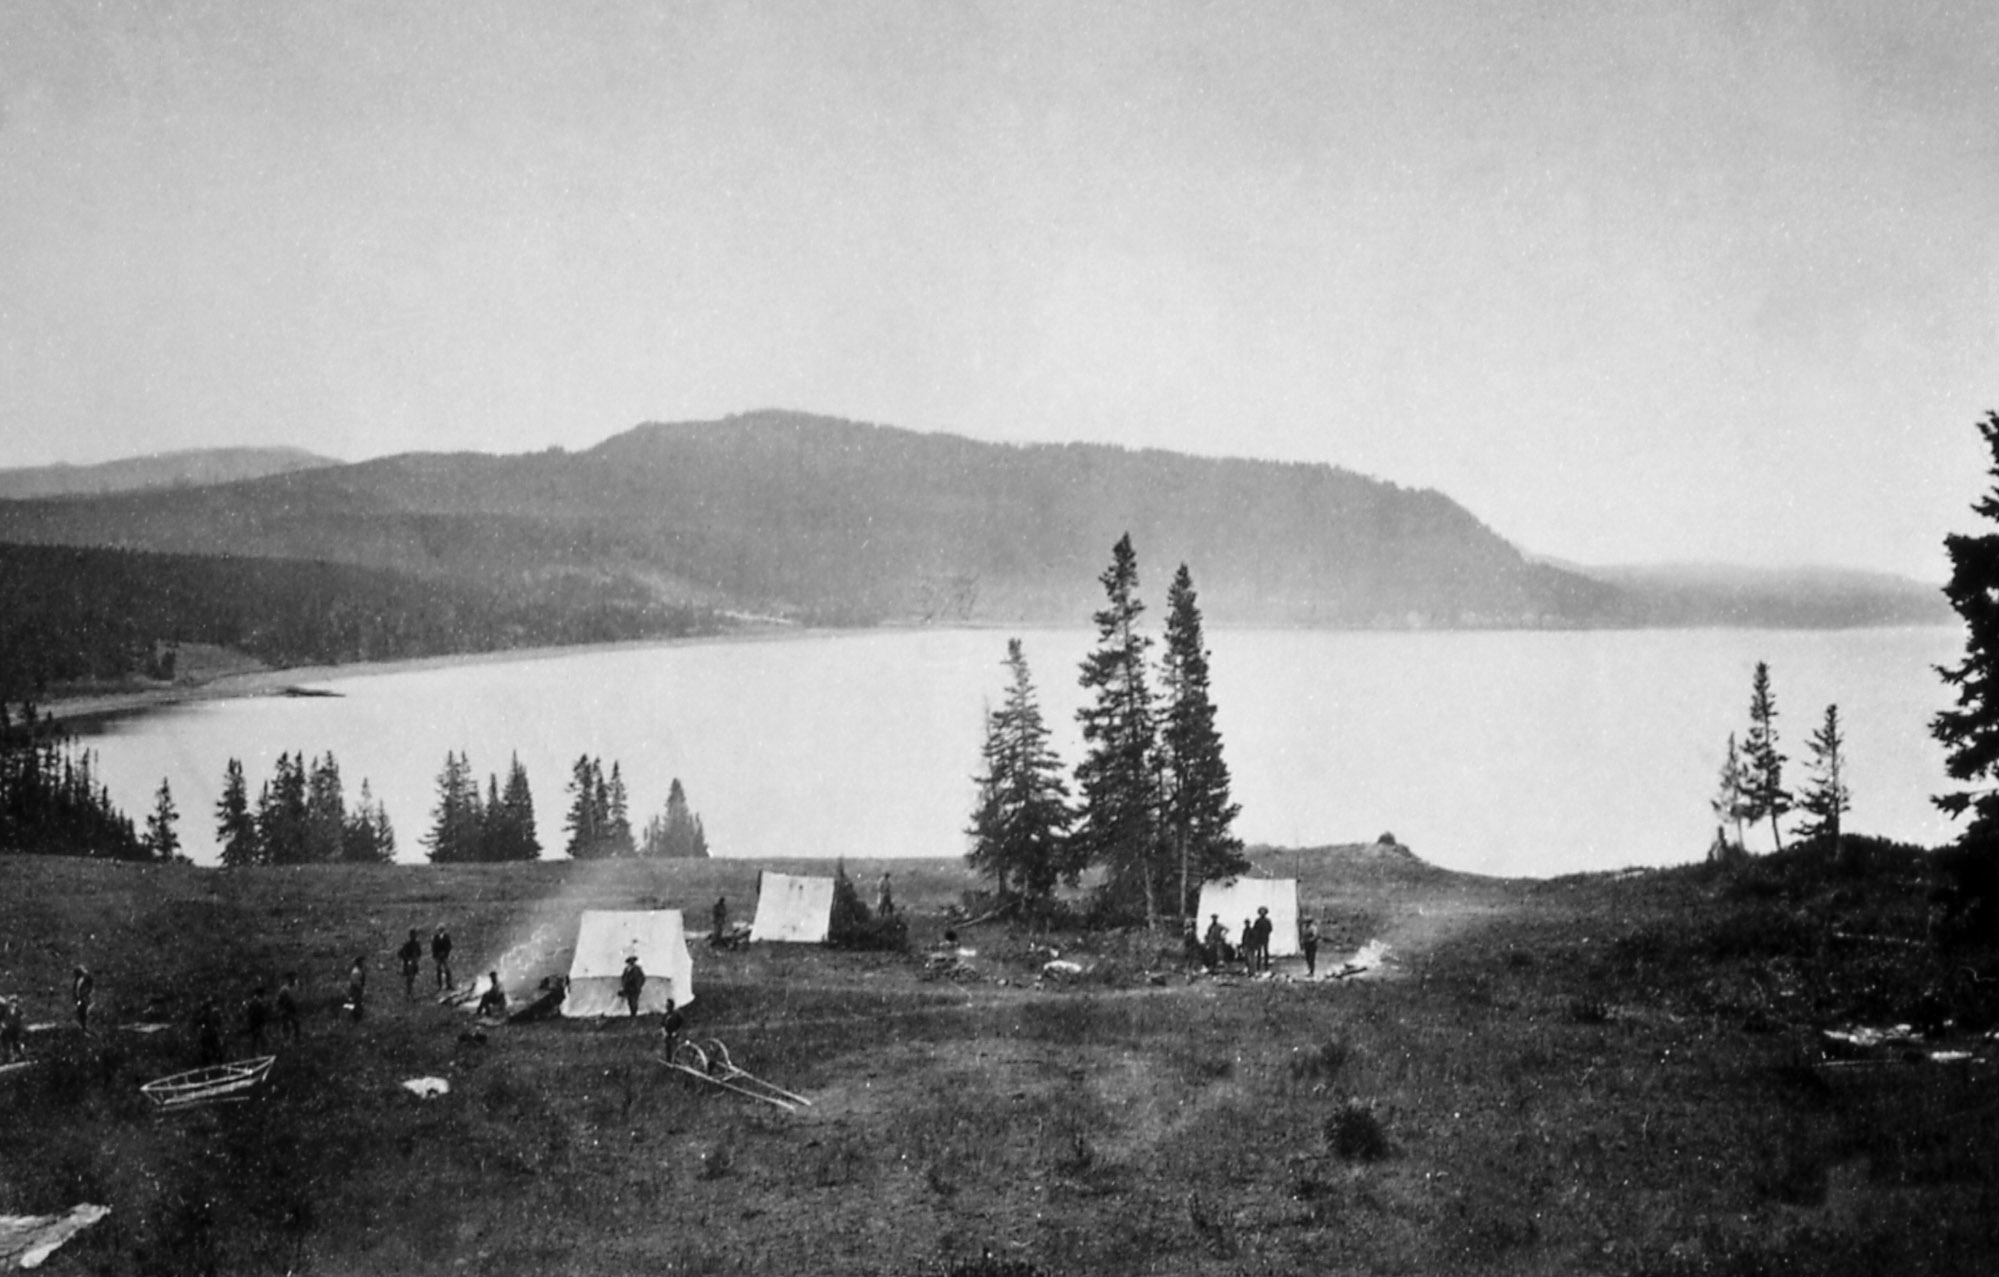
"Earthquake camp" of the Hayden expedition in 1871, located on the north shore of Yellowstone Lake near Steamboat Point. Photo by William H. Jackson, courtesy Yellowstone National Park (https://www.nps.gov/features/yell/slidefile/history/jacksonphotos/Image…).
"Earthquake camp" of the Hayden expedition in 1871, located on the north shore of Yellowstone Lake near Steamboat Point. Photo by William H. Jackson, courtesy Yellowstone National Park (https://www.nps.gov/features/yell/slidefile/history/jacksonphotos/Image…).

Dan Dzurisin, of the Cascades Volcano Observatory, conducting a leveling survey at Newberry Volcano, Oregon, in 2002.
Dan Dzurisin, of the Cascades Volcano Observatory, conducting a leveling survey at Newberry Volcano, Oregon, in 2002.

Flock of northern pintail flying at Yolo Bypass Wildlife Area
Flock of northern pintail flying at Yolo Bypass Wildlife Area

Flock of northern pintail flying at Yolo Bypass Wildlife Area
Flock of northern pintail flying at Yolo Bypass Wildlife Area

The smell of a fresh cut Christmas tree can evoke visions of majestic evergreen forests teeming with winter wildlife. In truth, more than half of U.S. Christmas trees come from farms in Oregon, North Carolina, or Michigan. Cut Christmas Trees area commodity, tracked by the U.S. Department of Agriculture just like corn or soybeans.
The smell of a fresh cut Christmas tree can evoke visions of majestic evergreen forests teeming with winter wildlife. In truth, more than half of U.S. Christmas trees come from farms in Oregon, North Carolina, or Michigan. Cut Christmas Trees area commodity, tracked by the U.S. Department of Agriculture just like corn or soybeans.

Jo Schmith examining ash from Katla volcano in Iceland.
Jo Schmith examining ash from Katla volcano in Iceland.

Lake Ontario view from the Queens Royal Park, Ontario, Canada
Lake Ontario view from the Queens Royal Park, Ontario, Canada

Earthquake hazard map showing peak ground accelerations having a 2 percent probability of being exceeded in 50 years, for a firm rock site. Black box outlines Yellowstone region. The map is based on the most recent USGS models for the conterminous U.S. (2018), Hawaii (1998), and Alaska (2007).
Earthquake hazard map showing peak ground accelerations having a 2 percent probability of being exceeded in 50 years, for a firm rock site. Black box outlines Yellowstone region. The map is based on the most recent USGS models for the conterminous U.S. (2018), Hawaii (1998), and Alaska (2007).

Graphic copy of a USGS-generated Brazos River inundation map.
Graphic copy of a USGS-generated Brazos River inundation map.
