
Chris Polloni, a retired scientist who had a long career with USGS, with Kate and Seth Ackerman at the Woods Hole Science Stroll. Chris was known to always have a coffee mug in his hand and today was no different!
Images
Coastal and Marine Hazards and Resources Program images.
Filter Total Items: 2413

Woods Hole Science Stroll 2024
Chris Polloni, a retired scientist who had a long career with USGS, with Kate and Seth Ackerman at the Woods Hole Science Stroll. Chris was known to always have a coffee mug in his hand and today was no different!
Woods Hole Science Stroll 2024
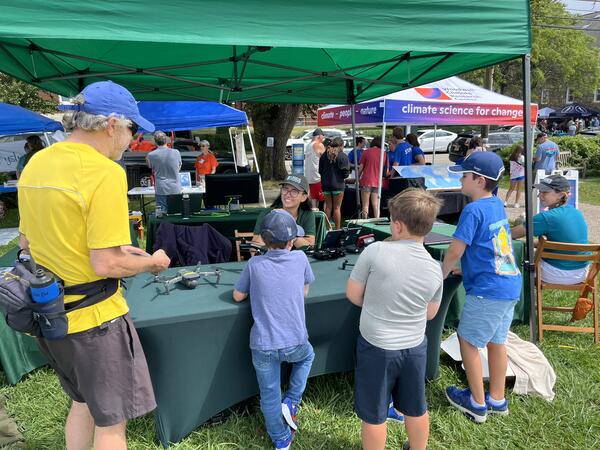
USGS Geographer Jin-Si Over talking about drones and how they are used to map short- and long-term changes in coastal environments at the Woods Hole Science Stroll.
USGS Geographer Jin-Si Over talking about drones and how they are used to map short- and long-term changes in coastal environments at the Woods Hole Science Stroll.

Woods Hole Science Stroll 2024
USGS geographer Jin-Si Over at the 2024 Woods Hole Science Stroll, ready to discuss drones and how they are used to map short- and long-term changes in coastal environments.
USGS geographer Jin-Si Over at the 2024 Woods Hole Science Stroll, ready to discuss drones and how they are used to map short- and long-term changes in coastal environments.

Woods Hole Science Stroll 2024
USGS Geographer Jen Cramer showing off our uncrewed aircraft system technology at the Woods Hole Science Stroll.
USGS Geographer Jen Cramer showing off our uncrewed aircraft system technology at the Woods Hole Science Stroll.

Woods Hole Science Stroll 2024
USGS Geologist Marie Bartlett at the 2024 Woods Hole Science Stroll, ready for visitors to look at foraminifera, microfossils that live in marine environments, through our microscope.
USGS Geologist Marie Bartlett at the 2024 Woods Hole Science Stroll, ready for visitors to look at foraminifera, microfossils that live in marine environments, through our microscope.

Woods Hole Science Stroll 2024
USGS Geographer Jin-Si Over at the 2024 Woods Hole Science Stroll holding one of our drones.
USGS Geographer Jin-Si Over at the 2024 Woods Hole Science Stroll holding one of our drones.

Puerto Rico beach
Scenic photo of Domes Beach in Rincon, Puerto Rico. Photo credit: Emily Himmelstoss.
Scenic photo of Domes Beach in Rincon, Puerto Rico. Photo credit: Emily Himmelstoss.

An antibiotic resistance gene (ARG) microarray in the Real-Time PCR (RT-PCR) machine
An antibiotic resistance gene (ARG) microarray in the Real-Time PCR (RT-PCR) machineAn antibiotic resistance gene (ARG) microarray in the Real-Time PCR (RT-PCR) machine.
An antibiotic resistance gene (ARG) microarray in the Real-Time PCR (RT-PCR) machine
An antibiotic resistance gene (ARG) microarray in the Real-Time PCR (RT-PCR) machineAn antibiotic resistance gene (ARG) microarray in the Real-Time PCR (RT-PCR) machine.

Native American shell middens along many coastlines are vulnerable to shoreline erosion
Native American shell middens along many coastlines are vulnerable to shoreline erosionThese shells are what remains of a Native American shell midden that is located along an actively eroding shoreline in Apalachicola Bay.

Estuarine shoreline erosion exposes a Native American shell midden
Estuarine shoreline erosion exposes a Native American shell middenEstuarine shoreline erosion exposes a Native American shell midden beneath the surface of a coastal flatwood forest. Shell middens are the discarded shells and materials from generations of Indigenous people who lived along U.S. coastlines.

Native American pottery shards
Two shards of Native American pottery found at shell midden site that is located on an actively eroding shoreline of Apalachicola Bay. The shards show distinctive markings created by paleo Indians thousands of years ago.
Two shards of Native American pottery found at shell midden site that is located on an actively eroding shoreline of Apalachicola Bay. The shards show distinctive markings created by paleo Indians thousands of years ago.

Rock breakwaters are used to protect marsh shoreline from erosion
Rock breakwaters are used to protect marsh shoreline from erosionThe estuarine shoreline of barrier islands along the Gulf of America are vulnerable to shoreline erosion. Structures, such as this rock breakwater, can be used to protect the shoreline from erosional waves.

Backbarrier coastline of St. George Island
The estuarine (backbarrier) shoreline of barrier islands in Gulf of America are complex, ecologically diverse habitats that are under threat due to human development, sea level rise, and storms.
The estuarine (backbarrier) shoreline of barrier islands in Gulf of America are complex, ecologically diverse habitats that are under threat due to human development, sea level rise, and storms.

Native American shell midden is exposed to erosion from sea level rise and storms
Native American shell midden is exposed to erosion from sea level rise and stormsFlorida archaeologist, Nicole Grinnan, talks about the vulnerability of Native American shell middens to coastal erosion from sea level rise and storms along the Apalachicola Bay.

Screenshot of CoastSeg interface
Screenshot of CoastSeg interface, from the study CoastSeg: an accessible and extendable hub for satellite-derived-shoreline (SDS) detection and mapping.
Screenshot of CoastSeg interface, from the study CoastSeg: an accessible and extendable hub for satellite-derived-shoreline (SDS) detection and mapping.

Satellite-derived shorelines for a barrier island east of Moses Point Fishing Village, Norton Sound, Alaska
Satellite-derived shorelines for a barrier island east of Moses Point Fishing Village, Norton Sound, AlaskaSatellite-derived shorelines for a barrier island east of Moses Point Fishing Village, Norton Sound, Alaska, from the study CoastSeg: an accessible and extendable hub for satellite-derived-shoreline (SDS) detection and mapping.

Satellite images of barrier island near Moses Point Fishing Village, taken in 1986 and 2023
Satellite images of barrier island near Moses Point Fishing Village, taken in 1986 and 2023Satellite images of barrier island near Moses Point Fishing Village, Norton Sound, Alaska, taken in 1986 and 2023.
Satellite images of barrier island near Moses Point Fishing Village, taken in 1986 and 2023
Satellite images of barrier island near Moses Point Fishing Village, taken in 1986 and 2023Satellite images of barrier island near Moses Point Fishing Village, Norton Sound, Alaska, taken in 1986 and 2023.

USGS Coastal Change Hazards Portal shows Hurricane Beryl's expected impacts
USGS Coastal Change Hazards Portal shows Hurricane Beryl's expected impactsPotential coastal change impacts are predicted during a direct landfall of Hurricane Beryl on the Texas coast at 4:00 am, Sunday, July 7, 2024.
USGS Coastal Change Hazards Portal shows Hurricane Beryl's expected impacts
USGS Coastal Change Hazards Portal shows Hurricane Beryl's expected impactsPotential coastal change impacts are predicted during a direct landfall of Hurricane Beryl on the Texas coast at 4:00 am, Sunday, July 7, 2024.

Mapping Nantucket Sound
USGS Marine Operations Manager Chuck Worley conducting fieldwork to study the geologic framework of Nantucket Sound.
USGS Marine Operations Manager Chuck Worley conducting fieldwork to study the geologic framework of Nantucket Sound.

U.S. Coastal Wetland Synthesis Applications Webpage Image
U.S. Coastal Wetland Synthesis Applications Webpage ImageThe USGS is assessing the physical condition of coastal wetlands and their response to external forces, using field observations and remote-sensing data. The U.S.
U.S. Coastal Wetland Synthesis Applications Webpage Image
U.S. Coastal Wetland Synthesis Applications Webpage ImageThe USGS is assessing the physical condition of coastal wetlands and their response to external forces, using field observations and remote-sensing data. The U.S.

Distinguished Service Award - Curt Storlazzi
Distinguished Service Award for Research Geologist Curt Storlazzi, presented on May 8, 2024.
Distinguished Service Award for Research Geologist Curt Storlazzi, presented on May 8, 2024.