
Distinguished Service Award for USGS Research Geophysicist Carolyn Ruppel, presented on May 8, 2024.
Images
Coastal and Marine Hazards and Resources Program images.
Filter Total Items: 2413

Distinguished Service Award - Carolyn Ruppel
Distinguished Service Award for USGS Research Geophysicist Carolyn Ruppel, presented on May 8, 2024.

Honorees pose with their awards at the 77th DOI Honor Awards Convocation
Honorees pose with their awards at the 77th DOI Honor Awards ConvocationHonorees pose with their awards at the 77th DOI Honor Awards Convocation on May 8, 2024.
Honorees pose with their awards at the 77th DOI Honor Awards Convocation
Honorees pose with their awards at the 77th DOI Honor Awards ConvocationHonorees pose with their awards at the 77th DOI Honor Awards Convocation on May 8, 2024.

Map of U.S. Extended Continental Shelf Regions
The United States has ECS in seven offshore areas: the Arctic, Atlantic (east coast), Bering Sea, Pacific (west coast), Mariana Islands, and two areas in the Gulf of America. The U.S. ECS area is approximately one million square kilometers – an area about twice the size of California.
The United States has ECS in seven offshore areas: the Arctic, Atlantic (east coast), Bering Sea, Pacific (west coast), Mariana Islands, and two areas in the Gulf of America. The U.S. ECS area is approximately one million square kilometers – an area about twice the size of California.

Overview map of the Mississippi River delta
Overview map of the Mississippi River delta showing subaerial birdfoot morphology formed by distributaries.
Overview map of the Mississippi River delta showing subaerial birdfoot morphology formed by distributaries.

In transit to survey the shallows of Wallops Island, Virginia
In transit to survey the shallows of Wallops Island, VirginiaSabrina Levinson, a USGS intern on the Coastal Sediment Availability and Flux Project (St. Petersburg Coastal and Marine Science Center), pilots a survey waverunner to the shallows of Wallops Island, Virginia.
Collecting Shoreline and Volumetric Data
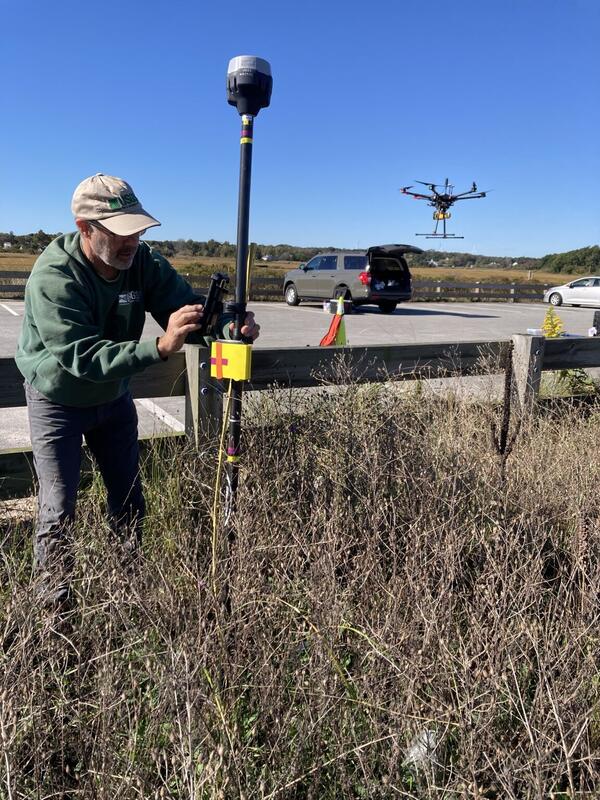
From June through December, WHCMSC scientists are collecting shoreline and volumetric data at a beach in Sandwich, Massachusetts following a 2023 U.S. Army Corps of Engineers beach nourishment. The data will be useful for various purposes. Chris Sherwood is interested in comparing how the different measuring techniques work on different types of vegetation.
From June through December, WHCMSC scientists are collecting shoreline and volumetric data at a beach in Sandwich, Massachusetts following a 2023 U.S. Army Corps of Engineers beach nourishment. The data will be useful for various purposes. Chris Sherwood is interested in comparing how the different measuring techniques work on different types of vegetation.

Map of study area showing the Sur Pockmark Field offshore of central California
Map of study area showing the Sur Pockmark Field offshore of central CaliforniaLocation Map showing the Sur Pockmark Field outlined in green, individual pockmarks are shown as small red dots. This study focuses on the largest section of the pockmark field, from the Lucia Chica Channel down to the San Simeon Channel. AUV surveys are outlined in white and the offshore wind commercial leases are outlined in gray.

Diagram showing patterns of erosion and deposition that produce seafloor pockmarks
Diagram showing patterns of erosion and deposition that produce seafloor pockmarksA diagram illustrating how the patterns of erosion and deposition associated with three sediment gravity flows could produce the stacked pockmarks and lateral migration observed in AUV-collected Chirp profiles. Long, uneventful episodes of hemipelagic drape (a, d, g, j) are intermittently interrupted by sediment gravity flows that either: 1b.

Ernest F. Hollings ACE Basin National Wildlife Refuge
Ernest F. Hollings ACE Basin National Wildlife RefugeErnest F. Hollings ACE Basin National Wildlife Refuge in South Carolina shown in the pop-out of the U.S. Coastal Wetlands Synthesis Applications geonarrative.
Ernest F. Hollings ACE Basin National Wildlife Refuge
Ernest F. Hollings ACE Basin National Wildlife RefugeErnest F. Hollings ACE Basin National Wildlife Refuge in South Carolina shown in the pop-out of the U.S. Coastal Wetlands Synthesis Applications geonarrative.

Detail of sediment core with tidal silt, tsunami sand, and marsh peat collected from the Salmon River estuary, Oregon.
Detail of sediment core with tidal silt, tsunami sand, and marsh peat collected from the Salmon River estuary, Oregon.Sediment core with tidal silt, tsunami sand, and marsh peat collected from the Salmon River estuary, Oregon.

Ernest F. Hollings ACE Basin National Wildlife Refuge
Ernest F. Hollings ACE Basin National Wildlife RefugeErnest F. Hollings ACE Basin National Wildlife Refuge in South Carolina shown in the pop-out of the U.S. Coastal Wetlands Synthesis Applications geonarrative.
Ernest F. Hollings ACE Basin National Wildlife Refuge
Ernest F. Hollings ACE Basin National Wildlife RefugeErnest F. Hollings ACE Basin National Wildlife Refuge in South Carolina shown in the pop-out of the U.S. Coastal Wetlands Synthesis Applications geonarrative.

Researchers who conducted prior paleotsunami research at Salmon River estuary, Oregon
Researchers who conducted prior paleotsunami research at Salmon River estuary, OregonResearchers Brian Atwater and Wendy Grant Walter conducting prior paleotsunami research at Salmon River estuary, Oregon.
Researchers who conducted prior paleotsunami research at Salmon River estuary, Oregon
Researchers who conducted prior paleotsunami research at Salmon River estuary, OregonResearchers Brian Atwater and Wendy Grant Walter conducting prior paleotsunami research at Salmon River estuary, Oregon.

Sediment core with tsunami deposit from the Salmon River estuary, Oregon
Sediment core with tsunami deposit from the Salmon River estuary, OregonSediment core with tidal silt, tsunami sand, and marsh peat collected from the Salmon River estuary, Oregon.
Sediment core with tsunami deposit from the Salmon River estuary, Oregon
Sediment core with tsunami deposit from the Salmon River estuary, OregonSediment core with tidal silt, tsunami sand, and marsh peat collected from the Salmon River estuary, Oregon.

USGS scientists SeanPaul La Selle and Jason Padgett collecting sediment cores at the Salmon River estuary, Oregon
USGS scientists SeanPaul La Selle and Jason Padgett collecting sediment cores at the Salmon River estuary, OregonUSGS scientists SeanPaul La Selle and Jason Padgett collecting sediment cores at the Salmon River estuary, Oregon.

Diagram showing land subsidence and sand deposit following tsunami
Diagram showing land subsidence and sand deposit following tsunamiDiagram showing the sequence of land subsidence during an earthquake, followed with sand deposited by a tsunami.
Diagram showing land subsidence and sand deposit following tsunami
Diagram showing land subsidence and sand deposit following tsunamiDiagram showing the sequence of land subsidence during an earthquake, followed with sand deposited by a tsunami.

Map showing location of Salmon River estuary, Oregon
Map showing location of Salmon River estuary, OregonMap showing location of Salmon River estuary, Oregon. Yellow dots represent estuaries, lagoons, and lakes with evidence of the 1700 tsunami.
Map showing location of Salmon River estuary, Oregon
Map showing location of Salmon River estuary, OregonMap showing location of Salmon River estuary, Oregon. Yellow dots represent estuaries, lagoons, and lakes with evidence of the 1700 tsunami.

View of Salmon River estuary, Oregon, from above
View of Salmon River estuary, Oregon, from above. Sediment cores were collected from marshland toward the upper left of the image.
View of Salmon River estuary, Oregon, from above. Sediment cores were collected from marshland toward the upper left of the image.

Southeast Region Refuges
The Southeast Region Refuges tab of the U.S. Coastal Wetlands Synthesis Applications geonarrative. A FWS and USGS collaboration.
The Southeast Region Refuges tab of the U.S. Coastal Wetlands Synthesis Applications geonarrative. A FWS and USGS collaboration.

U.S. Coastal Wetland Synthesis Applications geonarrative
U.S. Coastal Wetland Synthesis Applications geonarrativeThe U.S. Coastal Wetlands Synthesis Applications geonarrative. The U.S. Geological Survey (USGS) is assessing the physical condition of coastal wetlands and how they may change in response to storms, sea-level rise, and human activity.

Animated GIF of Cascadia 1700 tsunami simulation at Salmon River, Oregon
Animated GIF of Cascadia 1700 tsunami simulation at Salmon River, OregonAnimated GIF of Cascadia 1700 tsunami simulation at Salmon River, Oregon. Colored dots are locations where sediment cores were collected.
Animated GIF of Cascadia 1700 tsunami simulation at Salmon River, Oregon
Animated GIF of Cascadia 1700 tsunami simulation at Salmon River, OregonAnimated GIF of Cascadia 1700 tsunami simulation at Salmon River, Oregon. Colored dots are locations where sediment cores were collected.

Image of drone with infrared camera on a beach in American Samoa
Image of drone with infrared camera on a beach in American SamoaDrone used to collect infrared imagery of reefs in the National Park of American Samoa on Ofu.
Image of drone with infrared camera on a beach in American Samoa
Image of drone with infrared camera on a beach in American SamoaDrone used to collect infrared imagery of reefs in the National Park of American Samoa on Ofu.