
An introductory course for small uncrewed aircraft system (sUAS) pilots was held at the New York State Emergency Preparedness Training Facility in Oriskany, New York. Instructors from across the country, including Sandy Brosnahan (lead instructor) and Seth Ackerman of the USGS WHCMSC, collaborated to deliver the training.
Images
Coastal and Marine Hazards and Resources Program images.
Filter Total Items: 2415
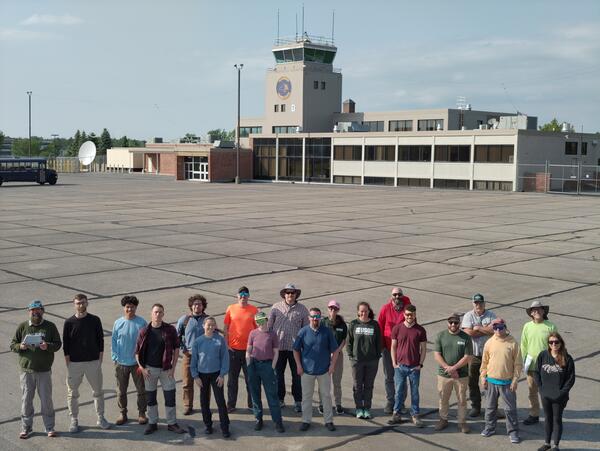
Drone pilot course
An introductory course for small uncrewed aircraft system (sUAS) pilots was held at the New York State Emergency Preparedness Training Facility in Oriskany, New York. Instructors from across the country, including Sandy Brosnahan (lead instructor) and Seth Ackerman of the USGS WHCMSC, collaborated to deliver the training.

Secrets of the Seep documentary
WFSU produced a documentary covering a research cruise offshore Oregon to Astoria Canyon (2023) and smaller campaigns to the Hydrate Ridge seep system (2024) to study the cycling dynamics of dissolved organic matter at methane seeps.
WFSU produced a documentary covering a research cruise offshore Oregon to Astoria Canyon (2023) and smaller campaigns to the Hydrate Ridge seep system (2024) to study the cycling dynamics of dissolved organic matter at methane seeps.

USGS Long Island Sound Webinar
The USGS hosted a webinar highlighting new USGS tools developed for use in Long Island Sound.
The USGS hosted a webinar highlighting new USGS tools developed for use in Long Island Sound.

Diagram of horizontal levee and map showing study area in SF Bay
Diagram of horizontal levee and map showing study area in SF BayDepiction of a horizontal levee (A) and study location in San Francisco Bay, CA(B and C). Transects used in the hydrodynamic simulations are shown by the white lines in (C).

Long Island Sound SEABOSS Survey
A seafloor mapping survey in Long Island Sound took place in May with collaborators from the University of Connecticut and the University of New Haven. They are mapping the area’s geology and biota to identify seasonal changes from their previous survey in November 2024.
A seafloor mapping survey in Long Island Sound took place in May with collaborators from the University of Connecticut and the University of New Haven. They are mapping the area’s geology and biota to identify seasonal changes from their previous survey in November 2024.

Coastal Landscape Response
The Coastal Landscape Response assessment creates multidecadal predictions of where and when the coast is likely to adapt or inundate. Results are produced for four decades—the 2020s, 2030s, 2050s, and 2080s.
The Coastal Landscape Response assessment creates multidecadal predictions of where and when the coast is likely to adapt or inundate. Results are produced for four decades—the 2020s, 2030s, 2050s, and 2080s.

CCL Outcomes for Wallops Joint Expeditionary Base
USGS Coastal Change Likelihood (CCL) outcomes are displayed for Wallops Joint Expeditionary Base in Virginia. Warm colors indicate areas of high expected coastal change and cool colors indicate areas with lower expected change.
USGS Coastal Change Likelihood (CCL) outcomes are displayed for Wallops Joint Expeditionary Base in Virginia. Warm colors indicate areas of high expected coastal change and cool colors indicate areas with lower expected change.
Long Island Sound SEABOSS Survey
A seafloor mapping survey in Long Island Sound took place in May with collaborators from the University of Connecticut and the University of New Haven. They are mapping the area’s geology and biota to identify seasonal changes from their previous survey in November 2024.
A seafloor mapping survey in Long Island Sound took place in May with collaborators from the University of Connecticut and the University of New Haven. They are mapping the area’s geology and biota to identify seasonal changes from their previous survey in November 2024.
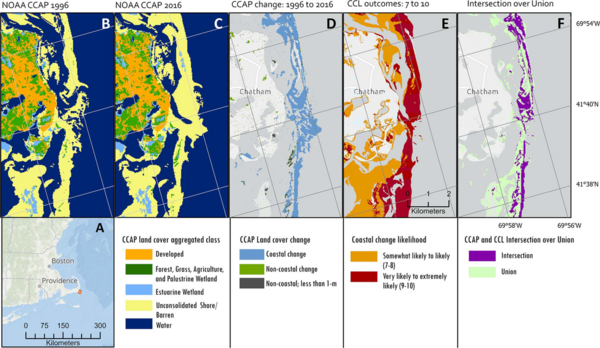
CCL accuracy journal article figure
(A) Inset: Map showing location of (B–F). (B), (C) The C-CAP land cover for 1996 and 2016, respectively. (D) Land cover in the C-CAP datasets changed for coastal, noncoastal and low elevation (less than 1 m), and noncoastal land classes between 1996 and 2016.
(A) Inset: Map showing location of (B–F). (B), (C) The C-CAP land cover for 1996 and 2016, respectively. (D) Land cover in the C-CAP datasets changed for coastal, noncoastal and low elevation (less than 1 m), and noncoastal land classes between 1996 and 2016.

Collage of Conceição-Duquesa beach oblique images with high-water line and prominent structures marked
Collage of Conceição-Duquesa beach oblique images with high-water line and prominent structures markedCollage of Conceição-Duquesa beach oblique images with high-water line and prominent structures marked. From the study Historical Coast Snaps: Using Centennial Imagery to Track Shoreline Change.

Satellite image showing validation high-water lines for Conceição-Duquesa beach
Satellite image showing validation high-water lines for Conceição-Duquesa beachSatellite image showing validation high-water lines for Conceição-Duquesa beach. From the study Historical Coast Snaps: Using Centennial Imagery to Track Shoreline Change.

Floodplain maps and bar graphs depicting the expansion of floodplain after earthquake driven subsidence
Floodplain maps and bar graphs depicting the expansion of floodplain after earthquake driven subsidenceFloodplain maps and bar graphs depicting the expansion of the 1% floodplain after earthquake-driven subsidence today (2023) and in 2100 when the earthquake-driven subsidence is amplified by climate-driven sea-level rise for the (A) Necanicum River, OR; (B) Yaquina Bay, OR; (C) Alsea Bay, OR; and (D) Humboldt Bay, CA.
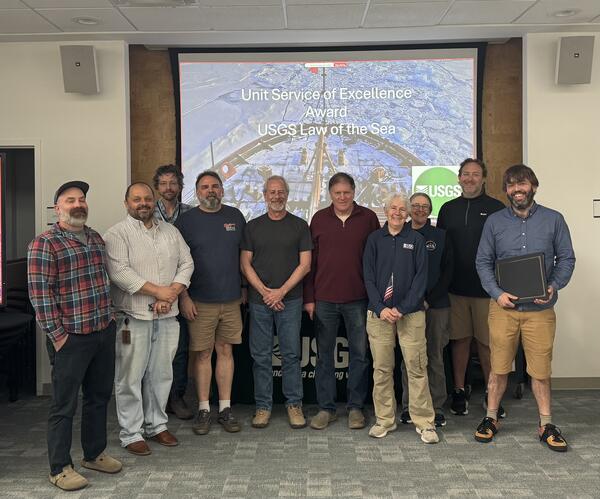
USGS Unit Award for Excellence of Service
The Extended Continental Shelf team was awarded the USGS Unit Award for Excellence of Service, an award that recognizes groups of employees who have worked together as a unit to achieve exceptional results. This team was part of a Federal interagency effort to identify the outer limits of the U.S.
The Extended Continental Shelf team was awarded the USGS Unit Award for Excellence of Service, an award that recognizes groups of employees who have worked together as a unit to achieve exceptional results. This team was part of a Federal interagency effort to identify the outer limits of the U.S.
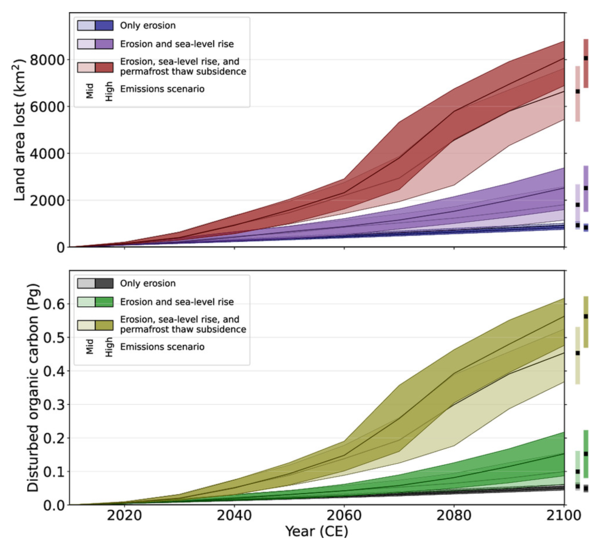
Projected 21st-century land loss and organic carbon disturbance on Alaska’s Arctic Coastal Plain
Projected 21st-century land loss and organic carbon disturbance on Alaska’s Arctic Coastal PlainProjected 21st-century land loss and organic carbon disturbance on Alaska’s Arctic Coastal Plain. From the study Permafrost thaw subsidence, sea-level rise, and erosion are transforming Alaska’s Arctic coastal zone.

Great earthquakes in the 20th century along the Aleutian Arc
Great earthquakes in the 20th century along the Aleutian ArcGreat earthquakes in the 20th century. Inset numbers over the 3 by 12 grid indicate subfaults with large slip in meters from the updated 1957 rupture model with red and blue tones for shallow and deeper megathrust rupture, respectively.
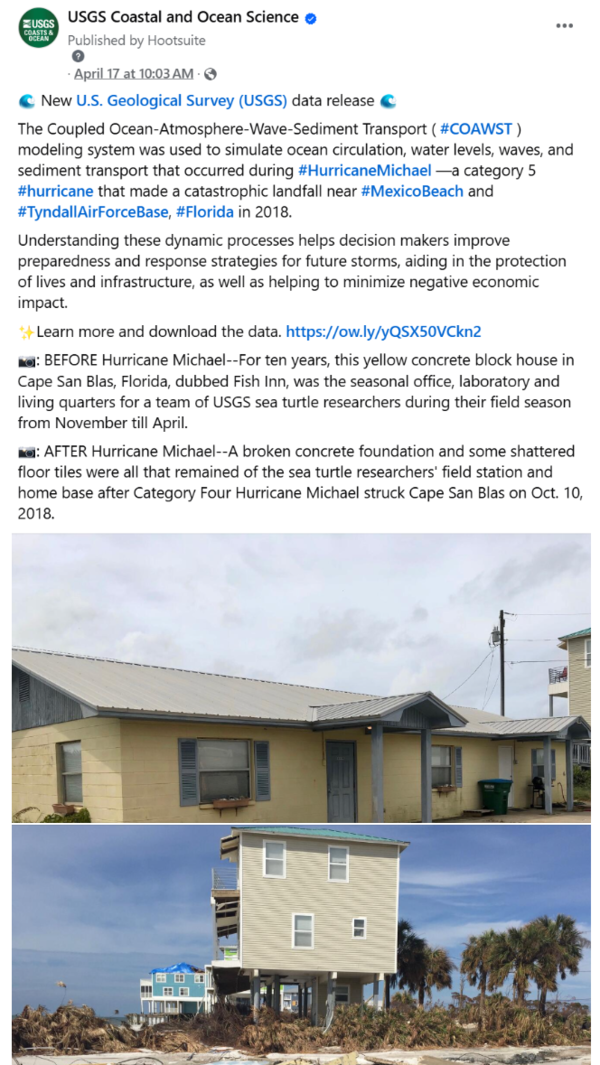
COAWST data release social media post
Social media post on USGS Coastal and Ocean Science Facebook page highlighting COAWST data release.
Warner, J.C., 2025, U.S. Geological Survey simulations of hydrodynamics and morphodynamics during Hurricane Michael (2018): U.S. Geological Survey data release, https://doi.org/10.5066/P14AGJAN.
Social media post on USGS Coastal and Ocean Science Facebook page highlighting COAWST data release.
Warner, J.C., 2025, U.S. Geological Survey simulations of hydrodynamics and morphodynamics during Hurricane Michael (2018): U.S. Geological Survey data release, https://doi.org/10.5066/P14AGJAN.
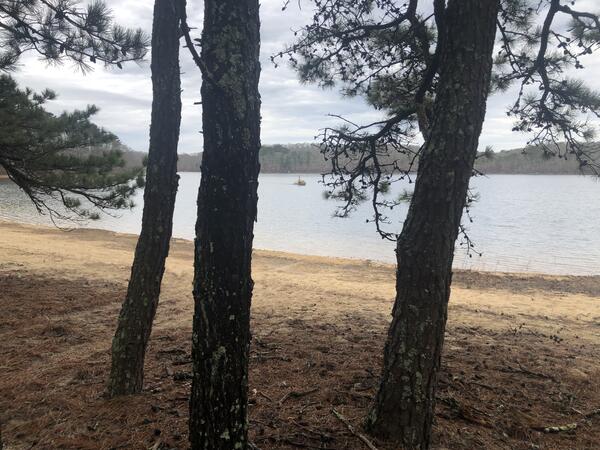
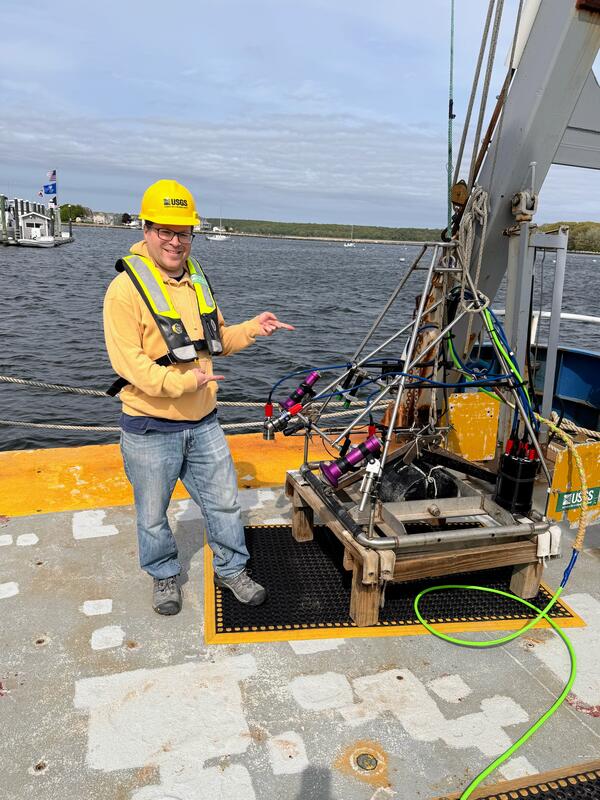
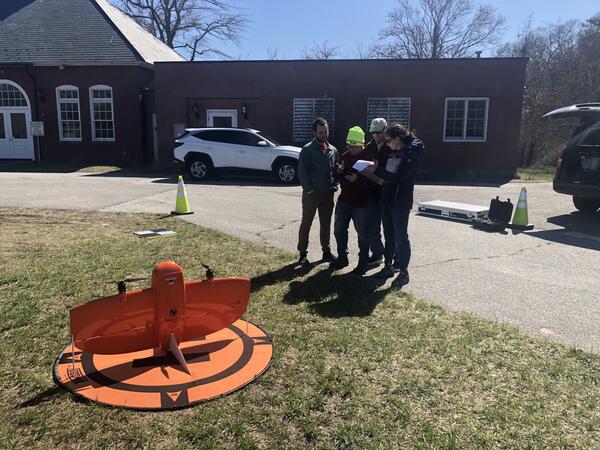
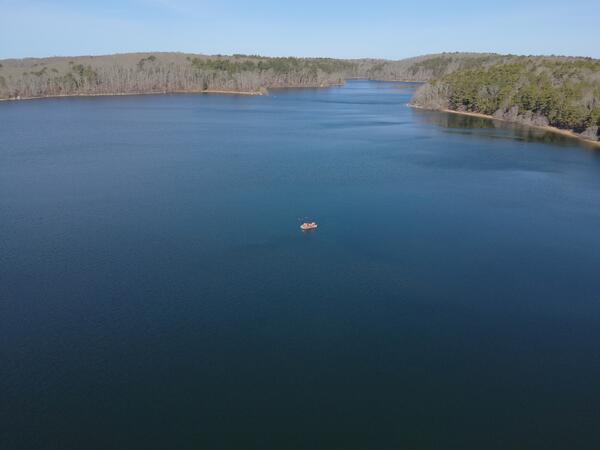
Long Pond mapping survey
USGS conducted a mapping survey of Long Pond in Falmouth, Massachusetts, at the request of the Town to determine total water volume of the reservoir, as well as the volumes available depending on fluctuating elevations of the water surface.
USGS conducted a mapping survey of Long Pond in Falmouth, Massachusetts, at the request of the Town to determine total water volume of the reservoir, as well as the volumes available depending on fluctuating elevations of the water surface.