Elevation data collected from a personal water craft
Elevation data collected from a personal water craftUSGS scientist collects elevation data from a personal water craft at Madeira Beach, FL.

Official websites use .gov
A .gov website belongs to an official government organization in the United States.
Secure .gov websites use HTTPS
A lock () or https:// means you’ve safely connected to the .gov website. Share sensitive information only on official, secure websites.
Coastal and Marine Hazards and Resources Program images.

USGS scientist collects elevation data from a personal water craft at Madeira Beach, FL.
USGS scientist collects elevation data from a personal water craft at Madeira Beach, FL.

Social media post on USGS Coastal and Ocean Science Facebook account. The post is one in a series of Software Sunday posts highlighting downloadable software in the Coastal Science Navigator.
Social media post on USGS Coastal and Ocean Science Facebook account. The post is one in a series of Software Sunday posts highlighting downloadable software in the Coastal Science Navigator.

Social media post on USGS Coastal and Ocean Science Facebook account. The post is one in a series of Valentine's Day posts highlighting USGS coastal and ocean science.
Social media post on USGS Coastal and Ocean Science Facebook account. The post is one in a series of Valentine's Day posts highlighting USGS coastal and ocean science.

Gerry Hatcher discussing BOBSled technology to help inform the development of SEABOSS 3.0.
Gerry Hatcher discussing BOBSled technology to help inform the development of SEABOSS 3.0.

Scientists and technicians from the Woods Hole Coastal and Marine Science Center (WHCMSC) in Woods Hole, Massachusetts traveled to the Pacific Coastal and Marine Science Center (PCMSC) in Santa Cruz, California to learn about their seafloor imaging and sampling instrument—the Benthic Observation camera Sled, or BOBSled.
Scientists and technicians from the Woods Hole Coastal and Marine Science Center (WHCMSC) in Woods Hole, Massachusetts traveled to the Pacific Coastal and Marine Science Center (PCMSC) in Santa Cruz, California to learn about their seafloor imaging and sampling instrument—the Benthic Observation camera Sled, or BOBSled.

Scientists and technologists from the Woods Hole Coastal and Marine Science Center (WHCMSC) in Woods Hole, Massachusetts traveled to the Pacific Coastal and Marine Science Center (PCMSC) in Santa Cruz, California to learn about their seafloor imaging and sampling instrument—the Benthic Observation camera Sled, or BOBSled.
Scientists and technologists from the Woods Hole Coastal and Marine Science Center (WHCMSC) in Woods Hole, Massachusetts traveled to the Pacific Coastal and Marine Science Center (PCMSC) in Santa Cruz, California to learn about their seafloor imaging and sampling instrument—the Benthic Observation camera Sled, or BOBSled.

Social media post on USGS Coastal and Ocean Science Facebook account. The post highlights an article about USGS products that can be used for emergency management. https://www.usgs.gov/programs/cmhrp/news/approaching-storms
Social media post on USGS Coastal and Ocean Science Facebook account. The post highlights an article about USGS products that can be used for emergency management. https://www.usgs.gov/programs/cmhrp/news/approaching-storms
Scientists and technologists from the Woods Hole Coastal and Marine Science Center (WHCMSC) in Woods Hole, Massachusetts traveled to the Pacific Coastal and Marine Science Center (PCMSC) in Santa Cruz, California to learn about their seafloor imaging and sampling instrument—the Benthic Observation camera Sled, or BOBSled.
Scientists and technologists from the Woods Hole Coastal and Marine Science Center (WHCMSC) in Woods Hole, Massachusetts traveled to the Pacific Coastal and Marine Science Center (PCMSC) in Santa Cruz, California to learn about their seafloor imaging and sampling instrument—the Benthic Observation camera Sled, or BOBSled.

In collaboration with the Woods Hole Oceanographic Institution and Old Dominion University, we are assessing winter hydrological, thermal, and biogeochemical processes occurring in North Atlantic salt marshes across a latitudinal gradient for improved annual estimates of water and organic matter outwelling to the coastal ocean.
In collaboration with the Woods Hole Oceanographic Institution and Old Dominion University, we are assessing winter hydrological, thermal, and biogeochemical processes occurring in North Atlantic salt marshes across a latitudinal gradient for improved annual estimates of water and organic matter outwelling to the coastal ocean.

Scientists and technologists from the Woods Hole Coastal and Marine Science Center (WHCMSC) in Woods Hole, Massachusetts traveled to the Pacific Coastal and Marine Science Center (PCMSC) in Santa Cruz, California to learn about their seafloor imaging and sampling instrument—the Benthic Observation camera Sled, or BOBSled.
Scientists and technologists from the Woods Hole Coastal and Marine Science Center (WHCMSC) in Woods Hole, Massachusetts traveled to the Pacific Coastal and Marine Science Center (PCMSC) in Santa Cruz, California to learn about their seafloor imaging and sampling instrument—the Benthic Observation camera Sled, or BOBSled.

The inner workings of the BOBSled bottle.
The inner workings of the BOBSled bottle.
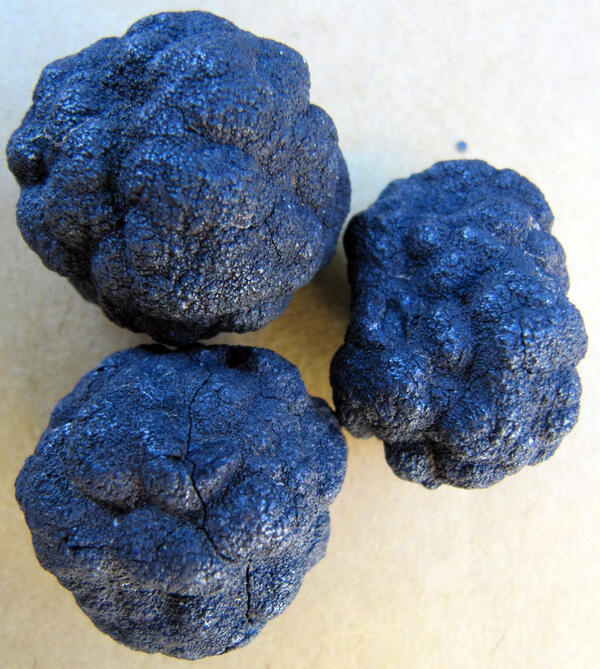
Ferromanganese nodules collected from the Clariton-Clipperton Zone during a USGS research expedition.
Ferromanganese nodules collected from the Clariton-Clipperton Zone during a USGS research expedition.
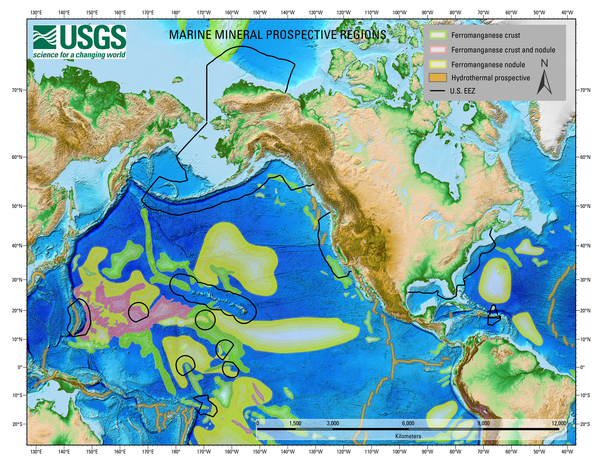
A map showing Global Marine Mineral Prospective Regions, including those that occur within the United States Exclusive Economic Zone.
A map showing Global Marine Mineral Prospective Regions, including those that occur within the United States Exclusive Economic Zone.
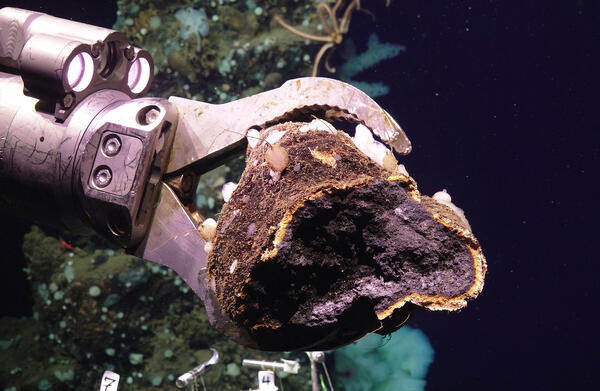
A remotely operated vehicle collects a polymetallic sulfide sample from Escanaba Trough.
A remotely operated vehicle collects a polymetallic sulfide sample from Escanaba Trough.

A seafloor massive sulfide at Escanaba Trough covered with sponges, shrimp, squat lobsters, and other deep-sea fauna.
A seafloor massive sulfide at Escanaba Trough covered with sponges, shrimp, squat lobsters, and other deep-sea fauna.
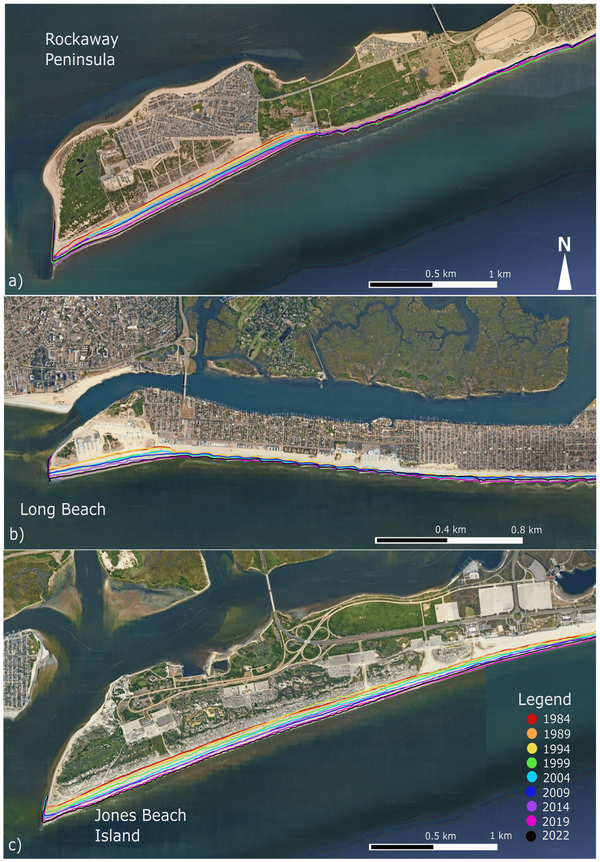
Western ends of each site showing the overall accretion using QGIS. See legend for color corresponding dates. The first continuous shoreline for each respective year was used for the visualization. (a) Rockaway Peninsula, (b) Long Beach, (c) Jones Beach Island.
Western ends of each site showing the overall accretion using QGIS. See legend for color corresponding dates. The first continuous shoreline for each respective year was used for the visualization. (a) Rockaway Peninsula, (b) Long Beach, (c) Jones Beach Island.
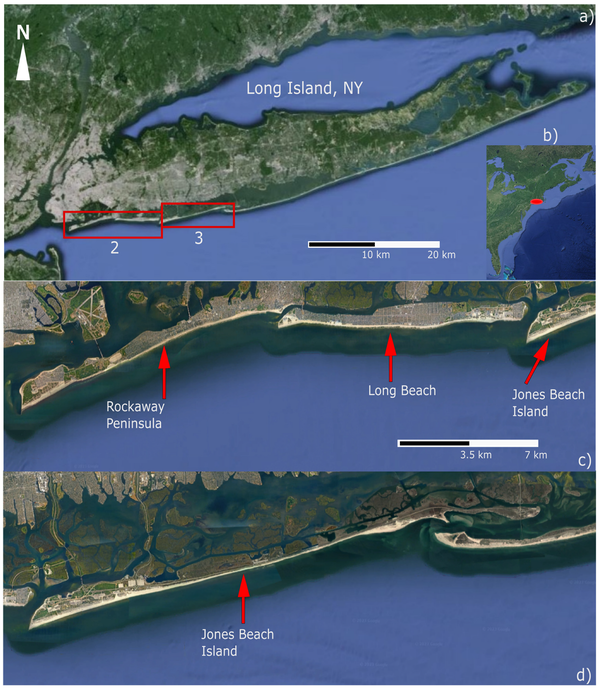
The Long Island study area, including (a,b) the overall location of Long Island with respect to New York and the greater U.S.
The Long Island study area, including (a,b) the overall location of Long Island with respect to New York and the greater U.S.

Scientists and technicians from the Woods Hole Coastal and Marine Science Center (WHCMSC) in Woods Hole, Massachusetts traveled to the Pacific Coastal and Marine Science Center (PCMSC) in Santa Cruz, California to learn about their seafloor imaging and sampling instrument—the Benthic Observation camera Sled, or BOBSled.
Scientists and technicians from the Woods Hole Coastal and Marine Science Center (WHCMSC) in Woods Hole, Massachusetts traveled to the Pacific Coastal and Marine Science Center (PCMSC) in Santa Cruz, California to learn about their seafloor imaging and sampling instrument—the Benthic Observation camera Sled, or BOBSled.

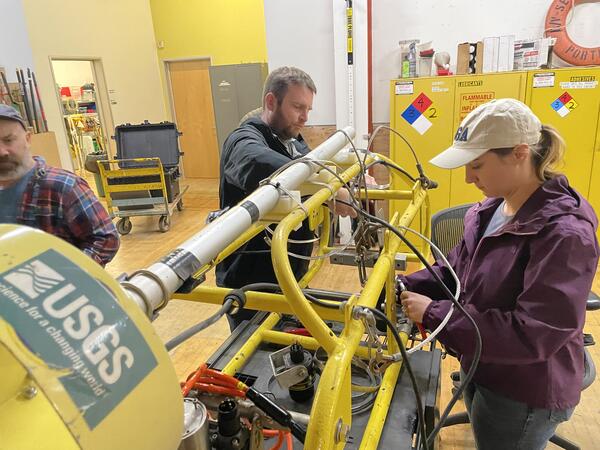
A magnitude 7.0 earthquake ruptured the Mendocino Transform Fault offshore Northern California on December 5, 2024. The USGS and colleagues from the Woods Hole Oceanographic Institution’s Ocean Bottom Seismic Instrument Center deployed our new fleet of rapid response ocean bottom seismographs just 11 days later—the fastest response in U.S. history.
A magnitude 7.0 earthquake ruptured the Mendocino Transform Fault offshore Northern California on December 5, 2024. The USGS and colleagues from the Woods Hole Oceanographic Institution’s Ocean Bottom Seismic Instrument Center deployed our new fleet of rapid response ocean bottom seismographs just 11 days later—the fastest response in U.S. history.
A magnitude 7.0 earthquake ruptured the Mendocino Transform Fault offshore Northern California on December 5, 2024. The USGS and colleagues from the Woods Hole Oceanographic Institution’s Ocean Bottom Seismic Instrument Center deployed our new fleet of rapid response ocean bottom seismographs just 11 days later—the fastest response in U.S. history.
A magnitude 7.0 earthquake ruptured the Mendocino Transform Fault offshore Northern California on December 5, 2024. The USGS and colleagues from the Woods Hole Oceanographic Institution’s Ocean Bottom Seismic Instrument Center deployed our new fleet of rapid response ocean bottom seismographs just 11 days later—the fastest response in U.S. history.
A magnitude 7.0 earthquake ruptured the Mendocino Transform Fault offshore Northern California on December 5, 2024. The USGS and colleagues from the Woods Hole Oceanographic Institution’s Ocean Bottom Seismic Instrument Center deployed our new fleet of rapid response ocean bottom seismographs just 11 days later—the fastest response in U.S. history.
A magnitude 7.0 earthquake ruptured the Mendocino Transform Fault offshore Northern California on December 5, 2024. The USGS and colleagues from the Woods Hole Oceanographic Institution’s Ocean Bottom Seismic Instrument Center deployed our new fleet of rapid response ocean bottom seismographs just 11 days later—the fastest response in U.S. history.