
2025 M7.0 Hubbard Glacier Earthquake-Triggered Landslides and Snow Avalanches
A M7.0 oblique-slip earthquake initiated about 10 km below the Hubbard Glacier in the St. Elias Mountains about 88 km north of Yakutat, Alaska, at approximately 11:40am AKST (1:40pm YST) on December 6, 2025. The U.S. Geological Survey (USGS) Ground Failure product estimated that landslides triggered by this earthquake would likely be significant in number and/or spatial extent. This was confirmed by a preliminary remote sensing assessment, in which the USGS mapped hundreds of coseismic landslides and snow avalanches in both Alaska and Canada, and a subsequent reconnaissance flight conducted by the Yukon Geological Survey.
This landslide event page serves as an event summary to communicate timely science information to our partners. This information includes what is currently understood about the event and ongoing activities of the USGS and partner agencies and may be subject to change.
What we are doing | Observations | Field Photos | More Information | Data
This webpage summarizes what we know so far about the landslides and snow avalanches triggered by this earthquake. Refer to the USGS earthquake event webpage for additional information about this earthquake.
What we are doing
The USGS conducted a preliminary remote sensing assessment of mass movements, including landslides and snow avalanches triggered by the Hubbard Glacier earthquake for general situational awareness and to help partner agencies plan reconnaissance flights. Cloud cover and limited daylight initially limited the use of optical satellite imagery, so the USGS used synthetic aperture radar (SAR) change detection to assess the extent of landslide activity. SAR is an active remote sensing technique that emits pulses of microwaves and records the information reflected from the ground. SAR is able to collect data in cloudy and night-time conditions, making it useful for gathering information in places like Alaska, especially when daylight is limited during the winter. The energy emitted by a SAR satellite interacts with the ground and can be processed into backscatter images that indicate how rough the surface is. By using two backscatter images, one before and one after this earthquake event (Figure 2; Eiden (2025)), we identified changes in surface roughness to determine the locations of potential mass movements like landslides and snow avalanches in the area affected by seismic shaking (Figure 2). There are many reasons for surface change in a snowy, mountainous environments including landslides, snow avalanches, new snowfall, changes in surface moisture, glacier movement and more.1,2 By combining these data with topographic maps and regional information, areas where surface change is likely related to landsliding can be distinguished. See 2025-12-10 – Preliminary remote sensing findings section below for summary of findings.
Update: On Friday, December 12th, Yukon Geological Survey staff took advantage of a weather window and flew by helicopter to the areas affected by the December 6th Hubbard Glacier earthquake. The objectives included documentation of landslide and avalanche activity triggered by the earthquake, to verify satellite observations of these events, and to determine whether the fault ruptured the ground surface. This information is helpful to improve location precision of the earthquake and to estimate the strength of shaking. Additionally, this reconnaissance helps to evaluate public safety concerns for mountaineering and skiing activities in the area. See 2025-12-12 – Yukon Geological Survey field reconnaissance findings section below for summary of observations.
There are many reasons for surface change in a snowy, mountainous environments including landslides, snow avalanches, new snowfall, changes in surface moisture, glacier movement and more.1,2 By combining these data with topographic maps and regional information, we are able to map where surface change is likely related to landsliding.
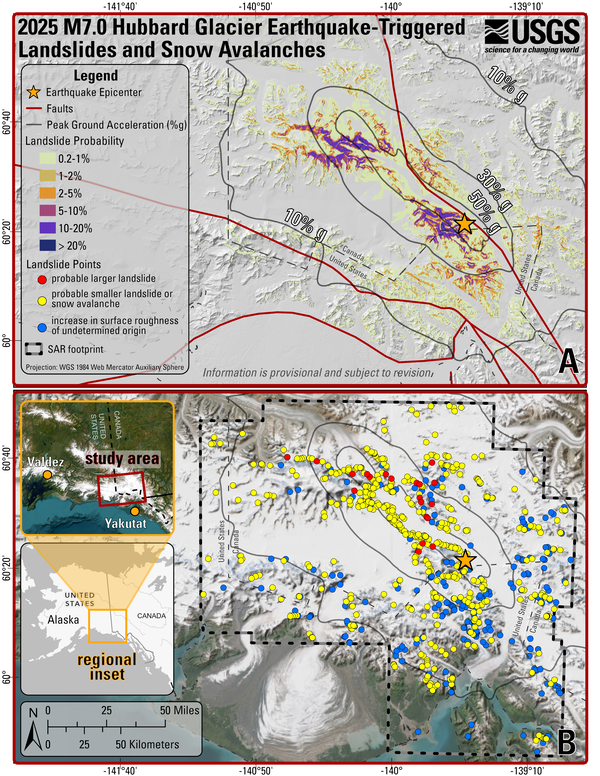
The USGS has identified over 700 potential landslides and snow avalanches (Figure 1B). The largest and most concentrated slope failures mainly occur in a 16 km wide band along the estimated fault rupture, which extends primarily towards the northwest for about 48 km from the epicenter of the earthquake. Some of the largest slides emanate from the slopes of Canada’s tallest peak, Mount Logan. Numerous slope failures occurred outside this central band for about 50 to 65 km in any direction from the estimated fault rupture, but these are generally smaller and less concentrated. These observed patterns correspond relatively well with the USGS Ground Failure model, which estimated higher landslide probabilities in this band along the estimated fault rupture (Figure 1A).
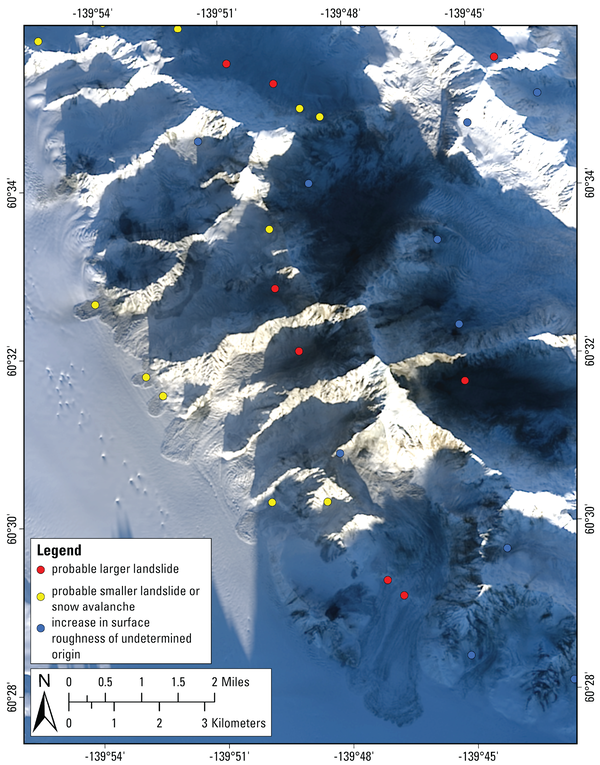
Twenty-one locations were identified as probable large landslides with well-defined lobate deposits measuring greater than 2 km in length. Although it is possible that some of these large events are snow avalanches, the large surface roughness changes and lobe-shaped toes are typical characteristics of landslides emplaced on glaciers. The majority of mapped locations (around 500) were identified as probable smaller landslides or snow avalanches, measuring between ~90 m to 2 km) in length and typically showing less distinct morphology in the available imagery. Approximately 200 additional areas showed surface roughness changes with shapes indicating downhill flow, but roughness changes were noisier or did not exhibit distinct lobate deposit morphology, making the interpretation less certain. Several of these areas were also located on glacial surfaces and could potentially reflect glacial changes.
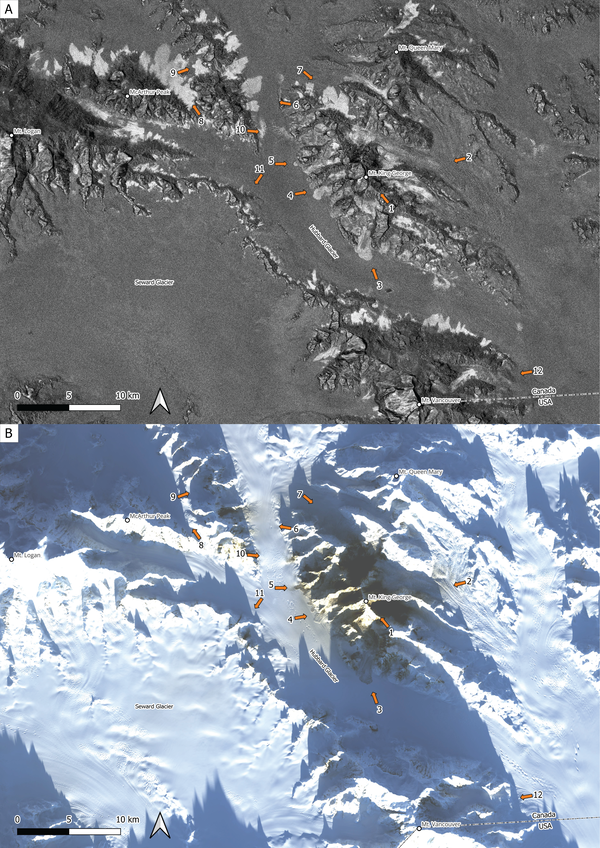
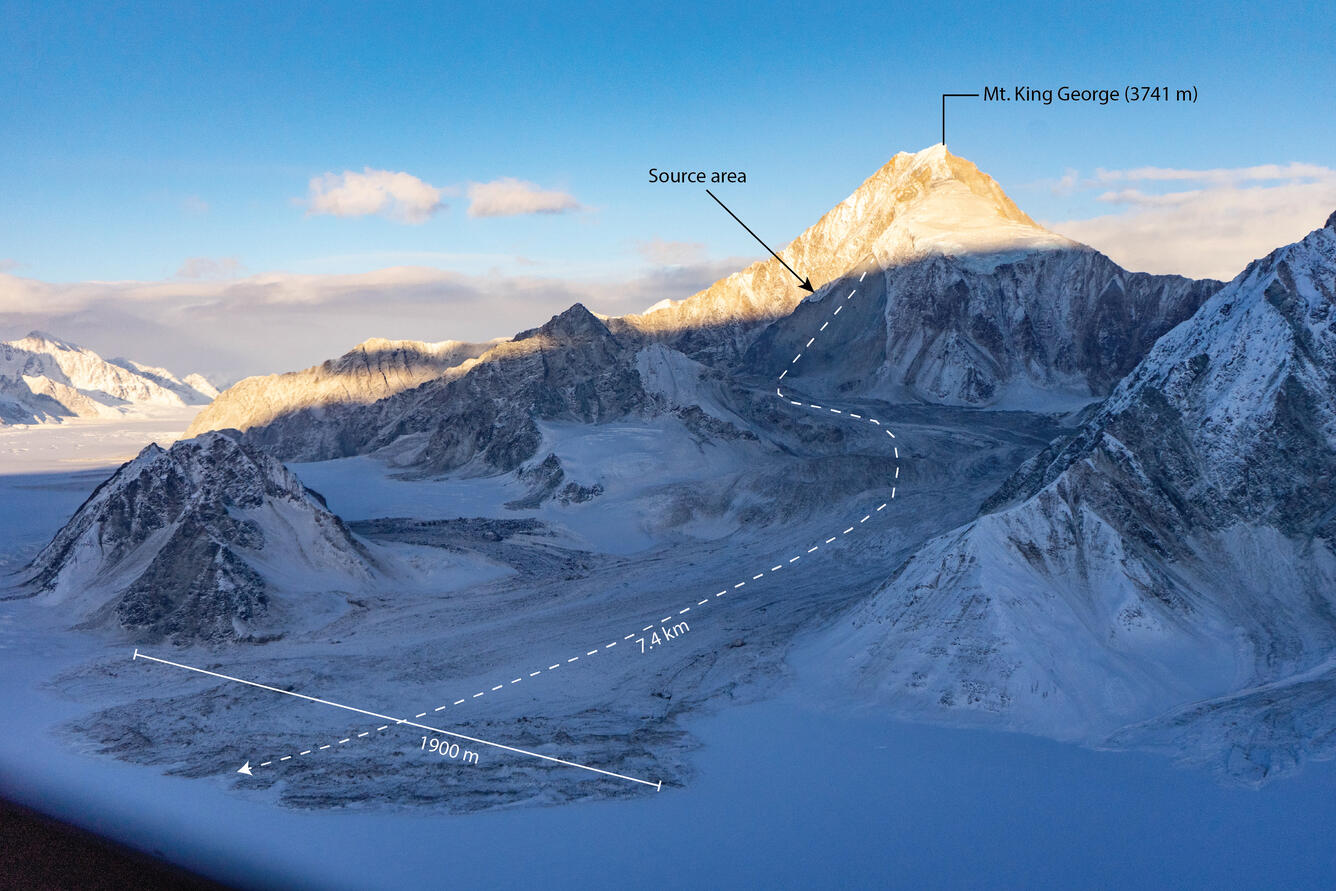
Although the SAR change method was very effective at highlighting deposits from mass movements, especially when deposited onto flatter glacier surfaces, the source and transport areas were not typically visible. Thus, reported runout distances provide a minimum constraint on total landslide travel distance. Preliminary estimates indicate that some of the largest landslides could have traveled distances of 6 km or more. A subsequent acquisition of Landsat satellite optical imagery confirmed the presence of landslides with deposits consisting of variable amounts of rock and snow and/or ice (Figure 3). Some areas that show roughness changes in SAR amplitude differencing appear completely snow-covered in optical imagery and may include mass movements that consist primarily of snow, or landslides that were covered by snowfall after deposition.
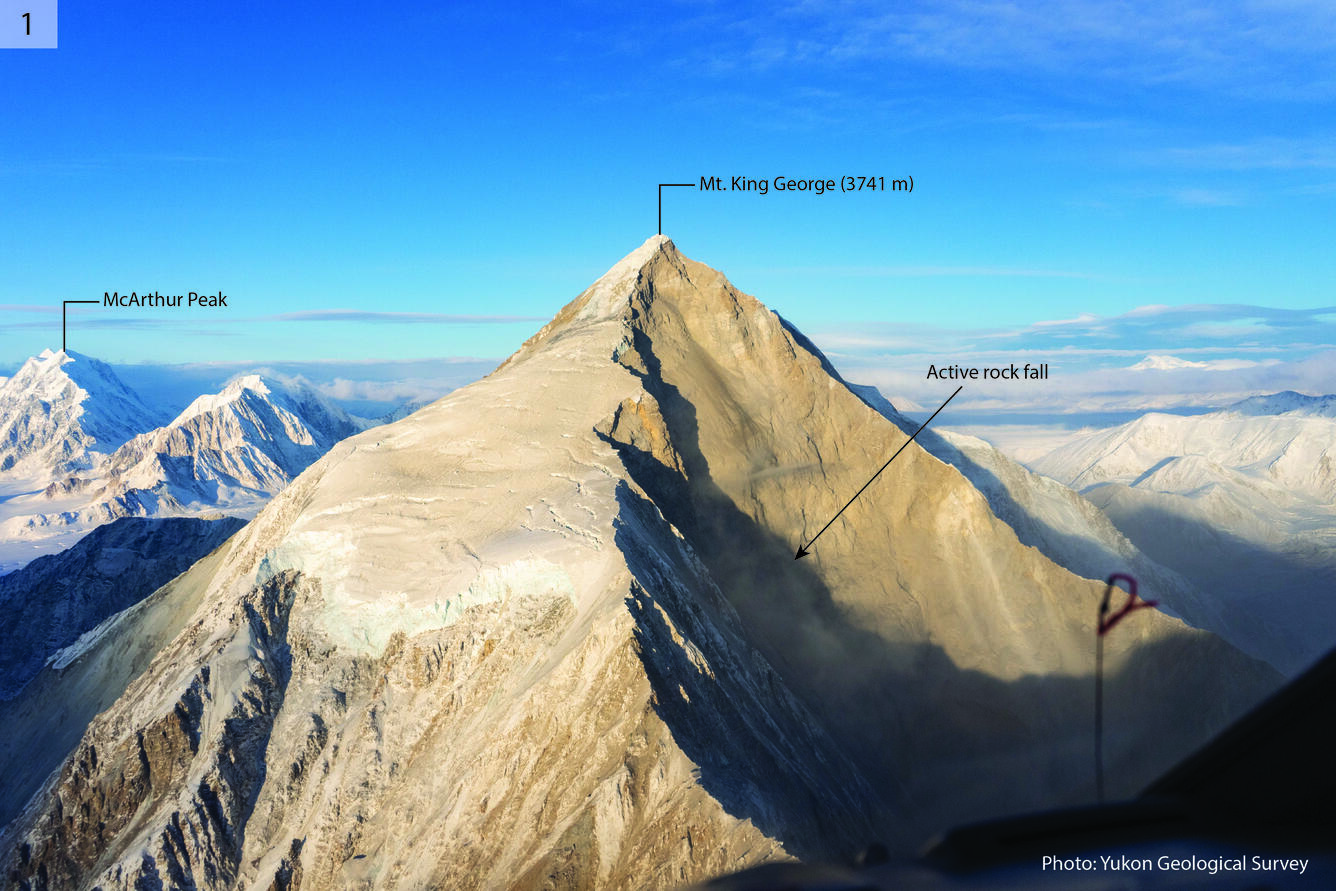
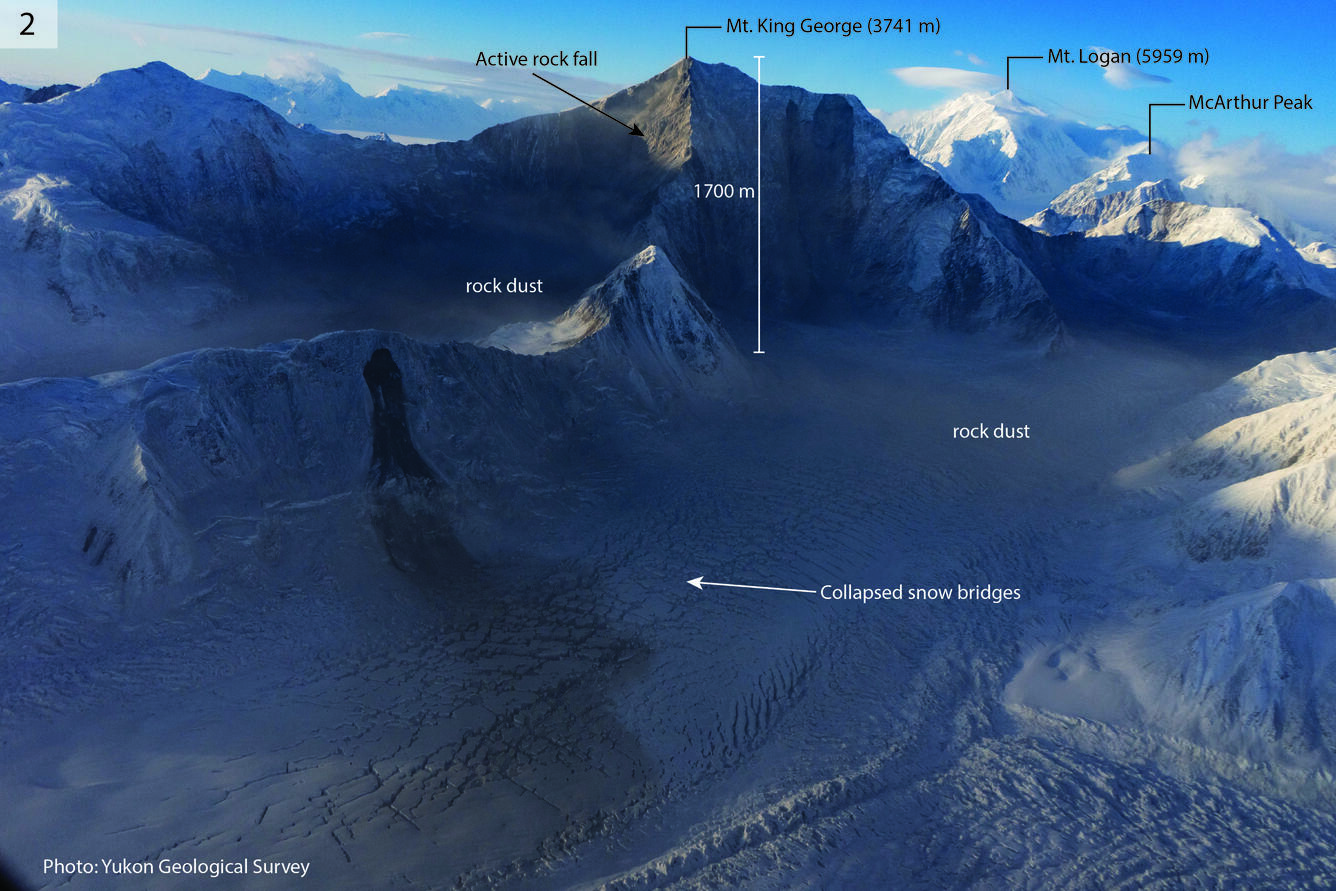
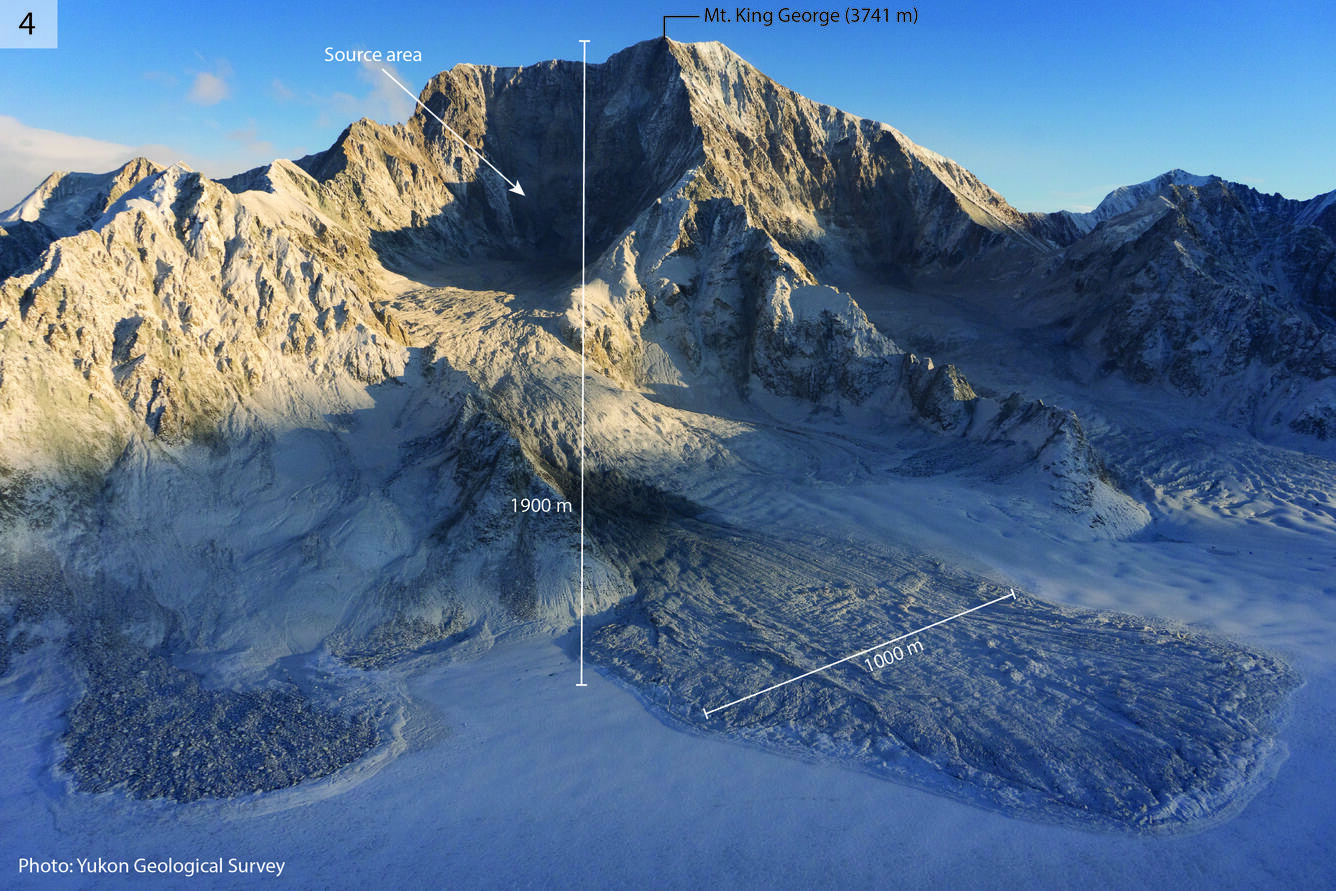
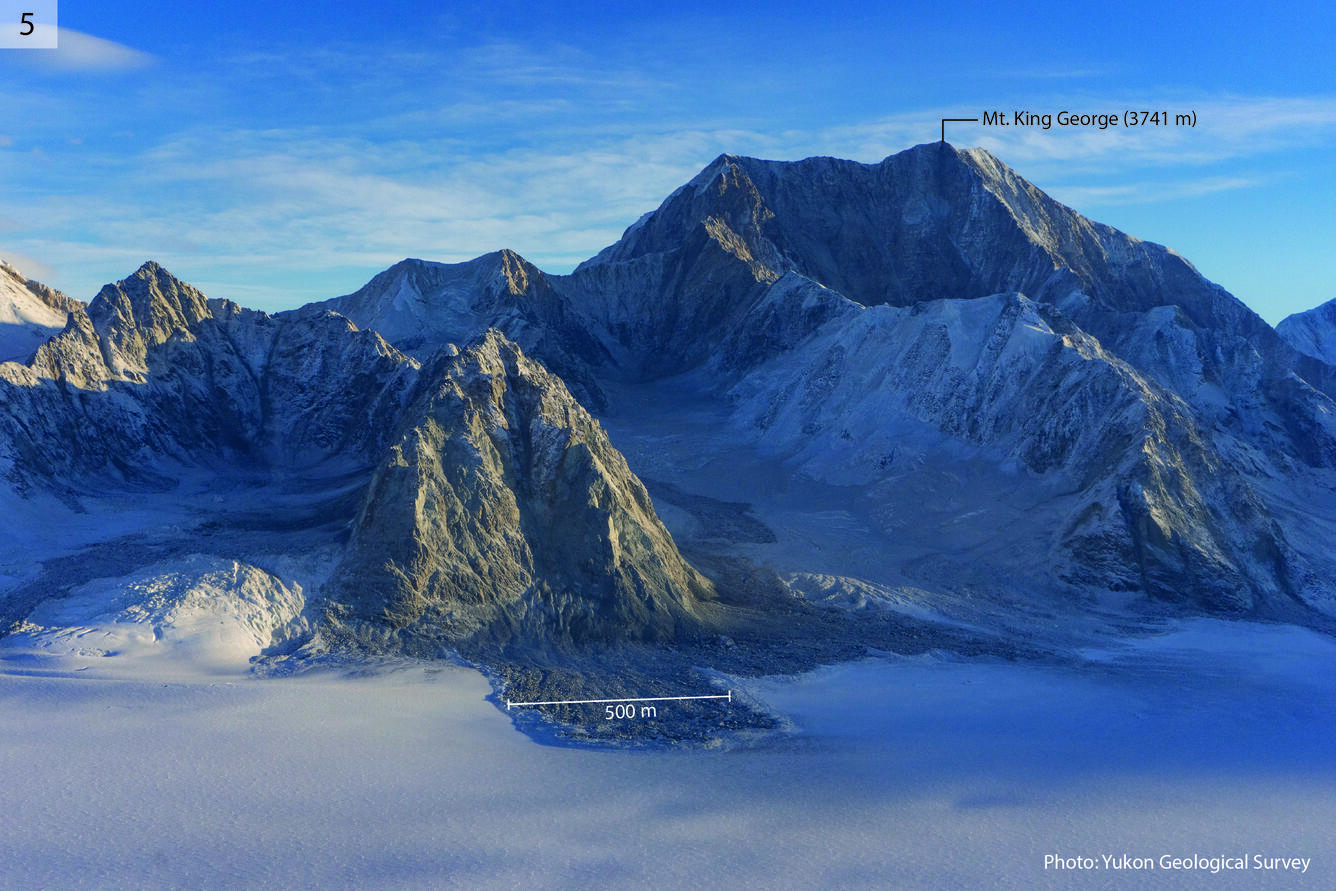
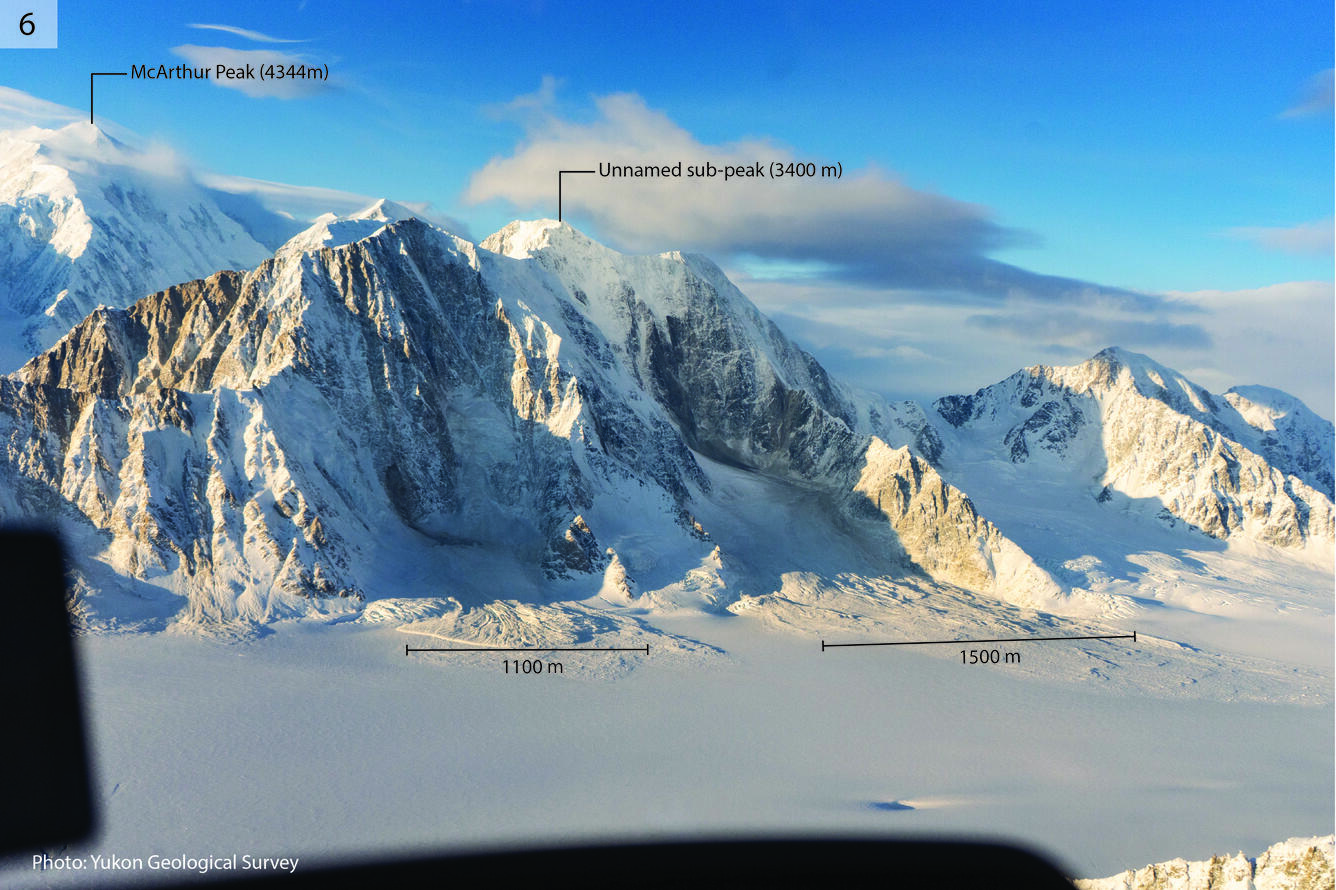
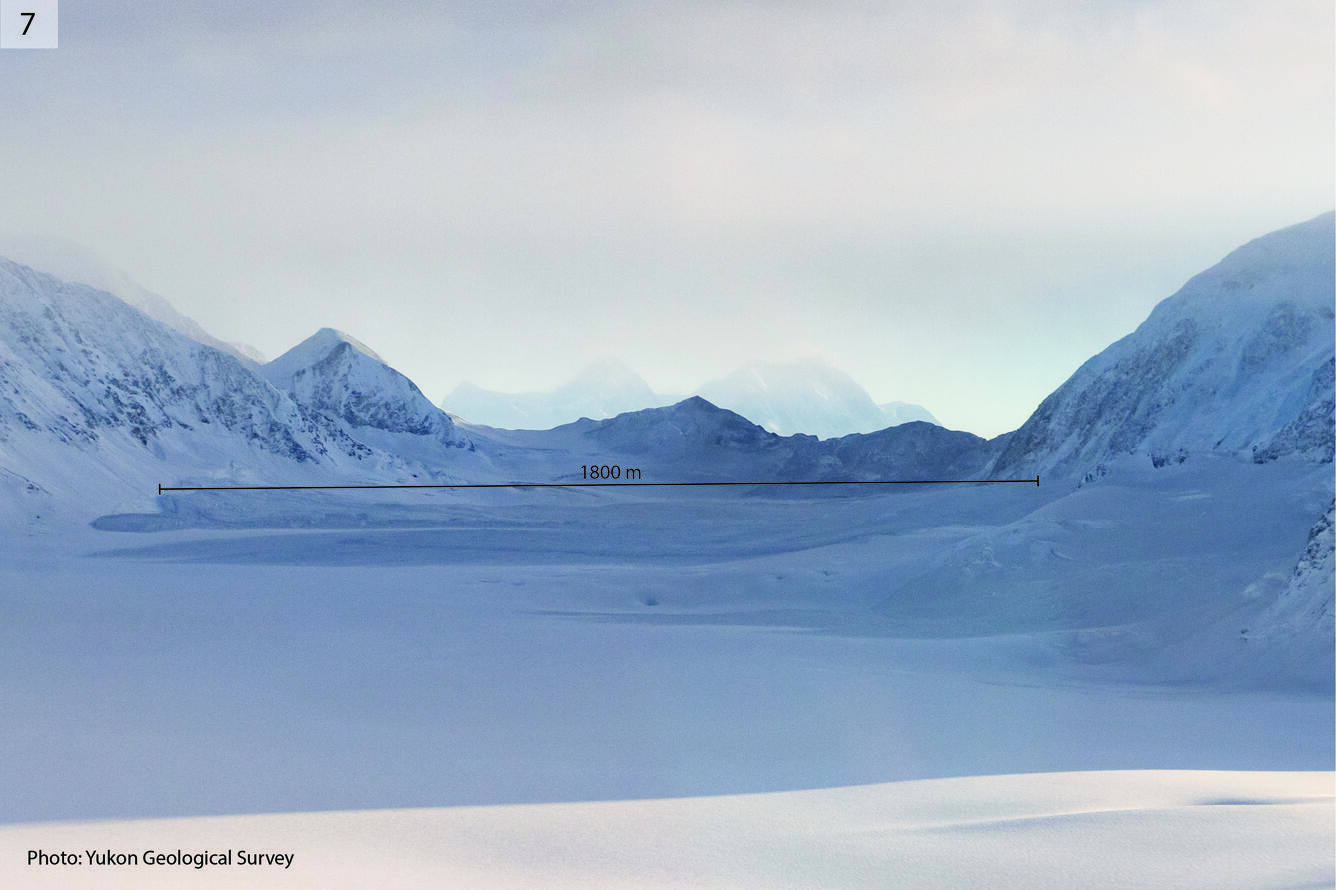
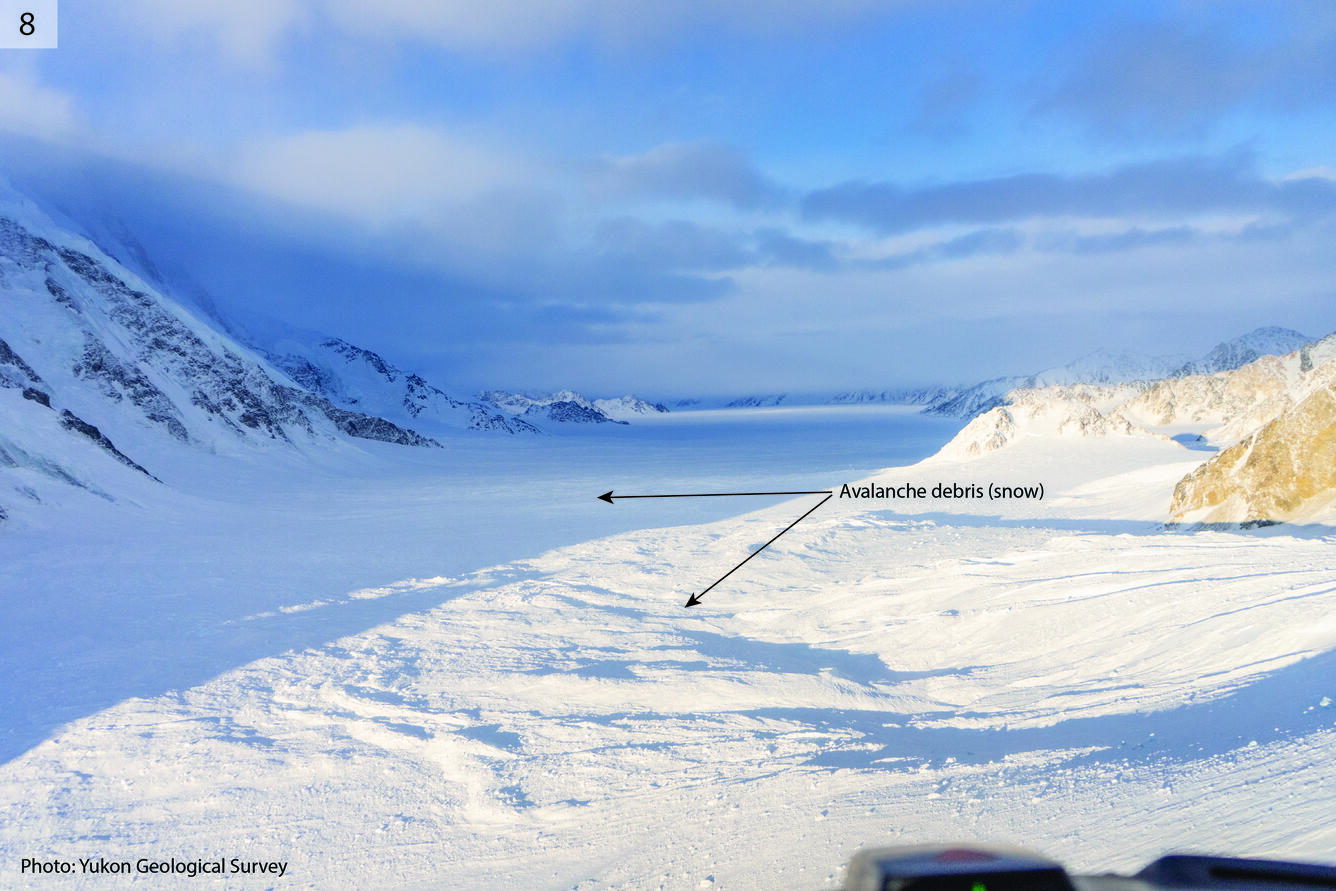
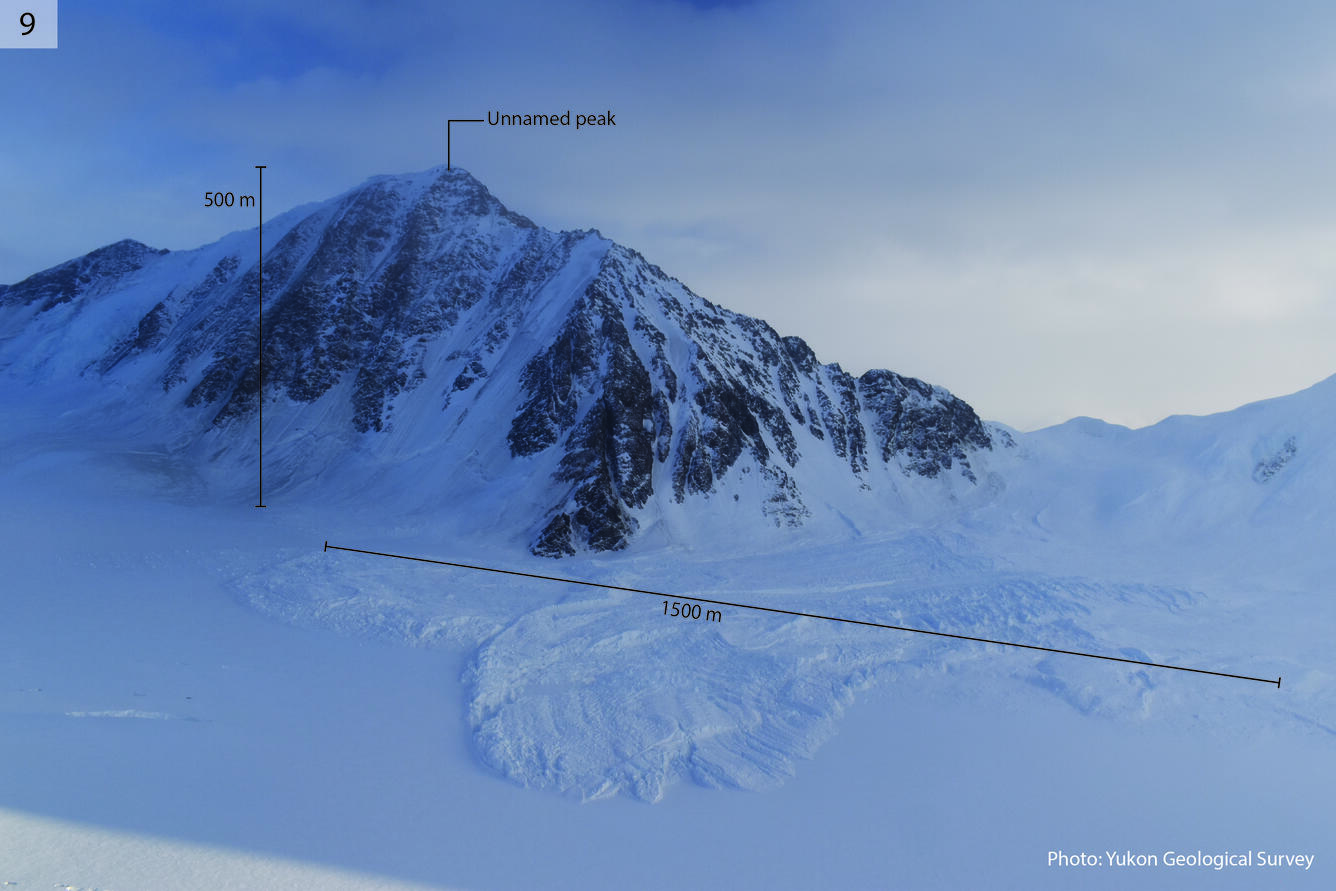
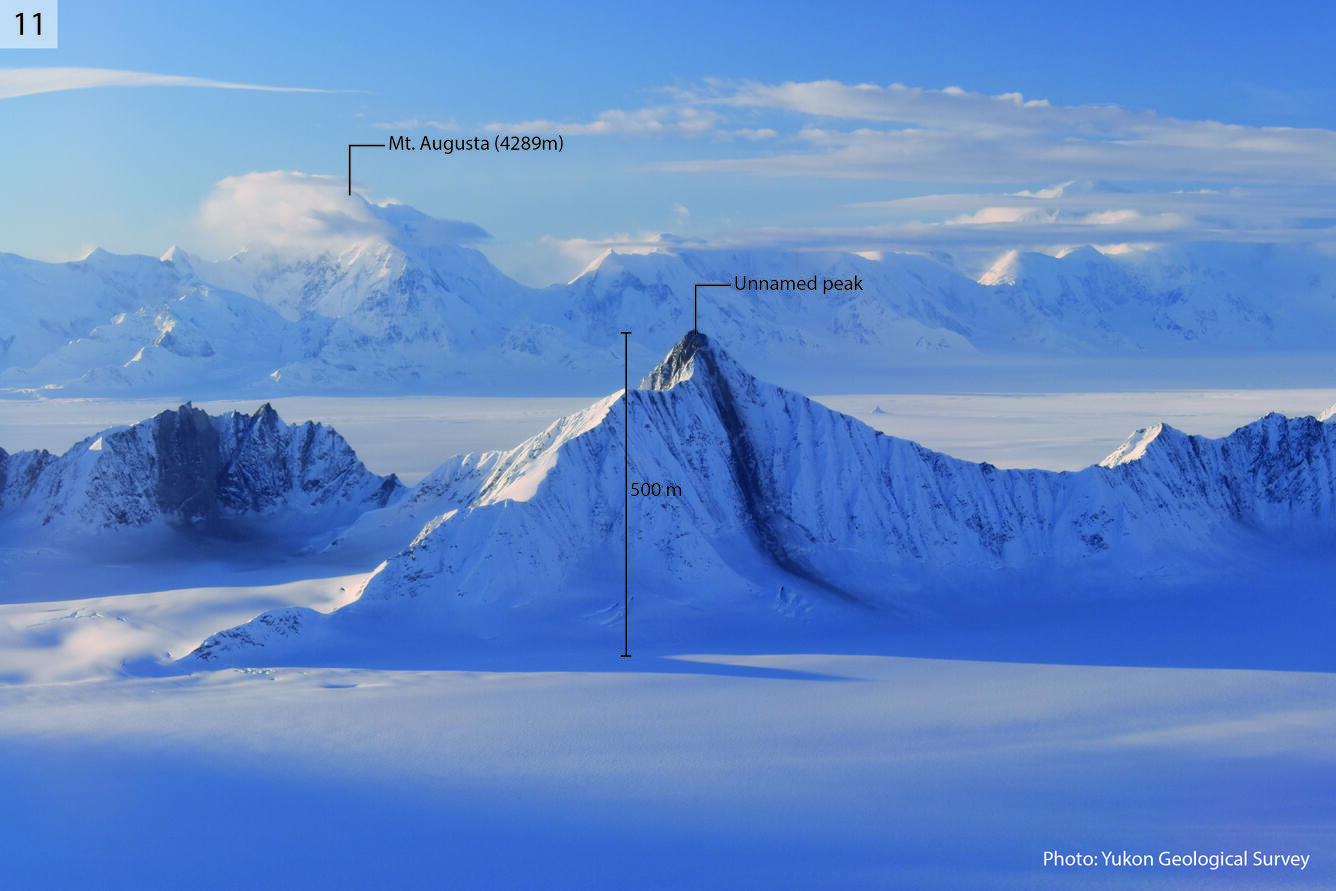
The Yukon Geological Survey (YGS) confirmed in their December 12, 2025, aerial reconnaissance that the earthquake triggered numerous large landslides, the majority of which were on the slopes of Mt. King George, a 3741 m tall peak approximately 40 km east of Mt. Logan (refer to Figure 4 and field photo viewer below). Many of these landslides showed ongoing signs of instability, and when the crew arrived in the area, there were clouds of dust in the air from a large slide that had just occurred on the east side of Mt. King George. YGS observed smaller landslides on the slopes of Mt. Vancouver, Mt. Logan, and the surrounding sub-peaks. However, snow and ice avalanches were more common farther from the estimated fault rupture. These patterns likely relate to differences in the intensity and characteristics of the shaking across the affected area.
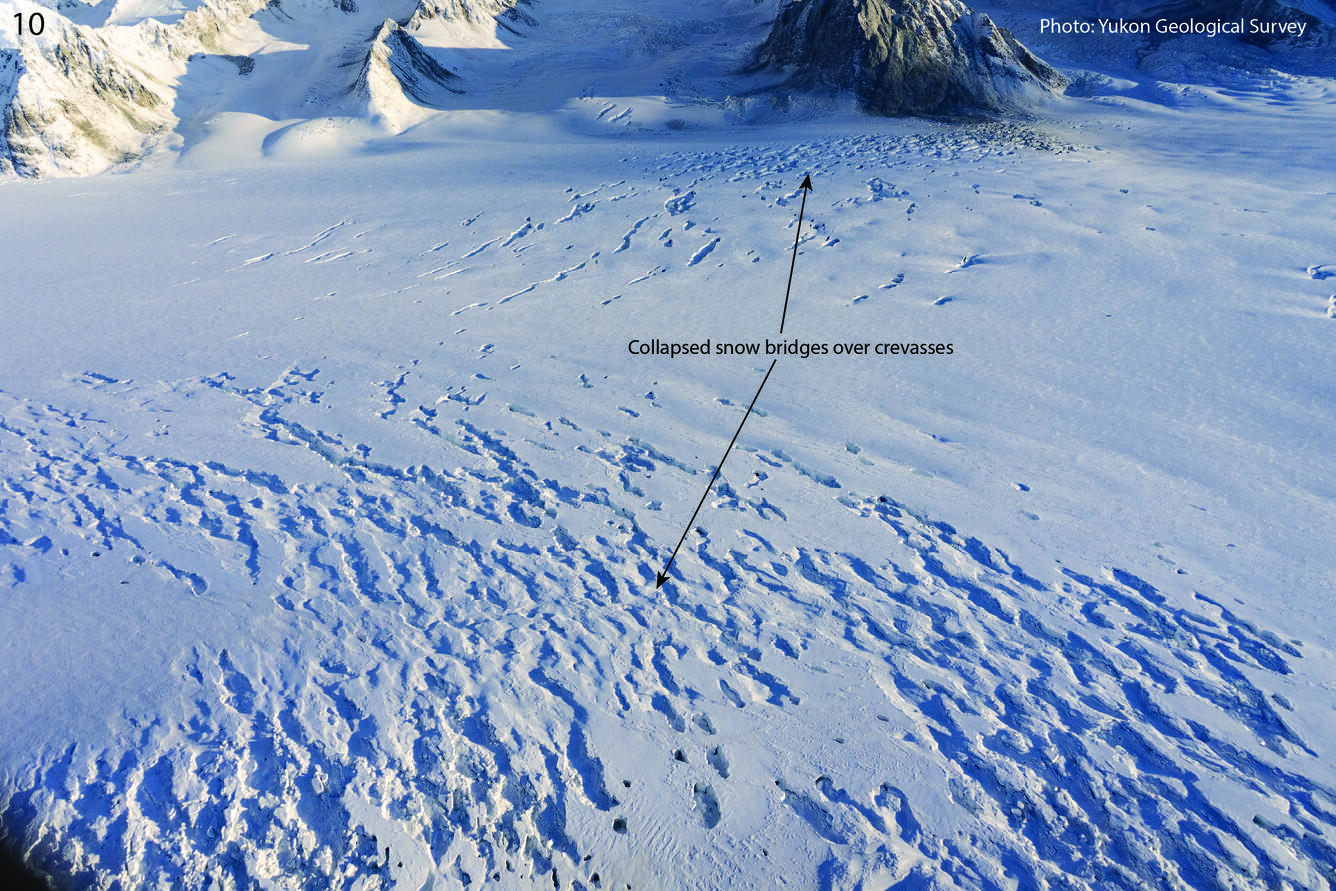
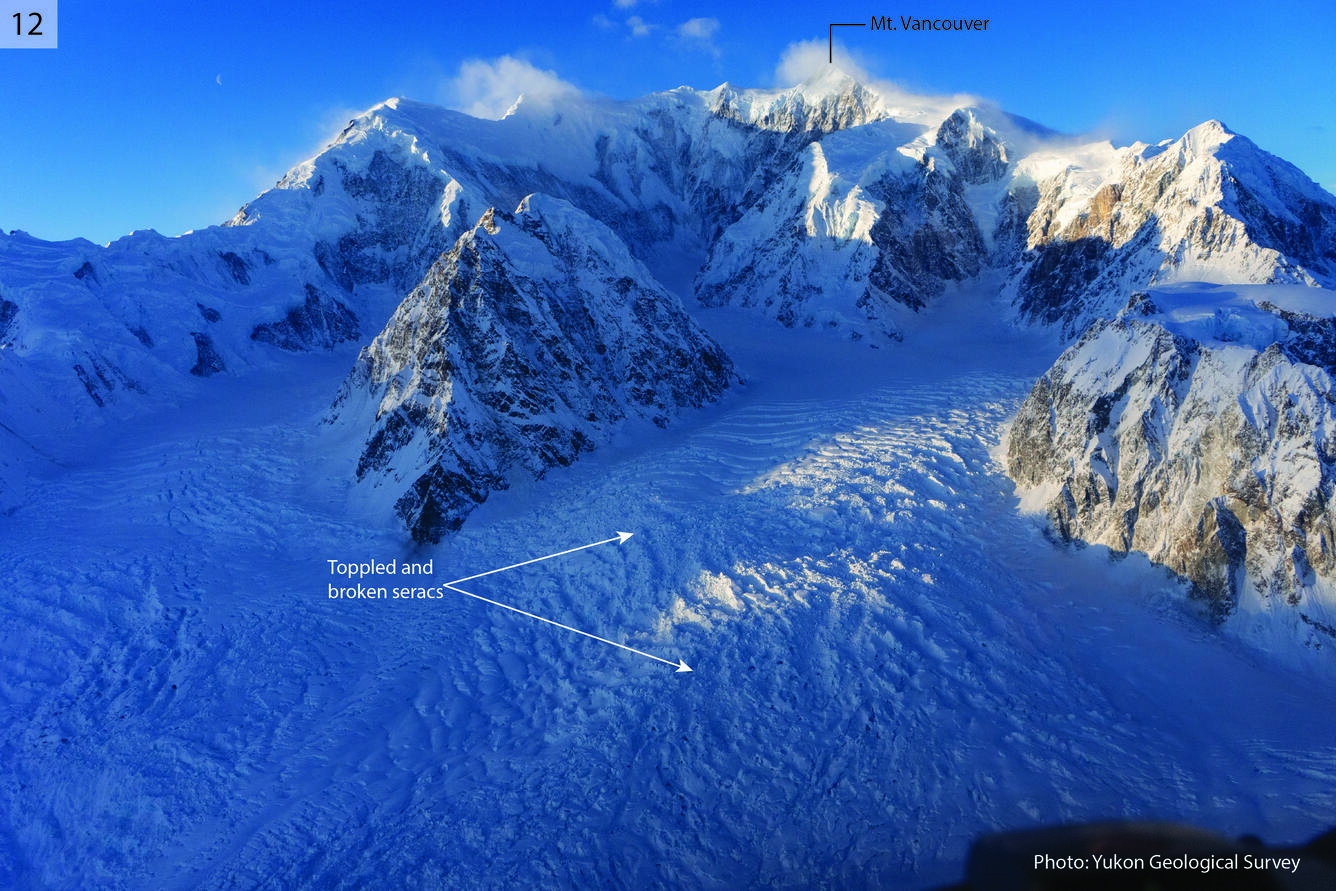
In addition to landslides, the earthquake caused widespread damage to glacial ice. Seracs and icefalls were commonly broken up and toppled by shaking, and snow bridges across crevasses had collapsed. It is fortunate that this event did not occur during mountaineering season, as earthquake-triggered serac falls and avalanches have caused fatalities in the past. The damage to ice in the region and persistent rockfall from landslides scars may pose new additional hazards for mountaineering and skiing expeditions in the area.
Despite approximately 2 m of fault slip occurring at 5 km depth, the YGS did not observe any clear evidence of the fault rupturing to the surface in this earthquake. However, it is possible that a surface rupture was hidden by glacier ice.
Field Photos
Provisional Data Release links:
SAR amplitude difference: https://www.sciencebase.gov/catalog/item/6939b92ad4be026e406f26b8
Landslide and avalanche locations: https://www.sciencebase.gov/catalog/item/6939b36ad4be026e406f2686
Contributors to this page include Kate Allstadt (USGS), Erin Jensen (USGS), Elizabeth Eiden (USGS), Robert Schmitt (USGS), Sonia Ellison (USGS), Marísa Macías (USGS), Theron Finley (Yukon Geological Survey), Panya Lipovsky (Yukon Geological Survey), Derek Cronmiller (Yukon Geological Survey), and Jan Dettmer (Yukon Geological Survey).
View the USGS earthquake event page for this event.
View the Alaska Earthquake Center event page for this earthquake
Learn more about the Wrangell-St. Elias National Park
Learn more about the Kluane National Park and Reserve
Learn more about the Yukon Geological Survey
Learn more about landslides.
Learn more about landslide preparedness.
Learn more about the National Landslide Susceptibility Map.
Learn more about the Landslide Hazards Program.
Learn more about USGS Landslide Response.
References
1Lindsay, E., Ganerød, A.J., Devoli, G., Reiche, J., Nordal, S., and Frauenfelder, R., 2025, Understanding Landslide Expression in SAR Backscatter Data: Global Study and Disaster Response Application: Remote Sensing, v. 17, no. 19, p. 3313, at https://doi.org/10.3390/rs17193313.
2Rott, H., and Mätzler, C., 1987, Possibilities and Limits of Synthetic Aperture Radar for Snow and Glacier Surveying: Annals of Glaciology, v. 9, p. 195–199, at https://doi.org/10.3189/S0260305500000604.
3U.S. Geological Survey (USGS), Earthquake Hazards Program, 2025, M 7.0 - 2025 Hubbard Glacier Earthquake, https://earthquake.usgs.gov/earthquakes/eventpage/us6000rsy1/executive.
4Altekruse, J.M., Powers, P.M., Llenos, A.L, and Haynie, K.L., 2024, Data Release for the 2023 Alaska National Seismic Hazard Model: U.S. Geological Survey data release, https://doi.org/10.5066/P9EVWWFZ.
| Disclaimer: This information is preliminary or provisional and is subject to revision. It is being provided to meet the need for timely best science. The information has not received final approval by the U.S. Geological Survey (USGS) and is provided on the condition that neither the USGS nor the U.S. Government shall be held liable for any damages resulting from the authorized or unauthorized use of the information. |
A M7.0 oblique-slip earthquake initiated about 10 km below the Hubbard Glacier in the St. Elias Mountains about 88 km north of Yakutat, Alaska, at approximately 11:40am AKST (1:40pm YST) on December 6, 2025. The U.S. Geological Survey (USGS) Ground Failure product estimated that landslides triggered by this earthquake would likely be significant in number and/or spatial extent. This was confirmed by a preliminary remote sensing assessment, in which the USGS mapped hundreds of coseismic landslides and snow avalanches in both Alaska and Canada, and a subsequent reconnaissance flight conducted by the Yukon Geological Survey.
This landslide event page serves as an event summary to communicate timely science information to our partners. This information includes what is currently understood about the event and ongoing activities of the USGS and partner agencies and may be subject to change.
What we are doing | Observations | Field Photos | More Information | Data
This webpage summarizes what we know so far about the landslides and snow avalanches triggered by this earthquake. Refer to the USGS earthquake event webpage for additional information about this earthquake.
What we are doing
The USGS conducted a preliminary remote sensing assessment of mass movements, including landslides and snow avalanches triggered by the Hubbard Glacier earthquake for general situational awareness and to help partner agencies plan reconnaissance flights. Cloud cover and limited daylight initially limited the use of optical satellite imagery, so the USGS used synthetic aperture radar (SAR) change detection to assess the extent of landslide activity. SAR is an active remote sensing technique that emits pulses of microwaves and records the information reflected from the ground. SAR is able to collect data in cloudy and night-time conditions, making it useful for gathering information in places like Alaska, especially when daylight is limited during the winter. The energy emitted by a SAR satellite interacts with the ground and can be processed into backscatter images that indicate how rough the surface is. By using two backscatter images, one before and one after this earthquake event (Figure 2; Eiden (2025)), we identified changes in surface roughness to determine the locations of potential mass movements like landslides and snow avalanches in the area affected by seismic shaking (Figure 2). There are many reasons for surface change in a snowy, mountainous environments including landslides, snow avalanches, new snowfall, changes in surface moisture, glacier movement and more.1,2 By combining these data with topographic maps and regional information, areas where surface change is likely related to landsliding can be distinguished. See 2025-12-10 – Preliminary remote sensing findings section below for summary of findings.
Update: On Friday, December 12th, Yukon Geological Survey staff took advantage of a weather window and flew by helicopter to the areas affected by the December 6th Hubbard Glacier earthquake. The objectives included documentation of landslide and avalanche activity triggered by the earthquake, to verify satellite observations of these events, and to determine whether the fault ruptured the ground surface. This information is helpful to improve location precision of the earthquake and to estimate the strength of shaking. Additionally, this reconnaissance helps to evaluate public safety concerns for mountaineering and skiing activities in the area. See 2025-12-12 – Yukon Geological Survey field reconnaissance findings section below for summary of observations.
There are many reasons for surface change in a snowy, mountainous environments including landslides, snow avalanches, new snowfall, changes in surface moisture, glacier movement and more.1,2 By combining these data with topographic maps and regional information, we are able to map where surface change is likely related to landsliding.
The USGS has identified over 700 potential landslides and snow avalanches (Figure 1B). The largest and most concentrated slope failures mainly occur in a 16 km wide band along the estimated fault rupture, which extends primarily towards the northwest for about 48 km from the epicenter of the earthquake. Some of the largest slides emanate from the slopes of Canada’s tallest peak, Mount Logan. Numerous slope failures occurred outside this central band for about 50 to 65 km in any direction from the estimated fault rupture, but these are generally smaller and less concentrated. These observed patterns correspond relatively well with the USGS Ground Failure model, which estimated higher landslide probabilities in this band along the estimated fault rupture (Figure 1A).
Twenty-one locations were identified as probable large landslides with well-defined lobate deposits measuring greater than 2 km in length. Although it is possible that some of these large events are snow avalanches, the large surface roughness changes and lobe-shaped toes are typical characteristics of landslides emplaced on glaciers. The majority of mapped locations (around 500) were identified as probable smaller landslides or snow avalanches, measuring between ~90 m to 2 km) in length and typically showing less distinct morphology in the available imagery. Approximately 200 additional areas showed surface roughness changes with shapes indicating downhill flow, but roughness changes were noisier or did not exhibit distinct lobate deposit morphology, making the interpretation less certain. Several of these areas were also located on glacial surfaces and could potentially reflect glacial changes.
Although the SAR change method was very effective at highlighting deposits from mass movements, especially when deposited onto flatter glacier surfaces, the source and transport areas were not typically visible. Thus, reported runout distances provide a minimum constraint on total landslide travel distance. Preliminary estimates indicate that some of the largest landslides could have traveled distances of 6 km or more. A subsequent acquisition of Landsat satellite optical imagery confirmed the presence of landslides with deposits consisting of variable amounts of rock and snow and/or ice (Figure 3). Some areas that show roughness changes in SAR amplitude differencing appear completely snow-covered in optical imagery and may include mass movements that consist primarily of snow, or landslides that were covered by snowfall after deposition.
The Yukon Geological Survey (YGS) confirmed in their December 12, 2025, aerial reconnaissance that the earthquake triggered numerous large landslides, the majority of which were on the slopes of Mt. King George, a 3741 m tall peak approximately 40 km east of Mt. Logan (refer to Figure 4 and field photo viewer below). Many of these landslides showed ongoing signs of instability, and when the crew arrived in the area, there were clouds of dust in the air from a large slide that had just occurred on the east side of Mt. King George. YGS observed smaller landslides on the slopes of Mt. Vancouver, Mt. Logan, and the surrounding sub-peaks. However, snow and ice avalanches were more common farther from the estimated fault rupture. These patterns likely relate to differences in the intensity and characteristics of the shaking across the affected area.
In addition to landslides, the earthquake caused widespread damage to glacial ice. Seracs and icefalls were commonly broken up and toppled by shaking, and snow bridges across crevasses had collapsed. It is fortunate that this event did not occur during mountaineering season, as earthquake-triggered serac falls and avalanches have caused fatalities in the past. The damage to ice in the region and persistent rockfall from landslides scars may pose new additional hazards for mountaineering and skiing expeditions in the area.
Despite approximately 2 m of fault slip occurring at 5 km depth, the YGS did not observe any clear evidence of the fault rupturing to the surface in this earthquake. However, it is possible that a surface rupture was hidden by glacier ice.
Field Photos
Provisional Data Release links:
SAR amplitude difference: https://www.sciencebase.gov/catalog/item/6939b92ad4be026e406f26b8
Landslide and avalanche locations: https://www.sciencebase.gov/catalog/item/6939b36ad4be026e406f2686
Contributors to this page include Kate Allstadt (USGS), Erin Jensen (USGS), Elizabeth Eiden (USGS), Robert Schmitt (USGS), Sonia Ellison (USGS), Marísa Macías (USGS), Theron Finley (Yukon Geological Survey), Panya Lipovsky (Yukon Geological Survey), Derek Cronmiller (Yukon Geological Survey), and Jan Dettmer (Yukon Geological Survey).
View the USGS earthquake event page for this event.
View the Alaska Earthquake Center event page for this earthquake
Learn more about the Wrangell-St. Elias National Park
Learn more about the Kluane National Park and Reserve
Learn more about the Yukon Geological Survey
Learn more about landslides.
Learn more about landslide preparedness.
Learn more about the National Landslide Susceptibility Map.
Learn more about the Landslide Hazards Program.
Learn more about USGS Landslide Response.
References
1Lindsay, E., Ganerød, A.J., Devoli, G., Reiche, J., Nordal, S., and Frauenfelder, R., 2025, Understanding Landslide Expression in SAR Backscatter Data: Global Study and Disaster Response Application: Remote Sensing, v. 17, no. 19, p. 3313, at https://doi.org/10.3390/rs17193313.
2Rott, H., and Mätzler, C., 1987, Possibilities and Limits of Synthetic Aperture Radar for Snow and Glacier Surveying: Annals of Glaciology, v. 9, p. 195–199, at https://doi.org/10.3189/S0260305500000604.
3U.S. Geological Survey (USGS), Earthquake Hazards Program, 2025, M 7.0 - 2025 Hubbard Glacier Earthquake, https://earthquake.usgs.gov/earthquakes/eventpage/us6000rsy1/executive.
4Altekruse, J.M., Powers, P.M., Llenos, A.L, and Haynie, K.L., 2024, Data Release for the 2023 Alaska National Seismic Hazard Model: U.S. Geological Survey data release, https://doi.org/10.5066/P9EVWWFZ.
| Disclaimer: This information is preliminary or provisional and is subject to revision. It is being provided to meet the need for timely best science. The information has not received final approval by the U.S. Geological Survey (USGS) and is provided on the condition that neither the USGS nor the U.S. Government shall be held liable for any damages resulting from the authorized or unauthorized use of the information. |