Diagram of how USGS water data are transferred from streamgage to the internet
Diagram of how USGS water data are transferred from streamgage to the internetDiagram of how USGS water data are transferred from streamgage to the internet

Official websites use .gov
A .gov website belongs to an official government organization in the United States.
Secure .gov websites use HTTPS
A lock () or https:// means you’ve safely connected to the .gov website. Share sensitive information only on official, secure websites.
Discover and download images related to the Water Availability and Use Science Program.

Diagram of how USGS water data are transferred from streamgage to the internet
Diagram of how USGS water data are transferred from streamgage to the internet
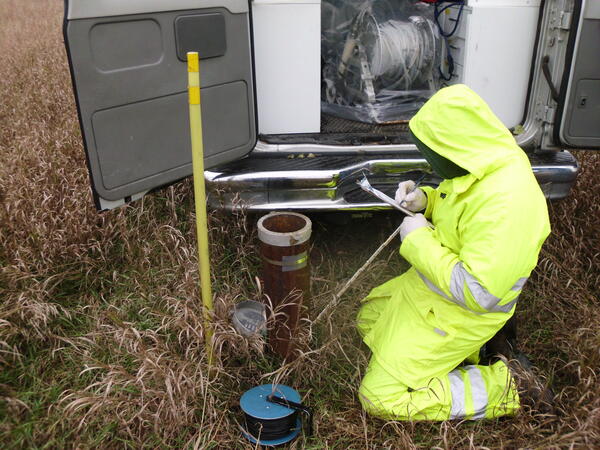
USGS scientist takes measurements of groundwater quality from a monitoring well near Zimmerman, Minnesota.
USGS scientist takes measurements of groundwater quality from a monitoring well near Zimmerman, Minnesota.
Images representing three of the services available to users of the National Water Availability Assessments (NWAA) Data Companion. Services include subset and download tool, data file directory, and web services.
Images representing three of the services available to users of the National Water Availability Assessments (NWAA) Data Companion. Services include subset and download tool, data file directory, and web services.
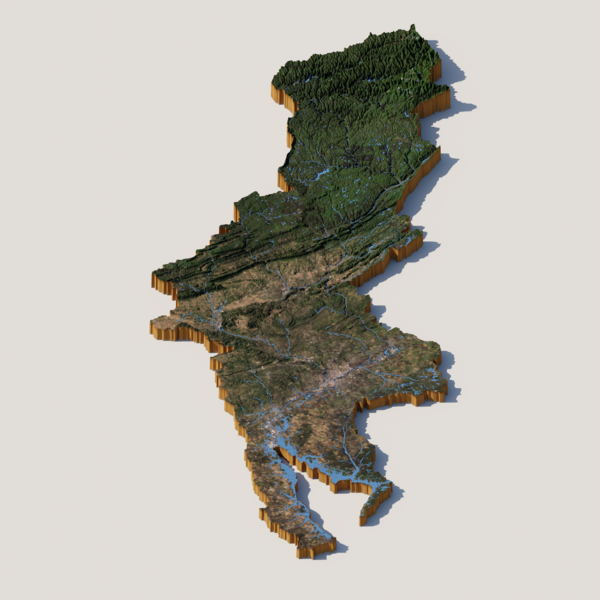
3D render of the Delaware River Basin, created using TopoRivBlender. Read more about this method at https://waterdata.usgs.gov/blog/topo-riv-blender/
3D render of the Delaware River Basin, created using TopoRivBlender. Read more about this method at https://waterdata.usgs.gov/blog/topo-riv-blender/
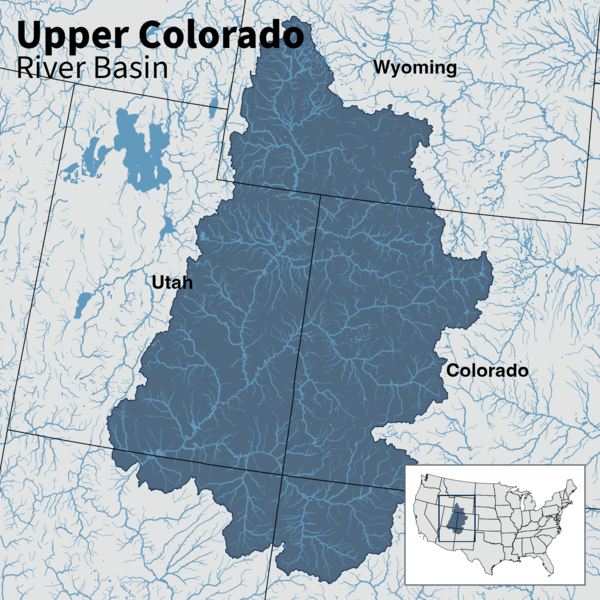
Map of the Upper Colorado River Basin —referred to as an Integrated Water Science (IWS) basins—are intensively monitored study basins representing a wide range of environmental, hydrologic, and landscape settings and human stressors of water resources to improve our understanding of water availability across the Nation.
Map of the Upper Colorado River Basin —referred to as an Integrated Water Science (IWS) basins—are intensively monitored study basins representing a wide range of environmental, hydrologic, and landscape settings and human stressors of water resources to improve our understanding of water availability across the Nation.
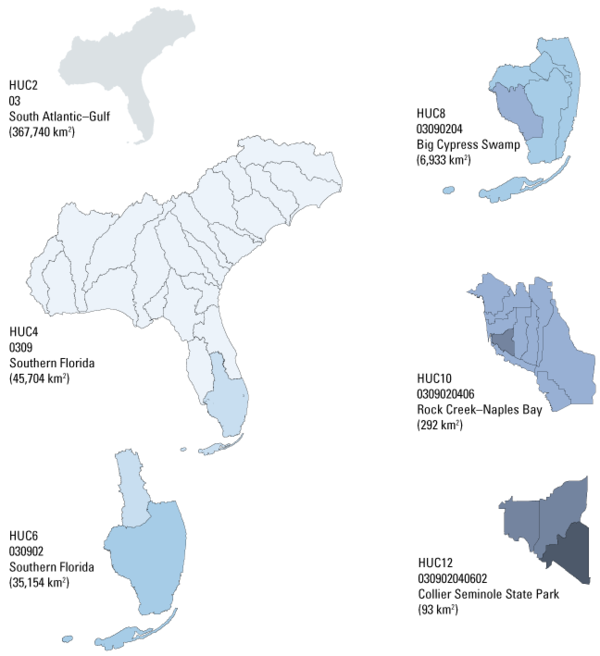
The U.S. Geological Survey uses a depiction and classification scheme for hydrologic units known as hydrologic unit codes (HUCs). HUCs generally represent catchments, and river basins are represented by a unique series of numbers with successively smaller hydrologic units nested inside of larger ones.
The U.S. Geological Survey uses a depiction and classification scheme for hydrologic units known as hydrologic unit codes (HUCs). HUCs generally represent catchments, and river basins are represented by a unique series of numbers with successively smaller hydrologic units nested inside of larger ones.

Pie chart showing proportions of major water uses (Agricultural, Municipal, Industrial, and Mining) in Arizona, USA, in 2015
Pie chart showing proportions of major water uses (Agricultural, Municipal, Industrial, and Mining) in Arizona, USA, in 2015
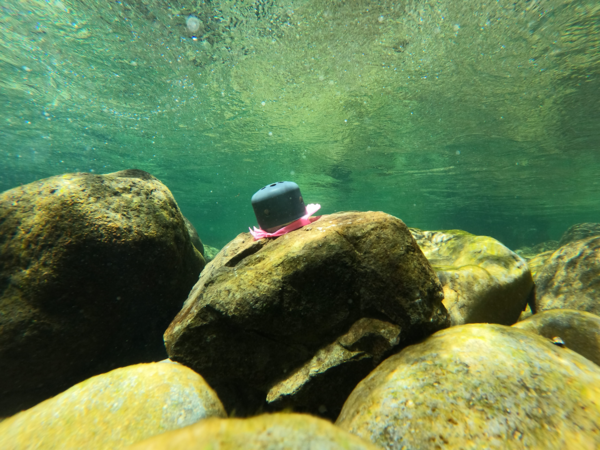
Temperature logger attached to submerged cobble in Quartzville Creek, OR. This logger was placed as part of an ongoing effort to retrieve continuous temperature data from rivers and tributaries within the Willamette River basin, OR.
Temperature logger attached to submerged cobble in Quartzville Creek, OR. This logger was placed as part of an ongoing effort to retrieve continuous temperature data from rivers and tributaries within the Willamette River basin, OR.

Schematic diagram of water flow for conventional flotation processing of copper ores from Bleiwas, D.I., 2012, Estimated water requirements for the conventional flotation of copper ores: U.S. Geological Survey Open-File Report 2012–1089, 13 p., available at https://pubs.usgs.gov/publication/ofr20121089
Schematic diagram of water flow for conventional flotation processing of copper ores from Bleiwas, D.I., 2012, Estimated water requirements for the conventional flotation of copper ores: U.S. Geological Survey Open-File Report 2012–1089, 13 p., available at https://pubs.usgs.gov/publication/ofr20121089
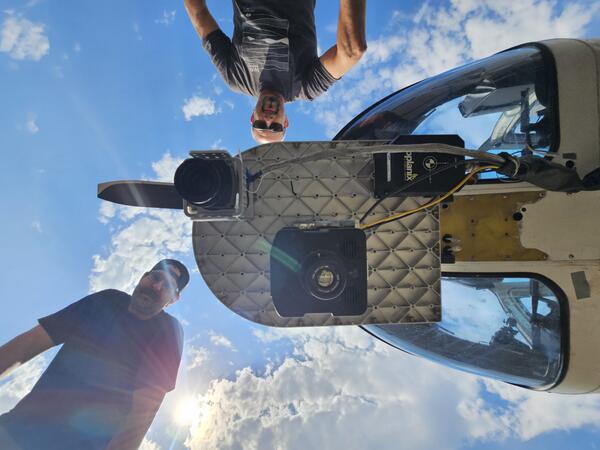
Underside of Bell Jet Helicopter with thermal infrared and true-color image sensors and JN and M.D. The helicopter is used for airborne surveys of river reaches to capture temperature values of water-surfaces.
Underside of Bell Jet Helicopter with thermal infrared and true-color image sensors and JN and M.D. The helicopter is used for airborne surveys of river reaches to capture temperature values of water-surfaces.

Schematic diagram of water flow through a conventional copper-ore flotation plant and unlined tailings storage facility illustrating water losses (in italics), reclamation of process water, and addition of makeup water.
Schematic diagram of water flow through a conventional copper-ore flotation plant and unlined tailings storage facility illustrating water losses (in italics), reclamation of process water, and addition of makeup water.

Profile view of a Bell Jet Helicopter with a thermal infrared and true-color sensor co-mounted to the underside of the nose. These sensors are used in airborne thermal infrared surveys for remotely sensing land/water surface temperature.
Profile view of a Bell Jet Helicopter with a thermal infrared and true-color sensor co-mounted to the underside of the nose. These sensors are used in airborne thermal infrared surveys for remotely sensing land/water surface temperature.

Summer Lake, Oregon is one of the 20 terminal lakes identified by USGS partners as priority ecosystems for study by the Saline Lakes Ecosystems IWAA.
Summer Lake, Oregon is one of the 20 terminal lakes identified by USGS partners as priority ecosystems for study by the Saline Lakes Ecosystems IWAA.

A soil moisture data logger buried in the ground is a specialized instrument designed to measure and record the moisture content of soil over time. Here's how it generally functions:
A soil moisture data logger buried in the ground is a specialized instrument designed to measure and record the moisture content of soil over time. Here's how it generally functions:

Lake Abert, Oregon is one of the 20 terminal lakes identified by USGS partners as priority ecosystems for study by the Saline Lakes Ecosystems IWAA.
Lake Abert, Oregon is one of the 20 terminal lakes identified by USGS partners as priority ecosystems for study by the Saline Lakes Ecosystems IWAA.

This map shows the airborne geophysical survey area and planned flight paths across the Illinois River Basin in Illinois and northwest Indiana. Surveys will not occur directly above populated areas. Planned flight lines and survey progress can be found online.
(USGS map)
This map shows the airborne geophysical survey area and planned flight paths across the Illinois River Basin in Illinois and northwest Indiana. Surveys will not occur directly above populated areas. Planned flight lines and survey progress can be found online.
(USGS map)

This image displays the ModelMuse main window with several objects that define calibration observations displayed. The image is intended to be used with a video.
This image displays the ModelMuse main window with several objects that define calibration observations displayed. The image is intended to be used with a video.

Screen capture of the ModelMuse main window with the cells colored with the hydraulic conductivity after being calibrated using PEST.
The image is intended to introduce a video.
Screen capture of the ModelMuse main window with the cells colored with the hydraulic conductivity after being calibrated using PEST.
The image is intended to introduce a video.

Looking east on Bullgate Pond at sunrise with lone tule white-fronted goose (Anser albifrons elgasi) in upper right, Summer Lake Wildlife Area, near Summer Lake, Oregon.
Looking east on Bullgate Pond at sunrise with lone tule white-fronted goose (Anser albifrons elgasi) in upper right, Summer Lake Wildlife Area, near Summer Lake, Oregon.

Ruby Lake National Wildlife Refuge lies at the southern end of Ruby Valley in northeast Nevada. For more information visit the Ruby Lake NWR website.
Ruby Lake National Wildlife Refuge lies at the southern end of Ruby Valley in northeast Nevada. For more information visit the Ruby Lake NWR website.

Steamboat Geyser eruption signals recorded by nearby monitoring instruments. The vertical pink lines mark when the signal first appears. (A) Seismic station YNM records a signal which slowly tapers as the eruption decreases in intensity. Spikes seen before the eruption are mostly due to human activity.
Steamboat Geyser eruption signals recorded by nearby monitoring instruments. The vertical pink lines mark when the signal first appears. (A) Seismic station YNM records a signal which slowly tapers as the eruption decreases in intensity. Spikes seen before the eruption are mostly due to human activity.