
What's New? Weeks 9-12
.
Week 12: 6/2 Rocks and Minerals

Geologists learn the stories of Earth’s past by studying rocks, which capture what Earth was like when they formed. But what are rocks and minerals and how do we study them?
Minerals are the building blocks of rocks, much like a bin of building blocks can make a final block sculpture. Rocks, on the other hand, are made up of one (monomineralic) or more minerals. Minerals are used in many household items that you use every day, and tens of thousands of pounds of minerals are required by the average person in a year (click here to find out how many and which minerals). See examples of minerals and gems (minerals that have been cut) on the Smithsonian Institution’s National Museum of Natural History’s GeoGallery website here.
Each mineral has a unique set of things that make it special, but they all must:
- Be naturally occurring
- Be solid
- Be inorganic
- Have an organized internal structure
- Have a distinct chemical composition (or range of composition)
- Have a set of distinct set of physical properties (eg. luster, streak, hardness, magnetism, cleavage, smell, etc.) that are used to identify the mineral. Note: Color is not a reliable way to identify most minerals because several minerals (e.g. quartz, fluorite) can be more than one color and several minerals can be the same color (olivine, fluorite, chlorite, malachite, and more can be green).


Grades K-6: The Rock Cycle!
There are three basic rock types, which are defined by how they form:
Sedimentary rocks are made up of particles of other rocks. They have mysterious names like mudstone for a rock that formed from mud, and sandstone for a rock that formed from sand. They are often layered, and they are the most common rocks for fossils to be found in.
Igneous rocks come from melted rock – magma or lava. The name “igneous” comes from the same root word as ignite – it means fire rocks. Volcanic rocks are igneous; so are plutonic rocks – they are named for Pluto, the god of the underworld, because they crystallize deep underground.
Metamorphic rocks have changed (like a butterfly) from one form to another under high heat and pressure deep in the Earth. They are also commonly layered or foliated, and the layers are often squiggly.
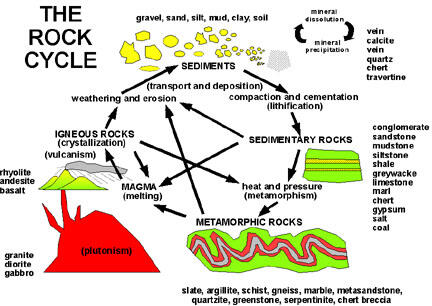
Earth is a great big recycling machine. Erosion breaks down rocks into smaller pieces, sediments, which can later become a sedimentary rock. Heat and pressure squeeze sedimentary or igneous rocks, and they become metamorphic. Even more heat can melt any kind of rock, creating magma which cools to an igneous rock.
In other words, any rock can become another rock, and that is the rock cycle. You’re probably familiar with the water cycle, and the rock cycle is similar, though much, much slower. Like the water cycle, there’s no one starting point, and you can follow a rock through many possible pathways from igneous rocks to sedimentary rocks to metamorphic rocks to lava/magma and back again!
Start anywhere on the diagram below, and see what it takes to transform from one rock type to another.

Grades 6-12: Rocks in Cities!
Rocks are all around you, not just in nature. Look closely at the walls of buildings and monuments. The decorative outer surfaces are often made of rocks instead of concrete! What do you notice around you? You can learn about the rocks that make up many of the iconic monuments in Washington DC in the Famous Building Stones of our Nation's Capital fact sheet.

Rock Types
Igneous rocks are rocks formed from the cooling of lava (molten rock at or just above Earth’s surface) or magma (molten rock below Earth’s surface). Lava cools quickly to become extrusive igneous rocks such as basalt or pumice and magma cools slowly to become intrusive igneous rocks such as granite or gabbro. When lava cools quickly, the minerals don’t have as much time to cool, so they’re smaller and harder to see (fine-grained, or aphanitic). Sometimes lava cools so fast that it creates volcanic glass (obsidian)! When magma cools closer to its “happy place” near Earth’s internal heat, the minerals have plenty of time to grow into larger crystals (course-grained, or phaneritic). Think about a granite countertop. You can easily see that there are many individual minerals and may even be able to identify some of them. It’s a lot harder to identify minerals in extrusive rocks formed from lava because the minerals are generally too small to see without a microscope.

Sedimentary rocks are formed by the compaction and cementation of sediments (clay, silt, sand, etc.) or from the remains of once-living organisms. Sedimentary rocks are either clastic (made up of pieces of other rocks or sediment) or non-clastic and are classified by grain size and composition. Sedimentary rocks generally form in layers (or strata) and often contain fossils.

Metamorphic rocks are formed when sedimentary or igneous rocks change (think about the metamorphosis of a caterpillar into a butterfly) when they are exposed to high heat, high pressure, and/or hot mineral-rich fluids. This can happen deep within the Earth or where tectonic plates meet and can change the texture, chemistry, and appearance of the protolith (what the rock started as) by squeezing the minerals into a foliation (think layers or banding) so metamorphic rocks are first classified by whether or not they are foliated. When so much heat is added that the rock melts, the rock can turn into magma (or lava) and become an igneous rock when it cools!


All ages: Find-A-Feature!
What examples of rocks and/or minerals can you find near where YOU live? A few of our Find-A-Feature challenges relate to rocks. Play along with this online challenge to find examples of layers (strata), fossils, or vesicles.
What about the geology near me?

This image of the geology of North America can be downloaded here, along with more information. Do you want to know about the rocks under your feet? You find out about the local geology near you at the USGS-AAPG National Geologic Map Database, where you will find geologic maps, reports, and other near you compiled from over 630 agencies, universities, associations, and private companies. Detailed geologic mapping has not been completed for the entire United States, but maps are available for most places. Or, you can purchase paper copies of many maps for your classroom or living room at the USGS Store.
All Ages: Start your own Rock Collection
As a geologist, you need to practice describing rocks in detail. It's not enough just to say "it's a rock." You need to be very specific and mention each of the properties that make one rock different from another.
Find some particularly interesting rocks. They can be either natural or human-made. Take a good careful look. What characteristics does each rock have that are intrinsic to the rock - that would not change, for example, if the rock broke in two, or you washed it off. For example, for a person, the color of their eyes, shape of their nose, cowlick in their hair - these things don't change easily. On the other hand, the clothes they are wearing, and even size, can change more easily. If you want to always recognize that person, make note of the things that don't change. It is the same with rocks. Here is a table that you can use to help guide you to describe rocks clearly. You'll describe the following properties:

You can use this template to make a card for each rock in your collection. Once you have a good description, you will be able to use the properties of the rock to give it a name.

Grades 3-8: Rocks and minerals in pencils?

Did you know that you use rocks and minerals every day? Some things may be obvious, such as jewelry or aluminum foil, but there are many, many other uses for rocks and minerals - and your cell phone wouldn’t work without them! You can see more examples in the information sheet Do We Take Minerals for Granted?
For now, however, take a close look at a pencil. Did you know that pencils contains three examples of Earth materials: graphite (pencil “lead” but does not contain actual lead (Pb)), clay minerals to help the graphite stick together (commonly called), and aluminum metal (from bauxite, aluminum ore) to attach the eraser to the end of the wood. The wood is organic, so it’s not a mineral.

Grades 6-12: Did your phone just vibrate? Thank a mineral!
Speaking of cell phones, here’s a great resource from the USGS National Mineral Information Center, A World of Minerals in Your Mobile Device. What minerals make the display screen or battery work? What minerals make vibration possible? Where on Earth can these minerals be found?

Grades 6-12: Minerals and Geopolitics: Have you ever wondered where different rocks and minerals are found, or how they are removed (extracted) from the ground? Use the map on page two of the Minerals in your Mobile Device above to find the source of three minerals needed to make a cell phone. Consider the locations(s) where each mineral is found, the geopolitical relationship that the United States has with that country, whether each mineral is economically viable to extract. What interdisciplinary skills would you use to tackle these questions?
Week 11: 5/26 Invasive Species
What is an invasive species?

An invasive species is an introduced, nonnative organism (plant, animal, disease, or parasite) that starts to spread its range from the site of its original introduction and that may harm the environment, the economy, or human health. Some examples of invasive species include:
Unintentional introduction: West Nile virus, chestnut blight, the South American fire ant, zebra mussels, Burmese pythons, and sea lamprey
Intentional introductions of salt cedar (Tamarisk), kudzu vine, house sparrows, starlings, and nutria.
The USGS Ecosystems Mission Area’s Invasive Species Program focuses on invasive organisms throughout the United States. USGS scientists work with partners in the Department of the Interior (DOI) and other Federal, State and Territorial agencies, Tribes, industry, and agricultural partners to provide the information needed to help solve problems posed by these invaders. Invasive species aren’t just plants and animals, but also diseases and disease-causing microorganisms (such as bacteria, viruses, and fungi) that can spread fast and have significant impacts. To read or download a USGS Invasive Species Fact Sheet (2018), click here.
Nonindigenous Aquatic Species (NAS) Program
The USGS Nonindigenous Aquatic Species (NAS) Program maintains a database that monitors, records, and analyzes sightings of nonindigenous aquatic plant and animal species throughout the United States. The program is based at the USGS Wetland and Aquatic Research Center in Gainesville, Florida. The NAS database houses confirmed sightings of nonindigenous, also known as nonnative, aquatic species throughout the Nation. The program provides scientific reports, online/real-time queries, spatial data sets, regional contact lists, and general information. The data covers the United States and is made available for anyone curious about nonindigenous animals across the U.S.
Grades 6-12: What nonindigenous (nonnative) aquatic species live near me? How can I report a sighting?
Step 1: What invasive species are near me? Go to the Nonindigeous Aquatic Species (NAS) website. Select which state and county where YOU live. Have any invasive species been reported near your home? If so, which ones? Can you use that information to track the distribution? Do you have any ideas about how these species may have gotten there? Note: Some aquatic plant and animal species can enter a new area during flooding related to storms and hurricanes. Other species can be introduced to an area by humans, for example, through the release of pets that are no longer wanted or have grown too large to care for. Sometimes aquatic animals like zebra mussels or plants like hydrilla can attach to boats; as the boat moves between water bodies, it can spread the invasive species into new areas – these are sometimes called aquatic hitchhikers! Some species were introduced to the United States from other countries, such as nutria, a beaver-like animal brought from South America around the 1930s so it could be farmed for its fur.
The real-time query produces graphical representations of NAS data. For example, this pie chart shows the proportion of species that have been introduced into the United States that belong to various taxonomic groups (example from Virginia, downloaded on 5/20/2020) – and more!

Step 2: Report what you find! Keep an eye out for nonindigeous plants and animals that you may see near your home. Then, report any that you find to the USGS Nonindigenous Aquatic Species Program, a database that helps monitor the introduction and spread of aquatic non-native and invasive aquatic species. Each submission is reviewed by the experts at the Wetland and Aquatic Research Center before it’s entered in the database. Be sure to include a photo and the location where you spotted it and become a citizen scientist who helps track the distribution of invasive species!
Invasive Plants

USGS researches many invasive plants found in wet and dry environments from sea level to above 5,000 feet. Some examples include invasive grasses such as cheatgrass and medusahead found throughout sagebrush ecosystems in the western U.S., and the invasive aquatic plant elodea found in Arctic and Subarctic ecosystems.
One cool way that USGS scientists study invasive plants is with aerial imagery from Landsat, like this image of near real-time cheatgrass cover prediction. Learn more about this at the USGS Earth Resources Observation and Science Center (EROS) and check out their fun, online puzzles while you’re there.
Grades 3-6: Invasive Species as seen from above
Imagine you’re a farmer in the region of the map below, why do you think it may be useful to understand where this invasive species is located?
To watch a USGS YouTube video (2:24) about invasive plants in Channel Islands National Park in California, click here.
Buffelgrass: /faqs/what-buffelgrass?qt-news_science_products=3#qt-news_science_products
Grades 3-12: Phenology & Nature’s Notebook
Phenology is the study of the timing plant and animal life cycles over the course of a calendar year. We featured Nature’s Notebook in Week 1 of our Learn From Home page, but for a quick review, Nature’s Notebook is a customizable national phenology program by the USA National Phenology Network, and supported by the USGS. This program collects phenology data from professional and volunteer scientists to record long-term observations of plant and animal life stages. Explore the National Phenology Network here, and make some observations about nature in your neighborhood.
For fun activities for all grade levels, visit the Nature’s Notebook Activity page.
Invasive Animals

Invasive Animals such as fish, reptiles, amphibians, birds, mammals (and more) can disrupt terrestrial (land) and aquatic (water) ecosystems. Here are a few examples, with links to discover more about USGS science.
A fish that can jump? One example of a group of invasive fish are Asian carp, which include silver carp, big-head carp, grass carp, and black carp. This video (0:39) shows acrobatic carp jumping out of the water in the Illinois River! And this video (17:20) looks at how USGS used many different tools to try to reduce invasive carps in Illinois. This story map is one way to learn about these invasive fish.

The Humpback Chub is not an invasive fish, but it is an example of a native fish in the Grand Canyon section of the Colorado River that has to compete with nonnative fish, such as the rainbow trout, that have been introduced into the Colorado River as a sportfish for the economically important recreation industry. Learn more in this podcast, by the USGS Ecosystem Mission Area.
Grades K-2: Dot-to-Dot, Coloring Sheets, and a DIY sea lamprey sock puppet!
For coloring sheets from the USGS Ecosystems Mission Area, including invasive species such as the red-eared slider and the American bullfrog, click here.

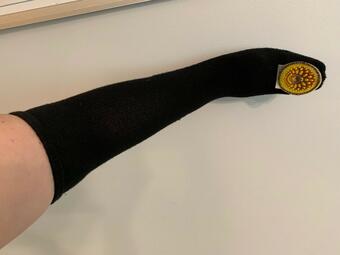
Grades K-5: Whoa…Is that an alien? Nope, it’s a sea lamprey! Learn about USGS sea lamprey research here, then make your own sock puppet, based on this USGS photo, by printing out this image, sized to fit on a sock. You can also print it in black and white, color it however you wish, and stick it to a sock with a piece of tape – no need to cut holes in the sock!


Wow, that’s a big snake!
Burmese pythons are large, invasive snakes, which that can be more than 18 feet long and weigh more than 150 pounds! Burmese pythons are known to have eaten several endangered species including birds and mammals. How have invasive Burmese pythons affected Florida ecosystems?
Grades 4-6: Math fun? If this snake weighs 160 pounds, and it takes six people to carry it, approximately how many pounds does each person carry?

Whoa, there’s a giant lizard in my yard!
This is a black and white tegu, a nonnative, invasive lizard from South America that is now found in the wild in North America.

Go batty!
Did you know that USGS researchers in many places across the United States study bats? Bats are important parts of food webs across the country, and some species of bats are even pollinators! Read an interesting blog post from the Department of the Interior (DOI) – 13 Awesome Facts About Bats -- here.
Invasive pathogens include diseases and disease-causing microorganisms (such as bacteria, viruses, and fungi) of plants and animals that can spread rapidly. USGS scientists are working on numerous diseases in both plants and animals such as white-nose syndrome, which effects some species of bats. This syndrome gets its name from an invasive pathogen that causes a white fungus that infects the skin on the muzzle, ears, and wings of hibernating bats and was discovered by USGS scientists!
Researchers from the National Wildlife Health Center, Fort Collins Science Center Pacific Islands Ecosystems Research Center, Upper Midwest Environmental Science Center and the Western Ecological Research Center study this wildlife disease, and you can learn more about their research on white-nose syndrome here.
Good news! Some bats, such as the hoary bat, may be resistant to the white-nose syndrome-causing fungus, or infections have not been documented.

Grades K-2: Coloring
The Western Ecological Resource Center posts newsletters, fact sheets, and several available coloring sheets on their outreach page.
What is eDNA?
Environmental DNA, or eDNA for short, uses genetic material (e.g., skin cells, hair, mucus, waste) that an animal sheds or excretes into its surroundings, to detect invasive species. This is a great tool to study species that are hard to find. This tool has been used to find Burmese pythons in the Everglades (they’re very good at hiding) and zebra and quagga mussels in the western U.S.. Scientists collect eDNA by filtering it out of environmental samples, such as water from a lake that an organism may have passed through recently. The USGS uses this technology to find aquatic animals like fish, amphibians, and reptiles. Resource managers use the information the USGS provides to prevent the spread of invasive species and manage lands and waters where they’ve been found. You can also head on over to the USGS Water Science School for an FAQ about eDNA.
All ages: eDNA, What’s the Big Idea? This short (2:35) video by a research zoologist at the USGS Northern Rocky Mountain Science Center explains how eDNA is used to detect invasive species, and this video (USGS YouTube, 4:20) from the USGS Upper Midwest Environmental Science Center, shows how a portable eDNA screening tool is used in the field.
Week 10: 5/18 Volcanoes & the 40th anniversary of Mt. St. Helens Eruption

This week, we’re highlighting the science of volcanoes and the 40th anniversary of the 1980 Mt. St. Helens eruption. Volcanoes (and earthquakes) are common at convergent and divergent plate boundaries. Week 9: Plate Tectonics has a brief summary of the three ways that tectonic plates interact with one another. The USGS Volcano Hazards Program monitors and researches volcanoes in the United States and abroad, through the Volcano Disaster Assistance Program.

Are all volcanoes the same? Did you know that there are different types of volcanoes? Volcanoes are classified by their size and shape, which are mostly controlled by the type of lava and other volcanic materials that formed them. The chemistry, gas content, and silica content are factors that control what type of material comes out of a volcano. More felsic (higher silica) lavas tend to be stickier and erupt more violently. More mafic lavas (lower silica) tend to flow more easily and erupt less violently. Can you think about liquids that are stickier than water? Perhaps glue or maple syrup? For now, let’s think about glue representing a more felsic (higher silica, higher viscosity, more resistant to flow) lava and water representing a more mafic (lower silica, lower viscosity, less resistant to flow) lava. If you accidentally tip over an open bottle of glue and a glass of water at the same time, do they flow at the same rate?
Cinder Cones are relatively small (generally <1000 feet tall), steep-sided volcanoes built from particles of lava ejected from a single vent. As the gas-charged lava is blown violently into the air, it breaks into small pieces known as cinders that cool and solidify as they fall through the air. There are many cinder cones in western North America and throughout the world.
Geographic examples: Sunset Crater National Monument, AZ, Wizard Island, OR, Amboy Crater, CA
Composite Cones (Stratovolcanoes) are large (~8,000-10,000 feet tall from their base), steep-sided symmetrical volcanoes that are made up of alternating layers of lava flows, ash, and other volcanic materials, and commonly occur near convergent plate boundaries.
Geographic examples: The Cascade Range (including Mt. St. Helens), Mt. Fuji, Japan. The USGS Cascade Volcano Observatory (CVO) monitors and researches the volcanoes in the Cascade Range in the Pacific Northwest, USA.
Shield Volcanoes are the largest (up to ~28,000 feet tall from their base) type of volcanoes, and have broad, low-angle slopes. Shield volcanoes are made nearly entirely of fluid basaltic lava and are often associated with hot spots. Hot spots are volcanic areas that do not occur near plate boundaries and are sometimes called intraplate volcanoes because they occur within a tectonic plate instead of at or near the edges.
Geographic examples: Mauna Loa, Mauna Kea (The Hawaiian Islands). The USGS Hawaiian Volcano Observatory (HVO) monitors and researches the volcanoes in Hawaii. In 2018, Kilauea on the Big Island of Hawaii experienced volcanic activity. Learn about that here.
All Ages: Visit some volcanoes virtually at our Geology & Ecology of the National Parks website.
Cascade Volcanoes:
Other Volcanic National Parks/Monuments:
Capulin Volcano National Monument
Grades K-2: Clay/Play-Doh Volcanoes:

Build your own volcanoes: 1) Cinder Cone (smallest), 2) Stratovolcano (large, steep-sided) 3) Shield Volcano (largest, lowest-angle sides), 3) . Here’s one example, show us your volcano models by tagging us on Twitter or by e-mailing us at usgs_yes@usgs.gov.

Grades K-2: Sink or Float?
You have likely played “sink or float” in the bathtub or swimming pool before, so you already know something about density and buoyancy and that some objects float more easily than others. For instance, beach balls don’t make very good diving toys because they’re so buoyant. Lava with a very high gas content cools so fast that holes (vesicles) are left behind in the lava even after it cools. This rock is known as pumice. Do you have something at home like this? Perhaps a sponge or a styrofoam ball? If so, take it in the bath with you and see what happens when you try to make it sink.
Grades 5-9, with extensions for elementary/high school: Living with a Volcano in your Backyard

This USGS-NPS lesson plan by the USGS Cascade Volcano Observatory (CVO) and Mt. Rainier National Park includes a general overview of the Cascade Range, a pre-assessment activity, information about how volcanoes work and how to prepare for volcanic hazards. Also includes an Educator’s Guide. CVO also works with Mt. Rainier National Park to offer teacher workshops based on this resource.

Grades 4-12: 3D Paper Model of a Stratovolcano. What do stratovolcanoes look like on the inside? Download this free, printable model here.
MOUNT ST. HELENS
Mt. St. Helens is a volcano in Washington, near the Oregon border, in the Cascade Range. The Cascade Volcanoes, which stretch all from British Columbia through Northern California, are stratovolcanoes that have formed inland from a convergent plate boundary, where ocean crust is subducting below the continent. There are 18 in all, and Mt. St. Helens is the most recent to have erupted. One of the reasons it is so significant is that USGS has been able to carefully monitor the mountain starting before the eruption and continuing through today, and through that work we have learned a lot about how volcanoes work, and we have been able to save lives around the world by putting that knowledge to use. For a hot-off-the-press (May 2020) from the USGS Volcanoes team, entitled Ten Ways Mt. St. Helens Changed Our World-The Enduring Legacy of the 1980 Eruption, click here.

In the Spring of 1980, Mt. St. Helens in the Pacific Northwestern state of Washington, began showing signs of unrest. At 8:32 am on May 18, 1980, Mt. St. Helens experienced a dramatic, nine-hour long volcanic eruption and a massive debris avalanche on the north side of the volcano. How far did the ash travel and how much ash erupted that day? Look at these images of Mt. St. Helens before, during, and after May 18, 1980. What do you notice? How do you think the elevation changed? Click here to see the answer. What does Mt. St. Helens look like today? Visit the U.S. Forest Service live webcam here.


Grades K-2: Color a volcano!
Download this free USGS coloring sheet of the Mt. St. Helens eruption, based on a USGS photo.

Grades 3-6: Downloadable poster for kids: 30 Cool Facts about Mt. St. Helens
Grades 6-8: When will this volcano erupt next?
Here’s an exercise that uses USGS data from Mt. St. Helens to show how scientists predict an eruption.
Grades 6-12: Protect your town!
Read the USGS resources about volcanic ash and pretend that you are an emergency Manager responsible for keeping your town safe during a volcanic eruption with a significant amount of ash. Based on this information, what steps would you take to keep your town safe?
Grades 6-12: Videos and publications
There are several USGS Official YouTube videos about Mt. St. Helens (MSH). Enjoy these videos Video length is given in parentheses.
The May 18, 1980 Eruption (7:30)
MSH: A Catalyst for Change (6:30)
Onset of the 2004-2008 Mt. St. Helens eruption (1:12)
2004 Steam, Ash Emissions, and Dome Growth (57:48)
2004-2006 USGS Instrumentation and Dome Growth (13:46)
2018 Unmanned Aircraft System (UAS) Monitors Gas Emissions at Mt. St. Helens (4:28)

All ages: Some of the best Mt. St. Helens photos we’ve seen! The USGS Library System recently compiled a USGS photograph collection, maps, and related publications highlighting the May 18, 1980 eruption, including this impressive photo to the right. Visit the USGS Library Mt. St. Helens website here.
Additional USGS Publications about Mt. St. Helens
https://pubs.usgs.gov/gip/volcus/
https://pubs.usgs.gov/gip/msh/climactic.html
Teachers: Here are some recommended teaching messages about Cascade Range volcanoes.
External (Non-USGS) Links about Mt. St. Helens

The Mount St. Helens Institute has compiled information about the 40th anniversary of the May 18th, 1980 eruption, including public lectures, activities, and more!

The Portland Art Museum hosted an art and science exhibit in 2020 including carvings from indigenous NW peoples, artwork from the late 1800s and leading up to the 1980 eruption, photography, ceramics, paintings, and even a reading room with USGS publications and equipment.
Week 9: 5/12 Plate Tectonics
This week, we’re highlighting Plate Tectonics. Plate Tectonics is the theory that Earth's lithosphere (the crust and upper mantle) is made up of about a dozen plates that move relative to each other. Earthquakes and volcanoes commonly occur at or near plate boundaries. The USGS monitors and researches earthquakes, assesses their impacts and hazards, and more, as part of the National Earthquake Hazards Reduction Program (NEHRP), a four-agency partnership established by Congress.
The largest US earthquake, a magnitude 9.2 quake in Alaska in 1964, helped to frame our understanding of the new, at the time, theory of Plate Tectonics. Watch the video (linked above) to learn how this earthquake helped USGS scientists learn more about Earth, and what happens in a really large earthquake.


Understanding Tectonic Plate Boundaries: Earth is a sphere and there are three main ways that the tectonic plates interact with each other as they move around the planet, powered by Earth’s internal heat.

Grades 4-12: Build a Model or two: You can learn more about plate motion here and can even make your own 3D version of Earth’s tectonic plates on an old tennis ball with this downloadable model.
The San Andreas Fault: Build your own San Andreas Fault with this model, and demonstrate the movement and damage from the earthquake that shook-up the World Series in 1989.
All Ages: Plate Motions: There are many great ways to envision how tectonic plates move, and each has its advantages (apples are great because the core is at the middle and the skin is thin like Earth’s crust. Oranges are great because it’s easier to break the skin into large pieces.
For now, let’s think about each type of plate boundary by moving our hands, or two other objects, in these three different ways. At each plate boundary, crust is either created, destroyed, or conserved.

Transform Plate Boundaries: Hold your hands flattened out next to each other with your thumbs folded down. Move your left hand away from your body.
What’s going on here? At transform plate boundaries, tectonic plates slide past each other. Crust is neither created nor destroyed.
Where on Earth does this happen? The San Andreas Fault system, perpendicular to spreading centers.
What features will I find here? Fractured crust, shallow, large earthquakes


Divergent Plate Boundaries: Hold your hands flattened out next to each other with your thumbs folded down. Move your hands away from each other.
What’s going on here? As two tectonic plates move away from each other, lower density material (magma) rises to fill the void, and new crust is created. As the magma cools and lithifies (hardens and solidifies into rock), it also records the direction of current magnetic north. This trapped magnetic signature helps geologists understand the ages of ocean basins.
Where on Earth does this happen? The Mid-Atlantic Ridge (a long line of underwater volcanoes between North/South America and Europe/Africa), the East African Rift Zone
What features will I find here? Lines of volcanoes, earthquakes


Convergent Plate Boundaries: Hold your hands a few inches away from you, with your fingers pointing toward each other. A few different things can happen next based on the type of crust of the interacting plates. When two plates converge (collide), the plate with the greater density will be forced under (slide deeper) the plate that is more buoyant (lower density). To simplify this, ocean crust (basalt) is generally thinner and less buoyant (denser) than continental crust (granite). Older crust is generally colder (and less buoyant, denser) than younger crust.

Oceanic-Continental collision: Move the fingers of your left hand (oceanic crust) under your right hand (continental crust). Arch the knuckles of your right hand – that's where volcanic mountains form.
What’s going on here? Oceanic crust is denser than continental crust. When it collides with continental crust, it subducts deeply below the continental crust. As the descending crust gets deeper, it partially melts and expels water, creating magma. Magma is less dense than the surrounding material, so the magma rises. Sometimes the magma cools before it reaches the surface (forming the igneous rock named granite) and sometimes it erupts violently to form volcanoes. Crust is destroyed (recycled).
Where on Earth does this happen? Andes Mountains (western margin of South America) Cascade Mountains (Northwestern United States). Note: Next week is the 40th anniversary of the 1980 Mt. St. Helens eruption!
What features will I find here? Subduction zones create a deep trench, which is where the two plates meet, and a line of large, composite cone volcanoes on the continental plate side, roughly parallel to the plate boundary. There are deep earthquakes here as well.

Oceanic-Oceanic Collision:
What’s going on here? If both plates are made of continental crust, they are likely to be of similar density, too. However, whichever plate is older, colder, and denser, will be forced beneath the other plate. This creates long, lines of volcanic islands. Crust is destroyed.
Where on Earth does this happen? Aleutian Islands (Alaska, USA), the Phillipines.
What features will I find here? Island arc volcanic chains, trenches, large earthquakes

Continental-Continental collision:
What’s going on here? If both plates are made of continental crust, they are likely to be of similar density, which is more buoyant than oceanic crust. They can’t be forced down, so the only direction to go is up, resulting in tectonic uplift (mountain-building).
Where on Earth does this happen? Himalaya Mountains (these were created by the collision of India with Asia, and this convergent motion is still happening today), the Alps, and the Appalachians (which are much more ancient)
What features will I find here? High-elevation mountains, high plateaus, earthquakes.


Grades 4-9: Make your own seafloor spreading model
Did you know that the seafloor is striped like a grocery barcode? The stripes aren’t visible by color; it is actually their magnetic signature that is striped, and is symmetrical moving away from a divergent plate boundary, matching on opposite sides of the spreading center (or rift). Learn more about this here (This Dynamic Earth). Scientists often illustrate this with black and white stripes, so the illustrations can look like a barcode.

To make your own model of a mid-ocean ridge spreading center, bend a piece of cardboard and cut a slit in the middle. Make two paper strips of identical (but mirror image) black and white strips of varying thicknesses. Tape them together at the bottom and bring them upward through the slit in the cardboard. Extend both strips outward from the slit. Every time they move, new lava cools, recording the location of magnetic north and the ocean basin is getting larger! For a more complex model, you can use an entire box to show mantle convection and the divergent plate motion.

Earthquakes!
An earthquake is a sudden slip along a fault (or fracture within the Earth where movement occurs) and the ground shaking and energy caused by the slip, or by volcanic/magmatic activity.
Most (~90%) earthquakes and volcanoes happen at or near tectonic plate boundaries. See this map of all the earthquakes in the United States between 1900-2018 and download your own poster for your classroom or living room.
All Ages: Earthquakes over 15 years.
Our friends at the NOAA created an animation of the earthquakes from 2000-2015. Take a look at that here. The size of the dot represents the size of the earthquake, while the color is the depth. What patterns do you see? You may want to watch more than once, and concentrate on different things.
- How often do really big earthquakes occur?
- Where are the deepest earthquakes (purples and blues)
- What do you notice about size and depth of earthquakes on the mid-ocean ridges?
- Are there places with no earthquakes?
- Why do you think NOAA’s Pacific Tsunami Warning Center is so interested in USGS earthquake data?
A scientist who studies earthquakes is called a seismologist (pronounced “size” mall-o-gist). Want to become a seismologist? Here are some of the skills you’ll need and some steps to take to become an earthquake scientist!

All Ages: Explore the USGS Earthquakes for Kids site
Learn all about earthquakes here, you can explore animations, photos, cool facts, even careers in earthquake science!
All Ages: Shake Out! Do you know how to stay safe during an earthquake? Hint: Don’t stand in a doorway or run outside. Drop, Cover, Hold On! Learn more from ShakeOut and from the Federal Emergency Management Agency (FEMA).

All Ages: Did you feel it? If so, report it here with the USGS Did You Feel It Citizen Science project. This website collects information from people who felt an earthquake and creates maps that show what people experienced and the extent of damage. Chances are there is not an earthquake happening right now, but check out the site so you know where to report next time you feel an earthquake!
Grades 6-12: What If? The Hayward Fault, near San Francisco, California has experienced strong earthquakes. This interactive story map lets you learn about what it might be like the next time the Hayward fault has a large earthquake by experiencing a hypothetical magnitude 7.0 “HayWired” earthquake. At USGS, we love maps. Check out this interactive map about the faults in the United States. Can you find one near where you live? Why or why not, based on what you now know about plate tectonics? Has an earthquake happened near where you live? Use this quake search map to find out click here to find up-to-date earthquake summary posters!
What’s the difference between earthquake magnitude and intensity? Try this USGS exercise to learn about all about it!
Do you live in Alaska? Learn about the Great Alaska Quake of 1964 here and watch a YouTube video of buildings shaking in downtown Anchorage, AK.
Do you live in the San Francisco area? Watch a cool USGS YouTube video about what scientists understand 100 years after the 1906 San Francisco earthquake and download a 30-year earthquake outlook for the San Francisco Bay region for map for 2014-2044 here.

Wherever you live, you may have heard about the earthquakes near Ridgecrest, California in July of 2019.
Grades 9-12: Are you itching to build something? This earthquake model requires tools, wood, a brick, PVC, and a bit of ingenuity, but it is a lot of fun. See what you have lying around, and innovate if you need to. If you build it, we’d love to see it. Tag us on Instagram or Twitter @usgs_yes