U.S. flag

An official website of the United States government

Images

Images related to Deep Sea Exploration, Mapping and Characterization.

Filter Total Items: 87
Anemones attached to a rocky outcrop on the seafloor.
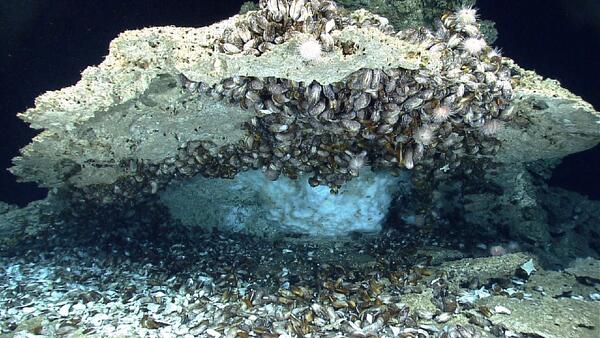
Pom-pom anemone on the Pacific Ocean floor off California

These “pom-pom” anemones (Liponema sp.) have attached to the rock in a place where there are probably very good currents, which bring small floating particles of food to them. Water depth is 1041 m (3415 ft).

These “pom-pom” anemones (Liponema sp.) have attached to the rock in a place where there are probably very good currents, which bring small floating particles of food to them. Water depth is 1041 m (3415 ft).

Critters on the bottom of the ocean, a sea star, skate, and rockfish.
Sea life offshore of Morro Bay, California

A small juvenile skate (left) and a large rockfish (right) hang out on the murky, silty seafloor with sea stars. Water depth: 856 m (2808 ft).

Two men stand on the deck of a ship, and one is giving hand signals while they retrieve a large instrument from the ocean.
Retrieving the MiniROV

Retrieving the MBARI (Monterey Bay Aquarium Research Institute) MiniROV from the Pacific Ocean offshore of California, on research vessel (R/V) Bold Horizon.

Retrieving the MBARI (Monterey Bay Aquarium Research Institute) MiniROV from the Pacific Ocean offshore of California, on research vessel (R/V) Bold Horizon.

Black smoke billows out of a crusty vent on the ocean floor.
Mineral-laden water emerging from a hydrothermal vent

Mineral-laden water emerging from a hydrothermal vent on the Niua underwater volcano in the Lau Basin, southwest Pacific Ocean. As the water cools, minerals precipitate to form tower-like “chimneys.” Image taken during 2016 cruise “Virtual Vents.”  

Mineral-laden water emerging from a hydrothermal vent on the Niua underwater volcano in the Lau Basin, southwest Pacific Ocean. As the water cools, minerals precipitate to form tower-like “chimneys.” Image taken during 2016 cruise “Virtual Vents.”  

Colorfully shaded map of the seafloor showing the many unique canyons created by nearby rivers.
Topography and Bathymetry of Southern Cascadia

Topography and bathymetry of southern Cascadia, which includes southern Oregon and northern California (seafloor depths between 200 and 3000 m are shown in the spectrum color scale from red (shallower) to purple (deeper). The land and continental shelf are shown in grayscale slope shading where darker colors represent steeper slopes.

Topography and bathymetry of southern Cascadia, which includes southern Oregon and northern California (seafloor depths between 200 and 3000 m are shown in the spectrum color scale from red (shallower) to purple (deeper). The land and continental shelf are shown in grayscale slope shading where darker colors represent steeper slopes.

3 different views created using multibeam bathymetry data show the fault in bright colors
Perspective views of multibeam bathymetry data acquired by the USGS

Perspective views of multibeam bathymetry data acquired by the USGS aboard the R/V Medeia. Shallower depths in red. Arrows point to the distinct line in the seafloor associated with the Queen Charlotte-Fairweather fault.

Brown lines across the image describe the fault, with labeled features, depth, and width
Multichannel seismic-reflection profile from Queen Charlotte-Fault

Multichannel seismic-reflection profile across the Queen Charlotte-Fairweather fault, acquired aboard the R/V Norseman in August 2016. Dashed red line in enlarged section at lower right is the Queen Charlotte-Fairweather fault. m, meter; km, kilometer; ms, millisecond.

Multichannel seismic-reflection profile across the Queen Charlotte-Fairweather fault, acquired aboard the R/V Norseman in August 2016. Dashed red line in enlarged section at lower right is the Queen Charlotte-Fairweather fault. m, meter; km, kilometer; ms, millisecond.

Up-close view of a hard, dark, lumpy, and rocky mineral surface.
Necker Ridge ferromanganese crust

Top of a ferromanganese crust sample collected from 1,896 meters water depth at Necker Ridge in the central north Pacific. The surface of this crust was in contact with ocean water and grew just 2 millimeters per million years.

Top of a ferromanganese crust sample collected from 1,896 meters water depth at Necker Ridge in the central north Pacific. The surface of this crust was in contact with ocean water and grew just 2 millimeters per million years.

Cross-section of rock with distinct layers of sand grains at core then mostly black, each layer dated back millions of years.
Seafloor crust, Marshall Islands
Cross-sectional view of the earth beneath the seafloor, clear patterns show deformation.
Multichannel seismic-reflection profile, Sitka Sound

Multichannel seismic-reflection profile showing deformed and offset sediment layers below the outer continental shelf west of Sitka. The Sitka Sound fault is one of more than a dozen previously unmapped faults discovered in the July 2017 seismic-reflection data.

Multichannel seismic-reflection profile showing deformed and offset sediment layers below the outer continental shelf west of Sitka. The Sitka Sound fault is one of more than a dozen previously unmapped faults discovered in the July 2017 seismic-reflection data.

Cross-section illustration showing structure beneath the seafloor where sediment layers are deformed by high seismic activity.
Multichannel seismic-reflection profile, QCF fault

Multichannel seismic-reflection profile showing deformed sediment layers on the Pacific plate, just seaward of the Queen Charlotte-Fairweather fault near the south end of the study area. Location of profile shown by southern-most yellow line on trackline map, near Noyes Cyn. (Canyon).

Multichannel seismic-reflection profile showing deformed sediment layers on the Pacific plate, just seaward of the Queen Charlotte-Fairweather fault near the south end of the study area. Location of profile shown by southern-most yellow line on trackline map, near Noyes Cyn. (Canyon).

Schematic showing how sediment on the seafloor moves in response to multiple forces
Schematic showing how sediment on the seafloor moves
Photograph taken from above the stern of the ship, with crew readying the streamer cable for a seismic survey.
Multichannel seismic streamer

A ship will tow this green cable, which contains underwater microphones that record sound reflected off layers beneath the seafloor. USGS scientists will use the data to pinpoint the location of faults.

A ship will tow this green cable, which contains underwater microphones that record sound reflected off layers beneath the seafloor. USGS scientists will use the data to pinpoint the location of faults.

Map illustration showing fault lines and direction of tectonic plate movement along a stretch of the Alaskan coastline.
Study region along the Queen Charlotte-Fairweather fault

Study region along the Queen Charlotte-Fairweather fault offshore southeastern Alaska. Rectangles show locations of the two USGS-led marine geophysical surveys in May and August 2015. The third cruise was offshore Haida Gwaii, British Columbia, and southern Alaska in September 2015.

Study region along the Queen Charlotte-Fairweather fault offshore southeastern Alaska. Rectangles show locations of the two USGS-led marine geophysical surveys in May and August 2015. The third cruise was offshore Haida Gwaii, British Columbia, and southern Alaska in September 2015.

Cross-section illustration showing structure beneath the seafloor with mostly horizontal lines but one clear offset section wher
Multichannel seismic-reflection profile

Multichannel seismic-reflection profile showing sediment layers beneath the seafloor disrupted by the Queen Charlotte-Fairweather fault near Cross Sound. The profile is approximately 16 kilometers across, and it extends approximately 370 meters beneath the seafloor. See related multimedia below, for the location of this profile.

Multichannel seismic-reflection profile showing sediment layers beneath the seafloor disrupted by the Queen Charlotte-Fairweather fault near Cross Sound. The profile is approximately 16 kilometers across, and it extends approximately 370 meters beneath the seafloor. See related multimedia below, for the location of this profile.

Computer-generated illustration of colored, high-resolution seafloor map clearly shows a fault and where the seafloor is offset.
Seafloor trace of the Queen Charlotte-Fairweather fault

Seafloor trace of the Queen Charlotte-Fairweather fault (from top left to bottom right) offsets the edge of the Yakobi Sea Valley off southeast Alaska. This 700-mile-long fault has generated large earthquakes in the past. Future shocks—and tsunamis—could threaten coastal communities in the U.S. and Canada. (Color-coded depths, in meters, were mapped in 2015.)

Seafloor trace of the Queen Charlotte-Fairweather fault (from top left to bottom right) offsets the edge of the Yakobi Sea Valley off southeast Alaska. This 700-mile-long fault has generated large earthquakes in the past. Future shocks—and tsunamis—could threaten coastal communities in the U.S. and Canada. (Color-coded depths, in meters, were mapped in 2015.)

Map illustration showing bathymetry, or depth, and a fault offshore of the Alaskan coastline.
Queen Charlotte-Fairweather fault

Enlarged details of Survey Area 1 showing new multibeam bathymetry data (rainbow colors) acquired on R/V Solstice near Cross Sound and Glacier Bay National Park, southeastern Alaska. Arrows highlight the surface expression, or trace, of the Queen Charlotte-Fairweather fault.

Enlarged details of Survey Area 1 showing new multibeam bathymetry data (rainbow colors) acquired on R/V Solstice near Cross Sound and Glacier Bay National Park, southeastern Alaska. Arrows highlight the surface expression, or trace, of the Queen Charlotte-Fairweather fault.

Was this page helpful?