
Example of reference and validation plots in hi-rez imagery and on the map. For more information on LCMAP product validation, see the LCMAP Website.
Images
Check out our gallery of images related to Land Change Monitoring, Assessment, and Projections (LCMAP) and its product suites below.
Filter Total Items: 28

LCMAP Sample Reference Plots
Example of reference and validation plots in hi-rez imagery and on the map. For more information on LCMAP product validation, see the LCMAP Website.

LCMAP land cover and Landsat imagery from 1985 to 2021 of the Wragg Fire area in California
LCMAP land cover and Landsat imagery from 1985 to 2021 of the Wragg Fire area in CaliforniaThese animations are from the Wragg Fire that occurred north of San Francisco, California, in 2015. On the left is Land Change Monitoring, Assessment and Projection, or LCMAP (v1.3), land cover, with green representing forests (tree cover). On the right is false-color Landsat satellite imagery.

LCMAP 1985 Land Cover for California
This map of California displays the LCMAP (Land Change Monitoring, Assessment and Projection) Primary Land Cover for California in 1985. The green represents forests (tree cover). Learn more in a study. USGS EROS map
This map of California displays the LCMAP (Land Change Monitoring, Assessment and Projection) Primary Land Cover for California in 1985. The green represents forests (tree cover). Learn more in a study. USGS EROS map

LCMAP 2021 Land Cover for California
This map of California displays the LCMAP (Land Change Monitoring, Assessment and Projection) Primary Land Cover for California in 2021. The green represents forests (tree cover). Learn more in the study. USGS EROS map
This map of California displays the LCMAP (Land Change Monitoring, Assessment and Projection) Primary Land Cover for California in 2021. The green represents forests (tree cover). Learn more in the study. USGS EROS map

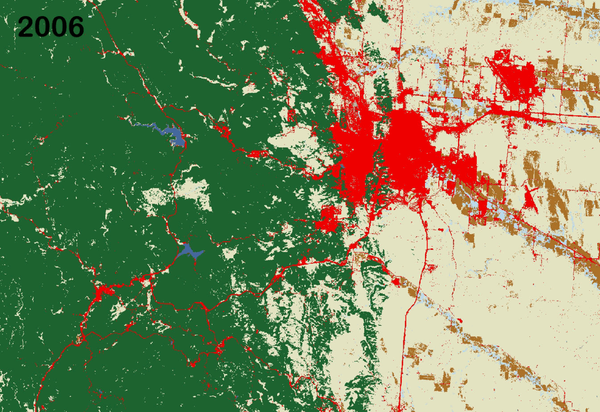
LCMAP land cover and Landsat imagery from 1985 to 2021 in California's Butte and Plumas counties
LCMAP land cover and Landsat imagery from 1985 to 2021 in California's Butte and Plumas countiesThese animations are from Butte and Plumas counties in northeastern California from 1985 to 2021. On the left is Land Change Monitoring, Assessment and Projection, or LCMAP (v1.3), land cover, with green representing forests (tree cover). On the right is true-color Landsat satellite imagery.

LCMAP CONUS Reference Data Download
An illustration of where to download LCMAP CONUS Reference Data. The Reference Data can be downloaded through ScienceBase.
An illustration of where to download LCMAP CONUS Reference Data. The Reference Data can be downloaded through ScienceBase.

An Illustration of where to download LCMAP CONUS Validation tables.
An Illustration of where to download LCMAP CONUS Validation tables.An illustration od where to download LCMAP COMUS Validation Tables. The table are located on ScienceBase.
An Illustration of where to download LCMAP CONUS Validation tables.
An Illustration of where to download LCMAP CONUS Validation tables.An illustration od where to download LCMAP COMUS Validation Tables. The table are located on ScienceBase.

Anderson Level II Land Cover over northern Atlanta, GA
Anderson Level II Land Cover over northern Atlanta, GAAnderson Level II Land Cover over northern Atlanta, Georgia from 1985 to 2020.
Anderson Level II Land Cover over northern Atlanta, GA
Anderson Level II Land Cover over northern Atlanta, GAAnderson Level II Land Cover over northern Atlanta, Georgia from 1985 to 2020.

LCMAP word map
USGS LCMAP wordle art map image for LCMAP and LC Next news release. Figure caption: Research, policy, and planning uses of the National Land Cover Database.
USGS LCMAP wordle art map image for LCMAP and LC Next news release. Figure caption: Research, policy, and planning uses of the National Land Cover Database.

Land Cover Class Legend
Level 1 LCMAP land cover classifications as outlined in LCMAP products: Developed, Cropland, Grass/Shrub, Tree Cover, Water, Wetland, Ice/Snow, and Barren.
Level 1 LCMAP land cover classifications as outlined in LCMAP products: Developed, Cropland, Grass/Shrub, Tree Cover, Water, Wetland, Ice/Snow, and Barren.

Hawaii LCPRI 2020
The Primary Land Cover (LCPRI) product over Hawaii for product year 2020. LCPRI shows the most likely thematic, classified land cover class on July 1 of the current year.
The Primary Land Cover (LCPRI) product over Hawaii for product year 2020. LCPRI shows the most likely thematic, classified land cover class on July 1 of the current year.

Hawaii Reference Data
Land Change Monitoring, Assessment, and Projection reference sample distribution across Hawaii on simulated background.
Land Change Monitoring, Assessment, and Projection reference sample distribution across Hawaii on simulated background.
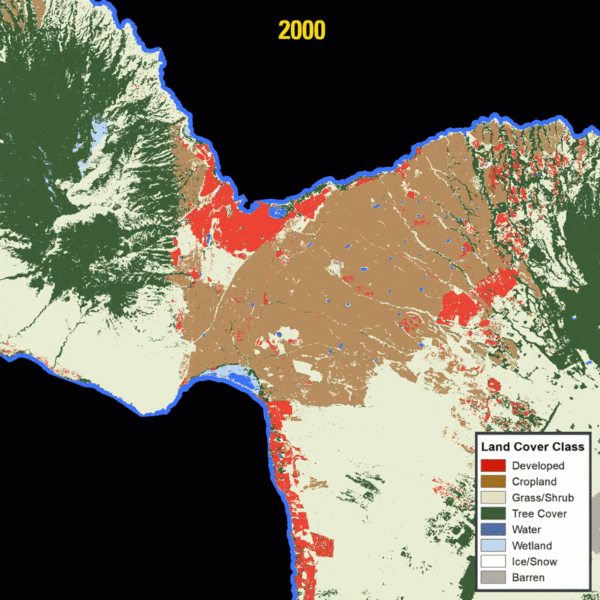
Maui Land Change
LCMAP’s Primary Land Cover (LCPRI) from 2000 to 2020 over Maui, showing an area that was previously croplands (sugar plantations). Over the last several years, the island area has gradually converted to grass/shrub as land uses shifted away from agriculture.
LCMAP’s Primary Land Cover (LCPRI) from 2000 to 2020 over Maui, showing an area that was previously croplands (sugar plantations). Over the last several years, the island area has gradually converted to grass/shrub as land uses shifted away from agriculture.

Tutorial_Image_Tile.png
A screenshot from the "Accessing LCMAP Data via the USGS EarthExplorer Machine-to-Machine API" tutorial, demonstrating how to browse images within a tile bundle.
A screenshot from the "Accessing LCMAP Data via the USGS EarthExplorer Machine-to-Machine API" tutorial, demonstrating how to browse images within a tile bundle.

LCMAP Web Viewer
Screenshot of web viewer for USGS Land Change Monitoring, Assessment, and Projection (LCMAP) initiative.

LCMAP animation - solar farm
An animation of the growth of a solar farm, created using Land Change Monitoring, Assessment, and Projection data.
An animation of the growth of a solar farm, created using Land Change Monitoring, Assessment, and Projection data.

Landsat ARD tiles used for LCMAP
Image of Landsat ARD tiles used for USGS Land Change Monitoring, Assessment, and Projection (LCMAP).
Land Change in the Black Hills - LCMAP
Animation of land cover change in the Black Hills, created using Land Change Monitoring, Assessment, and Projection data from the USGS Earth Resources Observation and Science (EROS) Center.
Animation of land cover change in the Black Hills, created using Land Change Monitoring, Assessment, and Projection data from the USGS Earth Resources Observation and Science (EROS) Center.

Roger Auch Presentation at LCMAP Workshop
USGS Earth Resources Observation and Science (EROS) Center scientist Roger Auch presents on Land Change in the Piedmont Ecoregion at a November 2018 workshop on Land Change Monitoring, Assessment, and Projection in Sioux Falls, SD.
USGS Earth Resources Observation and Science (EROS) Center scientist Roger Auch presents on Land Change in the Piedmont Ecoregion at a November 2018 workshop on Land Change Monitoring, Assessment, and Projection in Sioux Falls, SD.

LCMAP Workshop - Validation
USGS Earth Resources Observation and Science (EROS) Center contractor Bruce Pengra presents on LCMAP validation during a workshop in Sioux Falls, SD.
USGS Earth Resources Observation and Science (EROS) Center contractor Bruce Pengra presents on LCMAP validation during a workshop in Sioux Falls, SD.